To link to this article: DOI:
10.1016/j.comcom.2016.05.006
URL:
http://dx.doi.org/10.1016/j.comcom.2016.05.006
Any correspondence concerning this service should be sent to the repository
administrator:
[email protected]
O
pen
A
rchive
T
OULOUSE
A
rchive
O
uverte (
OATAO
)
OATAO is an open access repository that collects the work of Toulouse researchers and
makes it freely available over the web where possible.
This is an author-deposited version published in:
http://oatao.univ-toulouse.fr/
Eprints ID: 15833
To cite this version:
Baudic, Gwilherm and Pérennou, Tanguy and Lochin,
Emmanuel Following the Right Path: Using Traces for the Study of DTNs.
(2016) Computer Communications, vol. 88. pp. 25-33. ISSN 0140-3664
Following
the
right
path:
Using
traces
for
the
study
of
DTNs
G.
Baudic
∗,
T.
Perennou,
E.
Lochin
ISAE-SUPAERO, Université de Toulouse, 10 avenue Edouard Belin, 31055 TOULOUSE Cedex 4, France
Keywords: DTN Real traces Datasets Trace collection Statistical analysis
a
b
s
t
r
a
c
t
Contacttracescollectedinrealsituationsrepresentapopularmaterialforthestudy ofaDelay
Toler-antNetwork. Three main usecases can bedefined for traces:social analysis,performance evaluation
and statistical analysis. In thispaper, we performareview onthe technicalities ofreal trace
collec-tionand processing.First, weidentifyseveralfactorswhichcan influencetracesduring collection,
fil-teringor scaling, and illustrate their impact on the conclusions, based onour experience with four
datasetsfromtheliterature.We subsequentlyproposealistofcriteriatobeverifiedeachtimeatrace
istobeused,alongwithrecommendationsonwhichfilterstoapply dependingontheenvisioneduse
case.The rationaleis toprovide guidelinesfor researchersneedingto performtraceanalysis intheir
studies.
1. Introduction
Recentyearshaveseenamajorgrowthinthenumberofmobile devices, almost all providing network connectivity through NFC, BluetoothorWiFitonameafew.Thishasmadeboth opportunis-tic andDelay Tolerant Networks major topicsof interest. Assess-ingtheperformanceofsuchnetworksisanecessarysteptowards theirdeployment.Sofar,thistaskoftenreliesontracesordatasets (wewillusebothtermsindistinctly)includingContactTimesand Intercontact Times between nodes, coming either fromsynthetic modelsorcapturedinreal-lifesituations.
At firstglance, traces suchas theonesavailable atCRAWDAD seem to be the most realistic material usablefor Delay Tolerant Network studies. There are however strong hypotheses captured into these traces:the capture setting (conference, campus...), the radiotechnology(Bluetooth,WiFi),thenumberofnodes,thetotal duration, the scope (standard workinghours vs. round-the-clock recording), and the sampling period. Furthermore,because these data collection efforts are usually hard to perform, only few re-search teams havemanagedto providesuch datasets.This ledto sometracesbeingusedmuchmoreoftenthanothers.Forthe pur-poseofthisstudy,we focusondatasets containingcontacttimes betweendevices.GPSlogsornetworklogsareconsequentlyoutof thescopeofthispaper.
∗ Corresponding author.
E-mail addresses: [email protected] (G. Baudic), [email protected] (T. Perennou), [email protected] (E. Lochin).
In [2], we already studied the impact of some filtering tech-niqueson thestatisticalanalysisofcontactdatasets. Wechose to focus on statistical distributions instead of network performance dueto their use in some proposals in the literature [7,24], aim-ingatscalingthecapturednetworksintermsoftimescaleand/or numberofnodes.Wefoundoutthatamongthefiltersused,some hadamajorimpactondistributions,whilethecontributionof oth-erswasmuchmorelimited.
Inthispaper,wetrytogodeeperinthestudyoftraces.Hence, the work presented hereconsiders all the steps in the life cycle oftraces,fromthe real-lifedata collectionto thestatistical anal-ysis.The variousfilterswhichcanbe appliedinbetweenarealso discussed. The analysisof fourexisting datasets and their use in variousresearchworksprovideduswithseveralrecommendations forfuturetrace-basedstudies.
Theremainderofthepaperisorganizedasfollows.InSection2, we presentthe traces andidentify usecases for whichthey can be exploited. Sections 3–5 then provide a detailed inventory of allfactorswhichcouldinfluencesubsequentresults,when respec-tively collecting,filtering orscaling thetrace. This inturnallows
Section6toproposealistofparameterswhichneedtobe consid-eredwhenworkingwithacontacttrace,andprovidesomeadvice. Finally,Section7concludesthepaper.
2. Background
Inthissection, we presentthe contactdatasetswhich willbe covered by our study. We also identifythree main usecases for contactdatasets,basedontheexistingliterature.
Table 1
Main characteristics of the datasets.
Rollernet MIT Infocom ’05 Humanet Technology Bluetooth Bluetooth Bluetooth Bluetooth
Year 2006 2004 2005 2010
Device iMote phone iMote custom Environment urban campus conference office Duration (days) 0.125 284 3 1
Time span NA 24/7 24/7 workday
Sampling period (s) 15 300 120 5
Internal nodes 62 89 41 56
Internal contacts 60,146 114,046 22,459 64,445 External contacts 72,365 171,466 5,757 64,531
2.1.Existingdatasetschosen
Wehaveselectedfourdatasetstoillustrateourstudy.Threeof themwerealreadyusedin[2]andinseveralpreviousworks,while the fourth one represents a more recent experiment for which theauthorsmadeacarefulstudybefore choosingparameters.All arepublicly available through the CRAWDADarchive website.An overviewoftheircharacteristicsispresentedinTable1.
The firstdatasetisRollernet [3],whichwascollected duringa 3-hlongrollerskating tourinParisin2006. 62Bluetoothcontact loggers(iMotes)weredistributedtovolunteersandstaff members among approximately 2,500 participants. The second one comes fromtheInfocom2005experiment[22],whichalsoreliedon sim-ilarcontactloggers. Theywere distributed among41participants ofthestudentworkshopoftheconference,whoalsoattendedthe restoftheconferenceafterwardsforatotaldurationofthreedays. Thethird dataset,MITRealityMining [10], wascollected through the use of an activity logging application embedded in mobile phones.Thesewerelentto100MITstudentsoverthecourseofthe 2004-2005academic year,representingalmost 9 monthsof data. Forthis third dataset, we only considered the Bluetooth contact tracesinour study(thus ignoring all informationon thecellular network), andrestricted the data to the 89 deviceswhich effec-tivelyrecordedcontacts.
Finally,the Humanetdataset[4]wasalsoproducedusing cus-tomhardwareandBluetooth.Itrecordedcontactsbetween56 peo-pleinanofficeenvironmentduringworkdays(no nightsor week-ends) for6 weeks in 2010. However at the time of thiswriting, only1dayhasbeenpublishedsofar.Weonlyconsideredcontacts recordedbetween users when the devices were worn, thanks to theuseofthemobilityflagrecordedinthetrace.
As can beseen fromTable1,thefour tracesselectedhere of-feratruediversityintermsofsamplingperiods,collectiondates, tracelengthsandcapturedenvironments.Althoughthereare sev-eral other datasets available, the goal of the present work is to studytheassumptionsandnotthedatasets,whichiswhywe de-cidetorestrictourselvestofourofthem.
Some studies of Delay Tolerant Networks also used WLAN traces,suchastheDartmouthdataset[15].Inthispaper,wedecide to focus on Bluetooth traces; however, most of the issues high-lightedherealsoapplytoWLANtraces.
2.2.Typicalusecasesfortraces
Wealreadymentionedthatrealtracesareastraightforward so-lutionforDelayTolerantNetworkresearcherswillingtoaddsome realismtotheir studies.Moreprecisely,therearethreemajor use cases for traces which can be identified from the literature: so-cialandmobilityinference,performanceassessmentandstatistical analysis.
Socialandmobilityinference. Forthistask,tracesaretypically pro-cessed in order to obtain social graphs, or atleast links of vari-ousstrengths(numberofcontacts,totaldurationofcontacts,time oflastcontact,etc.)dependingontherelationshipbetweenusers. Thisinturncanallowtoidentifycommunities,ormoresimplyto takeroutingdecisionsforprotocolsbasedonsocialproximity.
Performance assessment. It is rather commonplace for a paper proposing anewrouting protocolto demonstrateits applicability onbothsyntheticandrealtraces.Inthiscase,realtracesareused to overcomethe potential lackofrealism ofthe mobilitymodels behindthesynthetictraces.Itwashowevershownin[21]that be-causecontacttracesdonotrecordactualavailablebandwidthand buffer occupancy, they can lead to overlyoptimistic performance results.
Statistical analysis. Thiswasthemain topicof[2],andis consid-eredasa usual processingto gobeyondtherawtrace,for exam-plebycapturingtheoverallcontacttimesdistributionornode de-greeinsteadofindividualvalues.Thisisalsotheapproachusedby
[7,24]inordertoextendatraceintimespanand/orinnumberof nodes,asdetailedinSection5.
3. Collectingthetrace
Inthissection,weprovidealistofparameterswhichhavetobe setatthetime ofrecording.Thislistwillbe usefultoboth prac-titionerswillingtocollectnewtracesandresearchersplanningto exploitexistingdatasets.
3.1. Communicationhardwarechoice
Tracessuch as Humanet,Rollernet or those ofthe Haggle ex-perimentshavebeenproducedwithcustom-madedevicessuchas iMotes. Thechoice ofcustom deviceswasmadeby the Humanet researcherstobeabletotweakBluetoothparameters whichwere notadjustableonsmartphones[5].Forrealapplications,whichare highlylikelytobedeployedonoff-the-shelfdevices,theadditional constraintsof suchdevices wouldneedto betaken intoaccount. Constraints can come fromthe underlying operating system, the deviceusage patterns[23],oreven,asmentionedbefore,thelack ofcontroloversomeparameters.TheMITdataset[10]forexample wasproducedusinganapponsmartphones,whichwerealsoused by participantsona dailybasis tomake phonecallsorsend text messages.Thesameyear,researchersattheUniversity ofToronto
[23] alsomadea studyon studentsequippedwith PDAsrunning customsoftware.Inthesecases,exhaustingthebatteryisnotonly harmfultotheexperimentitself,butalsototheoverallexperience for theuser. Note that this consideration would alsobe truefor realapplications.Oneparameterwhichcanbeadjustedinthiscase isthefrequencytolookforotherdevices,discussednext.
3.2. Samplingperiod
Thetracesconsidered inthispaperhaveallbeenproduced by probing at regular intervals for potential contacts. The choice of this frequency (called sampling period or sometimes granularity inthe literature)can bedetermined by severalfactors.First, itis desirable to leave enough time forthe other devices to respond to theprobe.For thisreason, theauthors of[5]chose avalue of 5s afteracarefulstudyofresponse timeforseveralsmartphone models.Otherlimitationscomefromtheportablenatureofthe de-vicesused:abigsamplingperiodhastheadvantageofsaving en-ergy(aconcernalreadyexpressedintheprevioussubsection)and also memory [10].Theoretical methods for choosing the optimal frequencycanalsobefoundin[18]and[20].
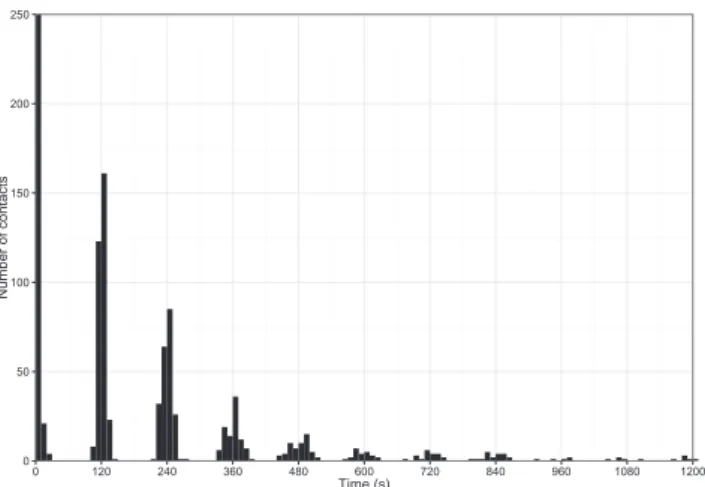
0 50 100 150 200 250 0 120 240 360 480 600 720 840 960 1080 1200 Time (s) Number of contacts
Fig. 1. Histogram of the contact times for the keynote in the Infocom 2005 dataset. The sampling period of 120 s is clearly visible between peaks. The peak at 0 s con- tains in fact 1575 contacts.
However, the choice of a big sampling period means that shortercontactsremainunseen,whichmayunderestimatecontact opportunities.Toaddressthisissue,theauthorsof[29]introducea methodtoinferaplausiblemobilityfromthecontacttraces,which can then be usedto generate other traces witha higher tempo-ralresolution.Thisapproachwaslatercriticizedin[16],duetothe highnumberofparameterswhichhavetobesettoproperly cap-turethe intrinsicmobility.Wecan alsomentionanothersolution of adaptivesamplingalgorithms, whichvary thesamplingperiod dependingontheobservedcontactsornumberofneighbors.Two examplesare[11]and[28].
As an illustration, a close-up view of the distribution of con-tacttimesforthekeynotecontainedintheInfocom2005dataset is provided in Fig. 1. According to the conference program, this keynotelastedfor2.5honthefirstmorningoftheconference.For clarity, we reducedtherange ofthexaxis from5000 to1200s, andoftheyaxisfrom1600to250contacts.Eachbarhasawidth of10s.Thisplotonlyconsiderscontacttimesforthekeynote,but we also obtainedsimilar shapesfor other periods ofthisdataset (panels, sessions...).Byusinga histogramandlinearscaleinstead ofthe much morecommonComplementaryCumulative Distribu-tionFunctionlog-logplots,thesamplingperiodbecomesmore vis-ible: the time interval between each peak is 120 s, which cor-responds to the sampling period advertised forthis dataset. No-ticethatthesepeakswouldtranslateintostepsona Complemen-tary Cumulative Distribution Function log-log plot. The fact that there are also other contacts whose durations are concentrated around thesepeakscomesfromthedesynchronizationprocedure, discussedinthenextsubsection.Itshouldbenotedherethatthe peak locatedat0scontainsinfact1575 contacts(instead of250 asthescalechoicemightsuggest).
3.3. Timesynchronization
Witha distributeddatacollection,itis crucialtohavea com-mon time referenceto correctlydetect encounters.Unfortunately, the intermittent connectivity which characterizes Delay Tolerant Networks makes thischallenging. Interestingly, perfect time syn-chronization may be undesirable during data collection, as two Bluetoothdevicesscanningatthesametimecannotdiscovereach other.Forthisreason, theauthorsof[22] and[3]used arandom dephasingbetweendeviceclocks,respectivelyof± 12sand± 5s. TheauthorsoftheHumanetdataset[4]usedanightly synchro-nization: each night, when the collection device was left at the office for charging and data uploading, it received a new
times-tampfromthecentralserver[5].Duringtheday,perfect synchro-nizationofscanningwasavoidedby usingarandomslave period (3+rand
(
1.5)
s). On the contrary, authors of [22] and [3] per-formeda manual synchronizationafter theexperiment, aprocess whichispronetoerrors:forexamplein[22],accuracybelow5mn isnotguaranteed.3.4.Storageformat
At the endof the experiment, data fromall participating de-vicesisgatheredandmerged.Then,theresultingfilescanbeused forevaluationand/or sharedwiththecommunity.Aswasalready noticedin[17],thereisnocommonformatforallthetraces.Some are available as text files [3,22], others as SQL database dumps
[4,10].
The type of data stored also differs: if it is always feasible to find the identity of the two nodes involved, along with the startandendtimesofthecontacts,contactandintercontacttimes sometimeshavetobecomputed.Format oftimesalsovary, rang-ing fromUnixtimestamps[10] toseconds fromthebeginning of theexperiment[22].Consequently,aresearcherwillingtouse sev-eraltraceswouldfirsthavetodecide foracommonformat,then dosomescriptingtogetallthetracesinthiscommonformat.
Foraccesspoint recordssuchas[15](which werenot usedin thissurvey),the tracedoesnot directlycontaincontactsbetween nodes,butonlyconnectionstoaccesspoints;hence,acommon as-sumptionis to consider two nodes as in contact when they are both simultaneouslyconnected to thesame accesspoint (see for example[9]or[25]).
4. Filteringthetrace
Inthissection,wenowplaceourselvesfromthepointofview ofaresearcherwhowouldliketouserealtracesforhiswork,such asdatasetsavailable at CRAWDAD.Althoughit seems straightfor-wardto usetherawdata directly,thereare infact severalfilters whichcanbeapplied.Noticethatthissectioncanalsobevaluable forusersofsynthetictraces,becauseitlistsseveralparametersof interestforsimulations.
4.1. Definingintercontacttimes
Afirstfactorwhichneedstobeaccountedforisthedefinition ofan IntercontactTime, aswe already pointedout in [2]: while mostoftheliteratureconsidersittobethedurationbetweenthe endofacontactandthebeginningofthefollowingone,some pa-perssuchas[24] considerthetimedifferencebetweenthe begin-ningoftwoconsecutivecontacts.Becausethislatterdefinition ag-gregatesboth thecontacttime andthe“usual” intercontacttime, webelieveittobeareasonablechoicewhencontactsare consid-eredinstantaneous,asisoftenthecaseintheoreticalperformance models.Due tothese twodefinitions, specialcare mustbe taken whenintercontact timeshaveto be computedfromcontactstart andendtimes,like wementioned in theprevious subsection; to thebestofourknowledge,precomputedintercontacttimes avail-ableinsomedatasetsalreadyfollowtheusualdefinition.
4.2.Symmetrizingcontacts
Bluetooth uses an asymmetric discovery procedure, which means that a recorded contact betweennode i and node j does notnecessarilymeanthatjandicouldalsocommunicate;infact, the authors of [30] claim that this is rather uncommon. How-ever, some works choose to assume symmetry [26]. For social analysis, symmetryis likelyto be desirable(if userAmeets user
0 10 20 30 40 50 60 10 20 30 40 50 60 Node id Degree Without symmetry With symmetry
Fig. 2. Influence of the symmetry on the degree computation for the 62 internal nodes of the Rollernet dataset. In this example, forgetting the symmetry underesti- mates the degree, especially for the nodes having the biggest indexes.
B, then B also meets A). However, issues can appear with sym-metric contacts when computing node degrees. In this case, re-searchersshould notforget that a contactbetweennodesi andj
meansthatj contributestothedegreeofi,justasmuchasi con-tributesto thedegree of j. Weshow the differencesforthe case oftheinternal nodesofthe Rollernetdataset inFig.2.Here, for-gettingthat the raw dataset assumes symmetry leadsto an un-derestimation of the computed degrees, especially forthe nodes withthe biggest indexes. Consider for example node 58 (out of 62), which degree jumps from 4 to 61 when symmetry is cor-rectlytakenintoaccount.Thisleadstheauthorsof[27]toconclude that node degrees exhibit a linear distribution, while the results presented here in Fig. 2 with symmetry clearly contradict these findings.
On the contrary, symmetry should preferably be avoided for networkperformance assessment,unlessofcoursetheconnection iseffectivelysymmetric.
4.3.Mergingcontacts
Incontacttraces,acontactbetweennodesiandj lastsaslong asprobesfromigetananswerfromj.However,theauthorsof sev-eraldatasetsobservedalargenumberofcontactswhichwereonly separatedby oneprobe,andconsequentlydecided inthiscaseto mergesuch contacts.FortheInfocom2005dataset,thischoice is madetoaddressamemoryexhaustionproblemcausedbycontacts withaspecificbrandofmobilephones[12].
However,thisstrategycanmergetwodistantcontacts,thus cre-atingan artificiallylongcontactwhichmaynotcorrespondtothe reality.Althoughthismaybedesirablewheninferringmobilityor social relationshipsfromthe trace, it wouldlead to overestimat-ingthetransferabilitiesofthenetwork,thusbiasingperformance evaluations.
To illustrate this behavior, we applied such a filter to a syn-thetictrace. The trace was generatedwith 41 nodeson a 100 × 100 m2 area, moving according to the Random Waypoint model
(constantspeedof1m/s,nopauses)during2.5h,thefirstone be-ingdiscardedtoallowconvergenceofthemodel.Noderangewas 10m.Theoriginalsamplingperiodwas1s,asmallvalueachieved thanks to the use of a simulator (namely, the ONE [13]) which wouldnotbepossibleinreality.Thefinalsamplingperiodapplied bythefilterwas120s. Notethatthe choiceofparameters (node number,duration,samplingperiod)wasdirectlyinspiredfrom pa-persessionsintheInfocom2005dataset.
The results are presented in Fig. 3. In the original trace (Fig. 3(a)), the longest contactrecorded hada duration of219 s.
0 2000 4000 6000 0 100 200 300 Time (s) Number of contacts
(a) Original trace
0 500 1000 0 100 200 300 Time (s) Number of contacts (b) Filtered trace
Fig. 3. Distribution of the contact durations in the original and synthetic traces. Note the appearance of longer contacts after the filtering.
On the final trace however (Fig. 3(b)), we notice the appearance of 28 contacts with a duration of 240 s, which did not exist in thefirsttrace, andevena 360-scontact.Whenevaluating perfor-mance,suchlongcontactswouldbeseenashighlyinterestingdata transfer opportunities, despite beingonly artifacts ofthe contact mergingprocess.
One may however object that the previous study was done with a synthetic dataset instead of a real one. In fact, a similar study was also conducted in [6] for the Humanet dataset. Orig-inally produced with a samplingperiod of 5 s, the authors pro-cessed the trace to virtually achieve sampling periods of 120 s as in [22] or 300 s as in [10]. Similarly to the present work, increasing the sampling period produced longer observed con-tacts, and dramatically reduced the total number of contacts recorded.
Likethepreviousfilter,thisone issometimesalreadyincluded inthetracesavailableonrepositories:thisisthecaseforexample for Rollernet (symmetry, contactmerging) [3]and Infocom 2005 (contactmerging) [22].This canbe problematicbecausefor such datasets, thereis nostraightforward wayofassessing the impact of these choices due to the unavailability of the raw, unfiltered data;worse, usersofsuch tracesmaynot evenrealizethe impli-cationsofthisfiltering.Onthecontrary,themorerecentHumanet dataset[4]doesnotincludeanyfilterinthereleasedversion;some arehoweverexplicitlyappliedbytheauthorsfortheirsubsequent studies[6].
4.4. Losingorremovingextremevalues
The rangeof valuesrecorded incontactdatasets can be quite broad,withintercontactsrangingforinstancefromafewseconds toa fewdaysintheInfocom2005dataset.Hence,one maywant toremovevalueswhichareoutsideacertainrange.Someofthem canindeedbe seenasakindofartifact ofthecollectionprocess: in thecaseofthe Infocom 2005dataset, thelongest intercontact timeslast foralmost threedays,which happensto be thelength of the whole experiment. They could thereforebe interpreted as pairs ofnodes which saw each other only at the beginning and attheendoftheexperiment,thusindicatingthatthe correspond-ing people wouldhave been unlikely to meet at all without the experiment. Itshouldalsobenotedthatthedisappearanceofthe longestvaluescanbe asideeffectofrestrictingthelengthofthe trace: it is impossible to record durations longer than the trace length.
However,extremevaluescanalsobethesmallestones.Among these, one value is especially interesting: contacts with a dura-tionof0second.TheyrepresentalargepartoftherawBluetooth traces studied here (75%of Rollernet, 52% of Infocom 2005, 43% oftheMITdatasetand55%oftheHumanet dataset).Itshouldbe noted that these contacts did not really last for 0 s during the trace collection; instead,they were simplyshorterthan the sam-pling period and were only detected for one probe. This can be seen for exampleon Fig. 3 in Section 4.3, where the application of thesampling algorithmled to a majorityof recordedcontacts withadurationof0swhiletheoriginaltracedidnotcontainany (minimum duration was1 s).Recall alsothe highestpeak at0 s inFig.1.Yet,somepaperssuch as[24] appearto discardall con-tactsshorterthanthesamplingperiod(includingthe0-scontacts), thusremoving asubstantialpartofthedata.Onthecontrary,the authorsof[26]choosetoincludethese0-scontactsintheir analy-sisbyextendingthemtoanarbitraryvalueof1s.Thisextension, despitebeingfarfromreality,ishowevernecessaryforsome sta-tisticaltoolsduetothepresenceoflogarithmsintheformulas[2]. The questionthat israisedby thesechoicesisabouttheir im-pactontheintercontacttimes:ifsome contactsaredeleted,then the surroundingintercontacts shouldbe merged becausethey no longerseparateanything.Thiswouldleadtooverestimatingthe in-tercontactlength.
4.5. Restrictingcontactstodevicemobility
Referred to asthe “human mask” in [6],this filteris used to discard contactswhichhappened whilethe devicewasnot worn by the user(e.g., it wasidle on the desk). Ifthe use of this fil-ter is desirable for inferring mobility from the contact traces, it shouldbe avoidedwhenevaluatingnetworkperformance,sinceit may discard useful connections. Furthermore, applying this filter requiresawaytotellwhenthedeviceiswornandwhenitisnot: inthecaseoftheHumanetdataset[4],thiswasachievedthrough thecollectionofaccelerometerdata,aparameterwhichis unfortu-natelynotpresentinalltraces.FortheMITdataset[10],forwhich no accelerometer data was available, the authors tried to imple-mentaso-called’forgottenphone’classifiertoidentifytimeswhen thephonewasnotwiththeuser.
4.6. Filteringdevices
Traces may not only record contacts between devices partici-pating in the experiment (“internal” nodes), but also with other deviceswhichwereobserveddespitenotcollectinganydata (“ex-ternal” nodes).
Theissuewiththeexternalnodesisthattheycanbedetected, butnotdetectothers.Inotherwords,andunlesssymmetryof
con-tactsisassumed,theywillbeabletoreceivedata,butnottosend it. Consequently, and for simplicity, contacts with theseexternal nodesaresometimessimplydiscardedfromthetrace.Thestudyof aggregateddistributions of ContactTimes andIntercontact Times ledtheauthorsof[12]andlaterof[2]totheconclusionthatboth categoriesofnodesexhibitedsimilarbehaviors.
Evenwhenthenodesarerestrictedtothe“internal” ones, fur-therfilteringmaybeneeded. Some datasets([4]andmostofthe traces in [22]) involve fixed nodes, typically placed by the re-searchersinstrategiczoneswherepeoplearehighlylikelytomeet. Unliketheothers,thesenodesarenottiedtoaperson.Whilethese nodesareespeciallyinterestingforlocationinference,theyarealso knowntodramaticallyimprovetheperformanceofDelayTolerant Networks[1];hence,theyshouldbeeitherproperlyacknowledged ordiscardedwhenevaluatingnetworkperformanceonsuchtraces. Forstatisticalinferenceormobilitymodeling,webelievethatboth external andfixed nodes should also be discarded, because they willtypicallyexhibitdifferentconnectionpatterns.
4.7.Pairdiscarding
Toensurestatisticalvalidity ofthe distributionfittingprocess, which will be discussed in more details in Section 5, we need tohave aminimum numberofsamples foreach pair.Thislower bound can also be interesting when building social graphs, asa waytoremovethelessactivepairsfromtheanalysiswhichwould translate into low-weighted edges and unnecessarily clutter the graph.The authorsof[9]useathresholdof4contacts,whilethe valuechosenin[26]is9contacts.Itshouldbenotedherethatthe assumption of symmetry mentioned earlierwill also impact the numberof pairs which wouldbe discarded. Indeed, merging the contactsfromnodeitonodejwiththosefromjtoiintoasingle pairwill logicallyincrease the total numberofcontacts recorded forthispair, eventually going over the threshold.Hence, the use ofthesymmetry filtershouldbe properlyacknowledgedforsuch uses,aswasdonein[9,26].
The major issue of this filter is the fact that some pairs will beremovedfromtheanalysis, asifthey didnotexist.Thisis es-pecially problematicforstatisticalanalysis, becauseit meansthat suchpairsbeingmissingasinputswilltypicallybealsomissingin thedatageneratedfromthisanalysis.Onepossiblesolutioncould betoaggregatethedatafromallsuchpairs,andtreatthemasone bigvirtualpair,attheexpenseofironingoutanydifferencesthat mayexistbetweentheoriginalpairs.
5. Scalingthetrace
Once the trace has been adequately filtered,this may not be sufficientfor theenvisioned purposes.Indeed, datasets may con-tain time periods whichexhibit differentproperties: some nodes maynotbe functioningproperly[10],orthe experimental condi-tionsweredifferent(suchasabreakduringarollerskatingtour[3], holidays between school terms [10], or nights [22]). Sometimes, the datasetis simply too long for theenvisioned experiment, so that only a subset of it suffices. This subset should however be chosen carefully:itwouldbe unfortunateto tryto studythe dy-namics of users ina session of the Infocom 2005 conference by takinga1.5-h1longsampleinthemiddleofthenight,orstudying
theon-campusinteractionsofMITstudentsoveraholidayweek. Butthe opposite can also happen:the trace can be too short in time or not contain enough nodes. Due to the inherent dif-ficultiesof setting up trace collections, andthe resulting limited numberofexistingdatasets,suchlimitationsarecommonplace.To
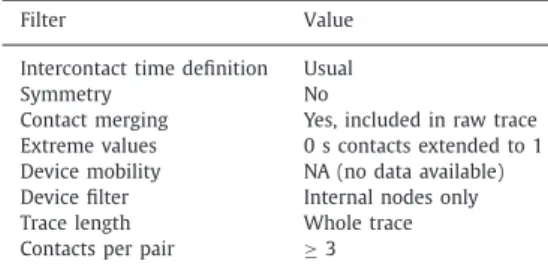
Table 2
Filter settings for the fitting study.
Filter Value
Intercontact time definition Usual
Symmetry No
Contact merging Yes, included in raw trace Extreme values 0 s contacts extended to 1 Device mobility NA (no data available) Device filter Internal nodes only Trace length Whole trace Contacts per pair ≥ 3
addresstheseshortcomings,two solutionshavebeenproposed in theliterature,namelytheCommunityTraceGenerator[7]andthe Encounter-basedMOdel[24].
5.1.Existingscalingapproaches
These two proposals share a common approach: extracting characteristics fromthe trace asstatistical distributions (and not asrawdata),whichare subsequentlyusedforthegenerationofa newtraceexhibiting thesame statisticalproperties.CTG[7] cap-tures the number of nodesalong with the distributions of node degree, aggregated Contact Times and Intercontact Times. EMO
[24] alsocaptures thenumber ofnodes anddistribution ofnode degree, butcontact andintercontact times are treated in a pair-wisemanner. Moreprecisely, the pairwise empiricaldistributions arefirstfittedtoaprobability distribution(which needstobe the sameacross all pairs), then the empirical distribution of the pa-rametersofthesedistributions isfittedtoanotherprobability dis-tribution. For example, the pairwise contacts of the MIT dataset
[10]arefoundtobeexponentiallydistributed,withparameters of theexponentiallawfollowinganormaldistribution[24].
At this point,we would like tomention againthe aggregated contacttimedistributionshowninFig.1.Becauseofthesampling process,contactdurationsaredistributedclosetothesampling pe-riods,leadingtoties(several sampleswiththe samevalues) and anintermittentshape,withlongrunsoftimevaluesforwhichno contactisrecorded.This isinsharpcontrastwiththecontinuous charactertypicallydisplayedbyusualstatisticaldistributions.
5.2.Statisticalfittingissues
A first problem comes from the distribution fitting process used,which strives to usethe same statisticaldistribution to fit the (inter-)contacts of all the pairs. In [9] and later in [26], it wasshownforfourdifferenttraces(Infocom2005,Rollernet,MIT andDartmouth) that the Intercontact Times of some pairs could bemodeled equally well by severaldistributions, while forsome other pairs none of the three distributions considered (namely Pareto,exponential andlog-normal)gavea satisfactory result. In-terestingly,thedistributionwhichwasabletorepresentthelargest numberofpairs was forthe fourtraces thelog-normal distribu-tion,despitethevarietyofenvironmentscaptured.
We appliedthisstatisticalfittingapproach(onedistributionto modelallthe pairs)tothepairwise IntercontactTimesofthe In-focom2005dataset[22].Weprovidethelistofparametersforthe filtersintroducedintheprevioussectioninTable2.
No extreme values are discarded. As shown in Table 2, 0-s contactsare howeverextended to 1s, so no intercontact hasto be modified. We used the same statistical fitting procedure as in [2] (Maximum Likelihood estimation for the parameters, and Kolmogorov–Smirnov test to determine the best candidate). The choiceof distributions to test is alsothe same: exponential, log-normal or Pareto with xmin=1. We found out as in [9,26] that
Fig. 4. Sums of pairwise intercontact times, for both the original dataset and the synthetic one obtained through statistical analysis. Each dot represents a pair. Some pairs exhibit much longer durations in the synthetic trace than in the original one, and the four-group structure disappears. Notice the scale change between the two graphs.
the statistical distribution able to represent the largest number ofpairswaslog-normal.Then,we usedtheestimatedparameters foundforeachpairtogeneratethesamenumberofsynthetic In-tercontactTimesforeachpairasintheoriginal trace.Theresults in terms of total Intercontact Times can be found on Fig. 4. On theseplots,eachdotrepresentsanodepair.Whencomparingthe original trace with the generated one, we notice that the totals forsome ofthepairs aremuch higherastheoriginal ones(even exceeding theinitial trace length),implying thatlonger intercon-tacts havebeen generated.Furthermore,the dots forthe original trace are grouped into four regions. Closer inspection of the in-tercontacttimesforeachpairrevealsthat thisstructureiscaused bya fewverylongintercontacts(having durationsofatleastone night).Theselong(butrare)intercontacts,whichcouldbeseenas extremevalues,arelostafterthefittingprocess.
Eventhefittingprocessitselfcanhidemanydetails.Afirst ex-ample is the Pareto law. In [19], the authors mention two defi-nitionsforit,which theyname“Pareto0” and“Pareto” depending ontheir ability toaccept valuesarbitrarily closeto0.When only the Pareto law is used, it is also possible to find several defini-tions fortheexponent.Anotherissuewithpowerlawsisthefact thatthey havealowerbound,usually writtenxmin.In[2],we
al-ready mentionedthat thereare two possibilitiesto estimate this lowerbound:arbitrarily settingittoavaluesuchasthesampling
period [24], or using a mathematical estimator such as the one proposedin[8].Inbothcases,databelowthelowerboundwillbe discarded,asifthefilterpresentedinSection4.4hadbeenapplied. This makes comparisonbetween distributions somewhat trickier, becauseotherstatisticaldistributions(like,forexample,the expo-nentialone)donothaveanylowerboundintheirusualdefinition, andwill therefore tryto fitall the data. Oncethe various distri-butionstotesthavebeenchosen,atool tohelpdecidewhichone bestmodelsexperimentaldataisneeded.Aswementionedin[2], thereareseveralpossibilities.Thesimplestistoplotthedatawith anadequatescaleandperformagraphicalfitting,asin[12].Other authors used statistical tools, such as the Kolmogorov–Smirnov test[24]ortheCramer-vonMisestest[9,26].Indeed,accordingto the authorsof [8], statisticaltestsshould always be favored over graphicalfittingbecausethelatterapproachistooerror-prone.
5.3. Validationissues
Thesestatisticalfittingapproacheshaveanotherdrawback:they are validated by showing their ability to reproduce aggregated distributions ofcontactand intercontacttimes.The major advan-tageofaggregateddistributionsovertheirpairwisecounterpartsis that they are much morecompact (only one distribution to con-sider)[9],whichmadethemacommonapproachintheliterature for validation.However, the authors of [14]claim that validation should be made on parameters which are not used as inputsof thealgorithm: theyvalidate theirmobilitymodel(whichisbased on hotspots, speed distribution of users and transitions between hotspots)byitsabilitytocorrectlyestimatethenumberofpeople atahotspotacrosstheworkday.
Furthermore,aggregateddistributionsareknowntohidemany details. In[9],it wasfound thatboth exponentialandlog-normal pairwisedistributionscouldleadwhenaggregatedtotheobserved powerlaws.Theauthorsof[19]alsoshow thatseveralother pair-wise distributions can lead to power lawswhen aggregated, and provide a list ofcases when usingonly the aggregated distribu-tion is in fact not correct. Another issue was shown in [25]. In thiswork,theauthorsselectthreemobilitymodels,andtunetheir parameters toreproducetheempiricalaggregateddistributionsof ContactTimesandIntercontactTimesfoundinrealdatasets.When performingsimulationswithboththerealtracesandthesynthetic onesderivedfromthem,theyfindoutthatsynthetictracesalways provide much more optimistic performance results than the real ones.
6. Recommendations
In Section 3,we reviewedtheparameters to be considered at thetime ofdatacollection,whileSection 4providedan overview of the filters applied for trace exploitation. Then, Section 5 pre-sented two approaches to scale existing traces and their limita-tions.Basedonthesefindings,wecannowlistthevarious param-eterswhichhavetobeconsideredwhenusingatrace.
6.1. Production
First, the hardware and radio technology used for collection mustmatchtheoneswhichareenvisionedfortheapplication.The samplingperiodmustalsobechosencarefully,takingintoaccount bothwhatisplannedfortheapplicationandthelimitationsofthe radio technology, asdetailed in[5].More precisely, the sampling periodmust considerthetime tofind otherdevices,butalsothe acceptable impact interms ofenergyconsumption. However, en-ergyisnolongeramajorconcern:whiletheteambehindtheMIT dataset[10]triedin2004tomakecellphonesbatteriestolastfor more than 2days without charging, it isnow not uncommon to
charge a smartphone on a daily basis. Based on the conclusions from[6] and our complementary analysis on contact merging,a realistictraceshouldalsobeaspreciseaspossible,thusrequiring asmallsamplingperiod.Therefore,atrade-off betweenenergyand precisionisneeded.Webelievethattracecollectioneffortsshould focuson precision, attheexpense offrequent chargesof the ex-perimentaldevices;onthecontrary,realapplicationdeployments should aimfora pleasant userexperience, whichmeans limiting theirfootprintonenergyconsumption.
Issueson time synchronizationmust definitely be considered; basedon existing literature, we wouldrecommend random slave periods[5]insteadofclockdesynchronization,dueto thesmaller resultingerrors.
Ifthecollecteddataistobemadepublic,itisdesirableto per-form as little filtering as possible on the data, which will then allow other researchers to apply their own filters depending on their goal.Regarding thesefilters,their applicationshouldalways beproperly andpreciselydescribed, especiallywhen theyare in-corporatedinreleaseddata(ashasalreadybeenthecaseinsome datasetsforsymmetry,intercontactdefinitionorcontactmerging). Theaimhereistomakeresultseasiertoreproduceandcompare, aconcernwhichwastheoriginalmotivationfor[2].
6.2.Filtering
A summary of recommendations on the filters can be found in Table 3, for the three common uses of traces introduced in
Section2.2: socialstructures andmobilityinference,performance evaluation,andstatisticalanalysis.Thefiltersarepresentedinthe sameorderasthey wereintroduced intheprevious sections.For eachfilter,wedetailforeach usecaseifitcan,mustormustnot beapplied.Inthiscontext,canmeansthatwebelieveitispossible toapplythisfilter,providedthattheresearcheriswellawareofit andofitsconsequences.
Forexample,the length filtercan be used in all casesto iso-lateapartofthetraceexhibitingparticularproperties(workdays, coffeebreaks...).The sameobservationapplies tothe Intercontact Timedefinition: using the alternative definitionis not wrongby itself, except when simultaneously considering non-zero contact times.Regardingsymmetry,we alsobelievethat itcanbe applied iftheconnectionwasreallysymmetric,butmustbeavoided oth-erwise.
Forthe otherfilters,thesituationisslightlydifferent.Merging contactsisrecommended forsocialandmobility inferenceifone doesnot want to minimize the linksbetween nodesin the net-work, as also found in [6]. On the contrary, overestimating data transferopportunities will bedetrimental to performance assess-mentandstatisticalanalysis.We recommendfiltering(or modify-ing)extremevalues only forstatistical analysis, atthe very least when a large percentage of 0-s contacts is present in the trace. Similarly,werecommendtheuseofthemobilityfilteronlyfor so-cial ormobilityinference, because it wouldunderestimate trans-fer opportunities inthe two other use cases considered. Regard-ingthechoiceofdevicestoconsider,astudyonsocialormobility inference should typicallyignore fixed orexternal nodes because theydonotrepresentsocialinteractions.Fixednodesmayhowever beusefulforlocalization.Forperformanceassessment,thechoice of nodes is left to the researcher, aslong as it is properly doc-umented. Forstatistical analysis, the choice ofnodes should also be carefullymadeinorderto avoidthecapture ofunwanted be-haviors.Onemayobjectthatconclusionsof[2,12]indicated simi-lartrendsamongbothinternalandexternalnodes;however,these conclusionsdidnot consider fixed nodes,and were drawn based onthestudyofaggregateddistributions insteadofpairwiseones. Finally, ensuring the validity of the statistical analysis requiresa
Table 3
Recommendations for the use of filters. + = MUST, - = MUST NOT, o = CAN.
Social/mobility inference Performance assessment Statistical analysis
Intercontact time definition o o o
Symmetry o o o
Contact merging + - -
Extreme values - - +
Device mobility + o o
Device filter + o +
Contacts per pair - - +
Trace length o o o
lowerboundonthenumberofcontactsforeachpair,acondition whichwebelieveislessnecessaryotherwise.
It should also be noted that there can be some interplay be-tweenthefilters:forexample,symmetrywillincreasethenumber ofcontactsforagivenpair,and, duetoitsimpactonIntercontact Times,also modify the range of values; choosing only a portion ofthedatasetwill causeall(inter-)contacts longerthan thisnew durationtodisappear;removing theshortestorlongestvalues di-rectlyinfluencesthenumberofvaluesofthenodepairinquestion, asdoesthe mobilityfilterorthe tracelength. Thislistisnot ex-haustive,and representsan even stronger motivation to properly documentthefiltersusedinastudy.
However,onemayarguethatifaresearcherhasenoughcontrol onthe experimentto correctly setall the parameters mentioned above,itmaybedesirabletoskipthetracecollectionpartand di-rectlyproceed to application deployment.But even inthis situa-tion,tracecollectioncanbeareasonablechoice,sincearecording ofall contacts will be available forsubsequent trials. Availability ofthisdatawouldincreasetherepeatabilityofthedeployment.It also allows to exploit the trace with various filter combinations, andthen possibly for multiple use cases. Forexample, it would bepossibletoincreasethesamplingperiodwithoutcompromising thevalidityofthecollecteddata.
Thisraisesthequestionofrepresentativityoftraces.More pre-cisely,realapplicationsareunlikely tobe limitedtosimply prob-ingtheirsurroundingforothernodes,whichiswhat trace collec-tioneffortshavebeendoingsofar;instead,theywillalsoinvolve datatransfer between devices(of images, newsitems, chunks of largefiles...).Assessingthedifferenceintermsofrecordedcontacts betweenboth approachesis outside the scope of this work, but wouldrepresentahighlyvaluableresultforthecommunity.Afirst step inthis direction hasbeen made in [21], where the authors recordedmessage exchangesinaddition to thecontacts between nodes.
6.3.Scaling
We mentioned that available traces do not always exactly matchthesituationsoneiswillingtostudy.InSection 5,we pre-sentedsomesolutionproposalstothisproblem.Wedonotseeany issueintakingonly a subset ofan existing dataset,provided the choiceoftime periodis carefullyconducted(i.e.,notmistaking a conferencesessionwithalunchorasocialevent)andprecisely de-scribed.Ifalreadypresentinthetrace, IntercontactTimesshould be recomputed to reflect the time span change. However, based onthevarious limitationspreviouslyoutlined, wewouldstrongly advise against upscaling (extending the number of nodes and/or thetimespan),unlessnewtoolsarecreatedtoaddresscurrent is-suesof the existing approaches.Based on thefindings expressed inSection 5,these newtoolsshould be ableto work atthe pair level(andnotonlywithaggregates[7]),andbeabletouseseveral statisticaldistributionstomodeltheminsteadofonlyone. Defini-tionsofthestatisticaltools(distributionsandgoodness-of-fittests)
shouldbeproperlyprovidedtoavoidanyambiguitieswhen build-ingupontheresults.Furthermore,thequalityofsuchtoolsshould not bejudgedon their abilitytoaccurately reproduceaggregated distributions[25],butratheronpairwisedistributionsornetwork performanceresults.
7. Conclusion
Contacttracescollectedduringfieldtrialsarethemost straight-forward way for researchers to introduce some realism in their work.Theyaremainly usedinthecontextofDelayTolerant Net-works for social inference, performance assessment or statistical analysis. In this work, we show that the conditions captured by traces can be quite far from reality, due to the high number of otherfactorswhichcaninfluencethecollectionprocess(sampling period,device characteristics...).We also listed filterswhich have been applied to traces in various research works, and proposed recommendationsontheirusedependingontheenvisioned exper-iments.Forallthefilters,researchersneedtobeawareoftheir ex-istence,especiallywhenthesearealreadyincorporatedinthefiles available in public repositories. Finally, two existing approaches aimingtoextenddatasetswhileretainingtheirintrinsic character-istics are presented. We found out that there are in fact several hiddenlimitations(suchasmodelingallnodepairswiththesame distribution, or validating withaggregated measurements) which maypreventthemtotrulyachievetheirgoal.
Becauseofthelargenumberoffactorswhichhavetobe consid-eredwhenusingrealtracesforperformanceassessment,wehave cometotheconclusionthatsynthetictracesshouldbeconsidered with moreattention. Unlikereal datasets, synthetic models have theadvantageofofferingfullcontrol overtheirparameters. How-ever, measuring their conformance to reality is still a challenge, considering that thisis oftendone by comparing them withreal traces.
Acknowledgments
Theauthorsare gratefultotheanonymousreviewersfor valu-ablecommentsthathelpedgreatlyimprovethepaper.Theywould also liketo thankVictor Ramiro forhis commentsand question-ings,andJeremieBigotforpointingoutsomeissuesofthescaling procedures.
References
[1] N. Banerjee, M.D. Corner, D. Towsley, B.N. Levine, Relays, base stations, and meshes: enhancing mobile networks with infrastructure, in: ACM MobiCom ’08, 2008, pp. 81–91, doi: 10.1145/1409944.1409955 .
[2] G. Baudic, T. Pérennou, E. Lochin, Revisiting pitfalls of DTN datasets statistical analysis, in: ACM CHANTS ’14, 2014, pp. 73–76, doi: 10.1145/2645672.2645683 . [3] F. Benbadis, J. Leguay, CRAWDAD dataset upmc/rollernet (v. 2009-02-02), 2009, (Downloaded from http://crawdad.org/upmc/rollernet/20090202 ). http: //dx.doi.org/10.15783/C7ZK53
[4] J.M. Cabero, V. Molina, I. Urteaga, F. Liberal, J.L. Martin, CRAWDAD dataset tec- nalia/humanet (v. 2012-06-12), 2012, (Downloaded from http://crawdad.org/ tecnalia/humanet/20120612 ). http://dx.doi.org/10.15783/C74G60
[5] J.M. Cabero, V. Molina, I. Urteaga, F. Liberal, J.L. Martin, Acquisition of human traces with Bluetooth technology: challenges and proposals, Ad Hoc Netw. 12 (2014) 2–16, doi: 10.1016/j.adhoc.2012.05.007 .
[6] J.M. Cabero, I. Urteaga, V. Molina, F. Liberal, J.L. Martin, Reliability of Bluetooth- based connectivity traces for the characterization of human interaction, Ad Hoc Netw. 24 (Part A) (2015) 135–146, doi: 10.1016/j.adhoc.2014.08.010 .
[7] R. Calegari , M. Musolesi , F. Raimondi , C. Mascolo , CTG: a connectivity trace generator for testing the performance of opportunistic mobile systems, ACM ESEC/FSE07, 2007 . Dubrovnik, Croatia.
[8] A. Clauset, C.R. Shalizi, M.E.J. Newman, Power-law distributions in empirical data, SIAM Rev. 51 (4) (2009) 661–703, doi: 10.1137/070710111 .
[9] V. Conan , J. Leguay , T. Friedman , Characterizing pairwise inter-contact patterns in delay tolerant networks, in: Autonomics ’07, 2007, pp. 19:1–19:9 . [10] N. Eagle, A.S. Pentland, CRAWDAD dataset mit/reality (v. 20 05-07-01), 20 05,
(Downloaded from http://crawdad.org/mit/reality/20050701 ). http://dx.doi.org/ 10.15783/C71S31
[11] A. Hess, E. Hyytia, J. Ott, Efficient neighbor discovery in mobile opportunistic networking using mobility awareness, in: Communication Systems and Net- works (COMSNETS), 2014 Sixth International Conference on, 2014, pp. 1–8, doi: 10.1109/COMSNETS.2014.6734890 .
[12] P. Hui , A. Chaintreau , J. Scott , R. Gass , J. Crowcroft , C. Diot , Pocket switched networks and human mobility in conference environments, in: ACM WDTN ’05, 2005, pp. 244–251 .
[13] A. Keränen, J. Ott, T. Kärkkäinen, The ONE simulator for DTN protocol evaluation, in: ICST Simutools ’09, 2009, pp. 55:1–55:10, doi: 10.4108/ICST. SIMUTOOLS2009.5674 .
[14] M. Kim, D. Kotz, S. Kim, Extracting a mobility model from real user traces, in: IEEE INFOCOM 2006, 2006, pp. 1–13, doi: 10.1109/INFOCOM.2006.173 . [15] D. Kotz, T. Henderson, I. Abyzov, J. Yeo, CRAWDAD dataset dartmouth/campus
(v. 20 09-09-09), 20 09, (Downloaded from http://crawdad.org/dartmouth/ campus/20090909 ). http://dx.doi.org/10.15783/C7F59T
[16] A.K. Monfared, M.H. Ammar, E.W. Zegura, Plausible mobility inference from wireless contacts using optimization, in: ACM CHANTS ’13, 2013, pp. 7–12, doi: 10.1145/2505494.2505501 .
[17] M. Musolesi , C. Mascolo , Mobility models for systems evaluation - a survey, Middleware for Network Eccentric and Mobile Applications, Springer-Verlag, 2008 .
[18] A. Nayebi, G. Karlsson, Beaconing in wireless mobile networks, in: IEEE WCNC 20 09, 20 09, pp. 1–6, doi: 10.1109/WCNC.2009.4917610 .
[19] A. Passarella, M. Conti, Analysis of individual pair and aggregate intercontact times in heterogeneous opportunistic networks, IEEE Trans. Mobile Comput. 12 (12) (2013) 2483–2495, doi: 10.1109/TMC.2012.213 .
[20] S. Qin, G. Feng, Y. Zhang, How the contact-probing mechanism affects the transmission capacity of delay-tolerant networks, IEEE Trans. Veh. Technol. 60 (4) (2011) 1825–1834, doi: 10.1109/TVT.2011.2131693 .
[21] N. Ristanovic , G. Theodorakopoulos , J.-Y. Le Boudec , Traps and pitfalls of us- ing contact traces in performance studies of opportunistic networks, in: IEEE INFOCOM 2012, 2012, pp. 1377–1385 .
[22] J. Scott, R. Gass, J. Crowcroft, P. Hui, C. Diot, A. Chaintreau, CRAWDAD dataset cambridge/haggle (v. 20 09-05-29), 20 09, (Downloaded from http://crawdad. org/cambridge/haggle/20090529 ). http://dx.doi.org/10.15783/C70011 [23] J. Su, A. Chin, A. Popivanova, A. Goel, E. de Lara, User mobility for opportunistic
ad-hoc networking, in: IEEE WMCSA 20 04, 20 04, pp. 41–50, doi: 10.1109/MCSA. 2004.29 .
[24] F. Tan, Y. Borghol, S. Ardon, EMO: A statistical encounter-based mobility model for simulating delay tolerant networks, in: IEEE WoWMoM 2008, 2008, pp. 1– 8, doi: 10.1109/WOWMOM.2008.4594 84 8 .
[25] G. Thakur, U. Kumar, A. Helmy, W.-j. Hsu, On the efficacy of mobility mod- eling for DTN evaluation: analysis of encounter statistics and spatio-temporal preferences, in: Wireless Communications and Mobile Computing Conference (IWCMC), 2011 7th International, 2011, pp. 510–515, doi: 10.1109/IWCMC.2011. 5982586 .
[26] P. Tournoux , J. Leguay , F. Benbadis , V. Conan , M. Dias de Amorim , J. Whit- beck , The accordion phenomenon: analysis, characterization, and impact on DTN routing, in: IEEE INFOCOM 2009, 2009, pp. 1116–1124 .
[27] P. Vieira, A. Costa, J. Macedo, A Comparison of opportunistic connection datasets, in: 2012 Third International Conference on Emerging Intelligent Data and Web Technologies (EIDWT), 2012, pp. 66–73, doi: 10.1109/EIDWT.2012.52 . [28] W. Wang, V. Srinivasan, M. Motani, Adaptive contact probing mechanisms for
delay tolerant applications, in: Proceedings of the 13th Annual ACM Interna- tional Conference on Mobile Computing and Networking, in: MobiCom ’07, ACM, New York, NY, USA, 2007, pp. 230–241, doi: 10.1145/1287853.1287882 . [29] J. Whitbeck, M.D. de Amorim, V. Conan, M. Ammar, E. Zegura, From encounters
to plausible mobility, Pervasive Mobile Comput. 7 (2) (2011) 206–222, doi: 10. 1016/j.pmcj.2010.11.001 .
[30] E. Yoneki, The importance of data collection for modelling contact networks, in: Computational Science and Engineering, 2009. CSE ’09. International Con- ference on, vol. 4, 2009, pp. 940–943, doi: 10.1109/CSE.2009.332 .