O
pen
A
rchive
T
OULOUSE
A
rchive
O
uverte (
OATAO
)
OATAO is an open access repository that collects the work of Toulouse researchers and
makes it freely available over the web where possible.
This is an author-deposited version published in :
http://oatao.univ-toulouse.fr/
Eprints ID : 17605
To link to this article : DOI:
10.1016/j.bbadis.2017.02.025
URL :
http://dx.doi.org/10.1016/j.bbadis.2017.02.025
To cite this version :
Samouillan, Valérie and Revuelta-López,
Elena and Soler-Botija, C. and Dandurand, Jany and
Benitez-Amaro, Aleyda and Nasarre, Laura and de Gonzalo-Calvo, D and
Bayes-Genis, A and Lacabanne, Colette and Llorente-Cortés,
Vicenta Conformational and thermal characterization of left
ventricle remodeling post-myocardial infarction. (2017) Biochimica
et Biophysica Acta (BBA) - Molecular Basis of Disease, vol. 1863
(n° 6). pp. 1500-1509. ISSN 0925-4439
Any correspondence concerning this service should be sent to the repository
administrator:
[email protected]
Conformational and thermal characterization of left ventricle remodeling
post-myocardial infarction
V. Samouillan
a,⁎
, E. Revuelta-López
b,c, C. Soler-Botija
c,d, J. Dandurand
a, Aleyda Benitez-Amaro
b, L. Nasarre
b,
D. de Gonzalo-Calvo
b,d, A. Bayes-Genis
c,d,e,f, C. Lacabanne
a, V. Llorente-Cortés
b,d,g,⁎⁎
aPhysique des Polymères, Institut Carnot, CIRIMAT UMR 5085, Université Paul Sabatier, Bat 3R1B2, 118 route de Narbonne, 31062 Toulouse Cedex 04, France bCardiovascular Research Center, CSIC-ICCC, IIB-Sant Pau, Hospital de la Santa Creu i Sant Pau, 08025 Barcelona, Spain
cICREC (Heart Failure and Cardiac Regeneration) Research Program, Health Sciences Research Institute Germans Trias i Pujol, 08916 Badalona, Barcelona, Spain dCIBERCV, Instituto de Salud Carlos III, Madrid, Spain
eCardiology Service, Germans Trias i Pujol University Hospital, Badalona, Spain fDepartment of Medicine, Universitat Autònoma de Barcelona, Barcelona, Spain
gInstitute of Biomedical Research of Barcelona (IIBB) - Spanish National Research Council (CSIC), Barcelona, Spain
a b s t r a c t
Adverse cardiac remodeling after myocardial infarction (MI) causes impaired ventricular function and heart fail-ure. Histopathological characterization is commonly used to detect the location, size and shape of MI sites. How-ever, the information about chemical composition, physical structure and molecular mobility of peri- and infarct zones post-MI is rather limited. The main objective of this work was to explore the spatiotemporal biochemical and biophysical alterations of key cardiac components post-MI. The FTIR spectra of healthy and remote myocar-dial tissue shows amides A, I, II and III associated with proteins in freeze-died tissue as major absorptions bands. In infarcted myocardium, the spectrum of these main absorptions was deeply altered. FITR evidenced an increase of the amide A band and the distinct feature of the collagen specific absorption band at 1338 cm−1in the infarct
area at 21 days post-MI. At 21 days post-MI, it also appears an important shift of amide I from 1646 cm− 1to
1637 cm− 1that suggests the predominance of the triple helical conformation in the proteins. The new spectra
bands also indicate an increase in proteoglycans, residues of carbohydrates in proteins and polysaccharides in is-chemic areas. Thermal analysis indicates a deep increase of unfreezable water/freezable water in peri- and in-farcted tissues. In inin-farcted tissue is evidenced the impairment of myofibrillar proteins thermal profile and the emergence of a new structure. In conclusion, our results indicate a profound evolution of protein secondary struc-tures in association with collagen deposition and reorganization of water involved in the scar maturation of peri-and infarct zones post-MI.
Keywords: Myocardial infarction FITR DSC Physical characterization 1. Introduction
Adverse myocardial remodeling is associated with poor patient out-comes in the context of ischemic heart disease and/or myocardial in-farction (MI), cardiac hypertrophy, and cardiomyopathy disease processes[1–3]. In particular, adverse cardiac remodeling after MI causes impaired ventricular function and heart failure (HF). The inci-dence of HF after MI is determined by the size of the infarcted area, the infarct wound healing, and chronic left ventricular (LV) remodeling
[4–6]. LV remodeling after MI involves changes in extracellular matrix (ECM) composition and organization[7]. Differential regional remodel-ing of ECM plays a crucial role in global LV structural remodelremodel-ing after MI[8,9]causing LV dilatation and dysfunction, disability and death
[10,11]. The main components of ECM are collagen molecules, specially collagen type I (85%) and type III (11%)[7,11]. Collagen type I is mainly associated with thick fibers that confer tensile strength and resistance to stretch and deformation while collagen type III is associated with thin fibers that confer resilience. All ECM components play a pivotal role for cardiac function.
Histopathological characterization is commonly used to detect the location, size and shape of MI sites. However, the information about chemical composition, physical structure and molecular mobility of peri- and infarct zones post-MI is rather limited. Spectrophotometric techniques such as Fourier transform infrared (FTIR) spectroscopy give structural information useful to identify key biochemical and
⁎ Corresponding author.
⁎⁎ Correspondence to: V. Llorente-Cortés, Cardiovascular Research Center, CSIC-ICCC, Biomedical Research Institute IIB Sant Pau, Hospital de la Santa Creu i Sant Pau, Sant Antoni Mª Claret, 167, 08025 Barcelona, Spain.
E-mail addresses:[email protected](V. Samouillan),
[email protected](V. Llorente-Cortés).
biophysical alterations in tissues. In this sense, FTIR is a powerful tech-nique that has provided accurate results with a high reproducibility in many areas including cardiovascular research[12,13]. The main advan-tages of FITR are that data analysis can be performed directly on tissues, without the need of staining and the high speed for spectra acquisition (only few minutes). Another suitable technique to characterize biologi-cal tissues at the submicronic sbiologi-cale is Differential Scanning biologi-calorimetry (DSC). This is a standard method to evaluate freezable and unfreezable water in tissues[14], and to assess protein thermal stability and confor-mational changes[15,16]. It is peculiarly well-suited to evaluate the thermal stability of purified collagens in solution or in their aggregated form[17]or directly in cardiovascular tissues[18]and biomaterials[19]. It has been also successfully applied to characterize protein components of muscle tissues, such as myosin and its subfragments, actine and sar-coplasmic proteins[20–22]. The aim of current investigation was to ex-plore the spatiotemporal biochemical and biophysical alterations of key cardiac components post-MI.
2. Material and methods 2.1. Mouse model of MI
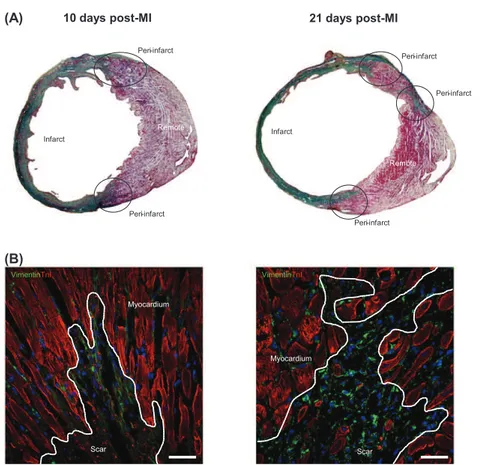
Male C57/Bl6 mice (25–30 g; Charles River Laboratories, Inc.) were used for this study. MI was induced as previously described[23]. Briefly, each animal was intubated and anesthetized with a mixture of O2/ isoflurane and mechanically ventilated. The heart was exposed and the left anterior descending coronary artery was permanently occluded. Animals were sacrificed at 1 day (n = 6), 10 days (n = 14) and 21 days (n = 15) post-operation and hearts were excised and segmented in three parts (remote, peri- and infarcted area) following the scheme in-dicated inFig. 1A. Detailed confocal microsopy images of each part are
shown inFig. 1B. Myocardial samples were frozen in liquid nitrogen for molecular and lipid analysis. Six animals of each group were proc-essed for histological analysis, being the heart arrested in diastole with cardioplegic solution (68.4 mM NaCl, 59 mM KCl, 11.1 mM glucose, 1.9 mM NaHCO3, 29.7 mM 2,3-butanedione monoxime, 1000 U hepa-rin), excised, fixed, cryopreserved in 30% sucrose in phosphate-buffered saline, embedded in Tissue-Tek O.C.T. (Sakura®), and snap-frozen in liquid nitrogen-cooled isopentane. Three control mice were sacrificed to obtain healthy hearts used for vibrational characterization. All animal handling procedures were approved by the Institutional An-imal Care (Cardiovascular Research Center) and Use Committee and conformed to the Guide for the Care and Use of Laboratory Animals of the Institute of Laboratory Animal Research (NIH Pub. No. 86-23, Re-vised 1996).
2.2. Immunofluorescence and histology
Mouse heart cryosections were incubated with primary antibodies against vimentin (2 μg/mL; Abcam, Cambridge UK), elastin (1 μg/mL; Abcam, Cambridge UK) and cardiac troponin I (cTnT; 2 μg/mL; Abcam, Cambridge UK). Nuclei were counterstained with 4′,6-diamidino-2-phenylindole (DAPI) and results were analyzed with an Axio-Observer Z1 (Zeiss, Oberkochen, GE) laser confocal microscope. A polarized light microscope was used to measure collagen types I (predominant in infarcted myocardium) and III (predominant in remote myocardium) on Sirius red-stained sections from both infarct and remote areas. Twelve randomly selected fields from remote (6 images) and infarcted (6 images) zones were taken with a light microscope for polarization (DMi8, Leica, Wetzlar, GE)[24]. Masson's trichromic stain was used to distinguish the muscle fibers (in red, predominant in remote myocardi-um) and collagen (in blue, predominant in infarcted myocardimyocardi-um).
10 days post-MI 21 days post-MI
Peri-infarct Peri-infarct Peri-infarct Peri-infarct Peri-infarct Remote Remote Infarct Infarct
(A)
Scar Scar Myocardium MyocardiumVimentinTnI VimentinTnI
(B)
Fig. 1. (A) Masson's trichromic staining was used to distinguish remote (in red; cardiac muscle fibers), peri- and infarcted tissues (in green; collagen). (B) Immunofluorescence staining identified the scar in the infarcted zone. Cardiac fibroblast marker vimentin is shown in green and cardiac TnI in red. Cell nuclei were counterstained with DAPI (blue). Scale bar 20 μm.
2.3. RNA extraction, cDNA synthesis and gene expression analyses by Real-Time Reverse Transcriptase-Polymerase Chain Reaction
Frozen cardiac tissues from animals sacrificed at 1 day (N = 6), 10 days (N = 6) and 21 days (N = 6) were pulverized using a mortar and a pestle in liquid nitrogen to maintain the integrity of the RNA. An aliquot of tissue (20 mg) was weighed and total RNA was isolated by TriPure™ isolation reagent (Roche Molecular Biochemicals) according to the manufacturer's instructions. RNA yield and quality were assessed by 1% agarose gel electrophoresis. Reverse transcription was performed using 1.5 μg of total RNA and the High Capacity cDNA Reverse Transcrip-tion kit (Applied Biosystems). The cDNA was stored at− 20 °C.
Gene expression analyses of collagen type I (Rn00801565_g1; Ap-plied Biosystems, Foster City, CA) collagen type III (Rn01437682_m1; Applied Biosystems, Foster City, CA) and elastin (Mm00514670_m1; Applied Biosystems, Foster City, CA) mRNA were performed at mRNA level by semi-quantitative Real-Time Reverse Transcriptase-Polymerase Chain Reaction (RT-PCR). Arbp (Mm.PT.58.43894205, IDT Conda, Integrated DNA Technologies, Inc) was used as internal control gene amplification. RT-PCR was performed using 1 μL of reverse tran-scription products and 10 μL of TaqMan Universal PCR Master Mix (Ap-plied Biosystems, Foster City, CA), 1 μL of 20× assays and 8 μL of nuclease-free water. After gentle mixing, the mixture was transferred into a RT-PCR microplate.
RT-PCR was performed in a PCR-7600HT sequence detection system (Abiprism, Applied Biosystems, Foster City, CA) at 50 °C for 2 min, 95 °C for 10 min, 40 cycles at 95 °C for 15 s and 60 °C for 1 min. The relative levels of gene expression were quantified and analyzed using SDS 2.4 software. The real-time value for each sample was averaged and com-pared using the CT method, where the amount of target RNA (2− ΔΔCT) was normalized to the endogenous control (ΔCT). 2.4. Lipid extraction and semi-quantitative analysis of cholesteryl ester, free cholesterol and triglyceride content of cardiomyocytes and myocardium
One portion of myocardial-pulverized tissue (7 mg) was weighed and homogenized in NaOH 0.1 M. The protein content of the extracts was quantified by Pierce BCA Protein Assay (Thermo Fisher Scientific, Waltham, MA) to normalize lipid content. An aliquot of tissue extract (3 mg) was mixed with water (1 mL) and dichloromethane-methanol (1:2) (3 mL). After intense vortexing, dichloromethane (1 mL) was added and vortex again. The mixture was centrifuged at 3500 rpm for 15 min and the organic phase was collected. The sample was concen-trated by evaporating the organic solvent under a N2stream to prevent lipid oxidation.
Cholesteryl ester (CE), free cholesterol (FC) and triglyceride (TG) content in the lipid extract was analyzed by thin layer chromatography (TLC). Lipid extracts were loaded on silica G-25 plates (DC-Fertigplatten SIL G-25 UV254). A mixture of cholesterol, cholesterol palmitate, triglyc-eride, diglyceride and monoglyceride was applied to each plate as stan-dards. The first phase consisting of a mixture of heptane:diethyl-ether:acetic acid (74:21:4 v/v/v), separated the different lipid of the sample. The second phase, consisting in heptane, dragged remaining lipids.
The spots corresponding to CE, TG and FC were quantified by densi-tometry using ChemiDoc system and Quantity-One software (Bio-Rad, Hercules, CA).
2.5. Vibrational characterization
One portion (5 mg) of each segmented frozen part and of healthy myocardium was freeze-dried and used for vibrational characterization. Fourier transform infrared spectroscopy/attenuated total reflectance (FTIR/ATR) spectra of freeze-dried tissues were acquired using a Nicolet 5700 FTIR (Thermo Fisher Scientific, Waltham, MA) equipped in ATR device with a KBr beam splitter and a MCT/B detector. The ATR
accessory used was a Smart Orbit with a type IIA diamond crystal (re-fractive index 2.4). Samples 1 mm2in surface were directly deposed on the whole active surface of the crystal. For each sample, 80 interfer-ograms were recorded in the 4000–450 cm− 1region, co-added and Fourier-transformed to generate an average spectrum of the segmented heart part with a nominal resolution of 2 cm− 1using Omnic 8.0 (Ther-mo Fisher Scientific, Waltham, MA). A single-beam background spec-trum was collected from the clean diamond crystal before each experiment and this background was subtracted from the spectra. Spec-tra were then subjected to ATR and baseline corrections and normalized in the amide II region. These spectra were next used in calculation of in-tegrated bands intensities and their ratios. We employed integration method with a linear baseline drawn trough the peak edges, and the spectrum below this line was integrated over the wavenumber range of the band. Second derivatives and Fourier self-deconvolution (using k = 1.7 and half-width = 13.5 cm− 1) were used to enhance the chem-ical information present in overlapping infrared absorption bands of spectra. All spectra processing was performed using Omnic 8.0. Spectra presented for each group were calculated by averaging the spectra of all the samples within each group.
2.6. Differential scanning calorimetry
Analyses were performed using a DSC Pyris calorimeter (Perkin Elmer, Waltham, MA). The calorimeter was calibrated using Hg and In as standards, resulting in a temperature accuracy of ±0.1 °C and an en-thalpy accuracy of ±0.2 J/g. Fresh samples, 5–10 mg in weight, were set into hermetic aluminium pans and equilibrated at the initial tempera-ture during 5 min before cooling at− 100 °C at 10 °C/min. Then the samples were heated at 10 °C/min until 90 °C. After a cooling at − 100 °C at 10 °C/min, the samples were heated again at 10 °C/min until 90 °C (2nd heating). After completing the DSC measurements, pans were reweighted to check that they had been correctly sealed. The sample pans were pierced and dried to constant weight at 195 °C for 10 min to determine the sample dry weight and the total water weight.
2.7. Statistical analysis
Quantitative values are shown as means ± SEM. All experiments were performed with at least four replicates for each group and for at least three independent repeats. A one-way analysis of variance (one-way ANOVA) and Tukey post-hoc analysis for multiple comparisons were performed to compare the means of the samples. The p-value was also used to determine the significant difference between groups. It was considered statistically significant threshold of P value b0 .05. 3. Results
3.1. Analysis of the main FIRT absorption bands in cardiac tissue
Table 1summarizes IR bands present in healthy and remote tissues and their assignments according to literature[25–29]. The major ab-sorptions in the FTIR spectra of healthy and remote tissues (Fig. 2) are highly reproducible and are composed of amide A, amide I and amide II, mainly associated with proteins in freeze-dried tissues. The main pro-teins in mass of the myocardium are the cardiomyocyte myofibrillar proteins (myosin, α-actin), sarcoplasmic proteins and ECM structural proteins, peculiarly collagens and elastin. Among the five types of colla-gens (I, III, IV, V, VI) identified in the heart, the fibrillar collacolla-gens I and III represent more than 90% of the total collagens, acting as strength trans-ducers and maintaining the tridimensional structure during the contraction-relaxation cycle.
Most of these proteins have overlapped absorptions bands. Never-theless, previous studies showed that collagens (I, III, IV, V, VI) exhibit a specific triplet at 1206, 1238, 1280 cm− 1(arising from the amide III
vibration) and a specific absorption at 1338 cm− 1(wagging of proline side chain)[25,28,30]. Moreover, comparison between the FTIR spectra of muscle and its separated components -myofibrils and extracellular matrix- corroborated the absence of the 1206, 1240 and 1339 cm− 1 ab-sorption band in myofibers[31]. Among these different vibrations, the 1338 cm− 1band is the only one that does not overlap with the absorp-tion or other components like DNA, lipids or proteoglycans. It must be pointed out that such a vibration, associated with proline, is also present in the FTIR spectrum of another rich-proline protein of ECM, namely elastin. Nevertheless, our previous studies on pure collagen and elastin FTIR spectra evidenced that the absorbance of this band was significant-ly higher in collagen, certainsignificant-ly due to the specific arrangement of pro-line in this protein in contrast with elastin. The band at 1338 cm− 1 can thus be addressed to the specific signature of the structural proteins of ECM with a strong contribution of collagens.
Moreover, the band at 1304 cm− 1, found in the FTIR spectrum of myofibers but absent in the spectra of ECM, is assigned to the specific signature of myofibers.
Other components contribute to these complex spectra, especially lipids with their classical markers in the 2800–3000 cm− 1(especially the CH2stretching of long hydrocarbon chains), and in the 1475– 1450 cm− 1. These lipids mainly include phospholipids of the plasmatic membranes (confirmed by the presence of the C_O stretching of ester groups at 1740 cm− 1[32]and the PO
2
−stretching bands) that represent 20% in weight of heart , triglycerides (C_O stretching of ester groups at 1740 cm− 1), that are known to represent 25% of the total mass of lipids and free fatty acids (C_O stretching at 1712 cm− 1and COO- stretching at 1392 cm− 1) absorbed by the cardiac cells and used as the primary supply of energy[33]. Unsaturated lipids possess a specific marker at 3013 cm− 1.
As already mentioned, DNA also plays a part in this spectrum with the contribution to the absorption bands at 1712, 1246–1235, 1079 and 973 cm− 1, which are composite bands that cannot be used for quantification.
Proteoglycans are also present in the myocardium tissues, with the contribution to the 1079 cm− 1 band and the specific band at 1226 cm− 1, overlapping with protein amide III. They are frequently ig-nored when examining the cardiac ECM, but could be an important de-terminant of residual stress [34]. Finally, glycogen and other polysaccharides contribute to the FTIR spectrum of healthy and remote myocardium, in the 1200–1000 cm− 1region, which is a ‘mixed’ region. In order to quantify the variations observed in the averaged spectra, the area of the different absorption bands were computed from the in-dividual spectrum of each tissue and the appropriate ratio of areas was performed according to the literature data[25,26].
3.2. Spatio-temporal alterations in FITR absorption bands related with cardiac remodeling post-MI
The major absorption bands reported inTable 1for remote myocar-dium tissues are evidenced in the averaged spectra of peri- and infarct-ed tissues. On the averaginfarct-ed global spectra, the major difference concerns the increase of the amide A band in peri- and infarcted tissues (especially at 21 days post-MI) (Fig. 2A), with the enhancement of the 3390 cm− 1component associated with H-bonded OH groups[35]and the distinct feature of the collagen specific absorption band at 1338 cm− 1 peculiarly in the infarcted zone at 21 days post-MI (Fig. 2C), attesting of a profound remodeling of the ECM. Polarized light and confocal microscopy images show an important deposition of collagen and elastin, respectively (Fig. 3A–L) at 10 and 21 days post-MI. Accordingly, RT-PCR results show a significant increase of col-lagen type I (Fig. 3M), collagen type III (Fig. 3N) and elastin (Fig. 3O) at 10 days. Collagen type III and elastin mRNA expression were maintained over 21 days post-MI. In contrast, collagen type I decayed at 21 days post-MI. In agreement with these results, the indicator of the quantity of the structural proteins of the ECM (collagens and elastin) with re-spect to the total amount of proteins in myocardial tissues computed from the corresponding FTIR peak ratio significantly increases in infarct-ed zones at 10 days post-MI (Fig. 4A).
The side chain absorption was also modified in infarcted tissues, in particular the tyrosine band at 1517 cm− 1was reduced in infarct tissues (Fig. 5A). It is known that collagen has a very low tyrosin content, thus, the tyrosin reduction could be caused by an increase of the collagenic fraction in infarcted tissues as already suggested in remodeled cardiac tissues[28]. Moreover, the contribution of glutamic acids and aspartic acids (present in a relatively large amount in collagen) certainly con-tribute to the enhanced absorption at 1566 cm− 1(Fig. 5A) previously described in remodeled tissues[36,37].
3.3. Spatio-temporal evolution of the secondary structure of proteins Both the amide I and the amide II have been shown to be conforma-tional sensitive, and thus are widely used to determine protein second-ary structure. Second derivatives and Fourier self-deconvolution are
Table 1
Main absorption bands of healthy and remote myocardial tissues. Band position
(cm− 1) Assignment
3283 Amide A
mainly ν(N-H) mode of protein with the contribution of the ν(O\\H) stretching mode in H2O and polysaccharides
3072 ν(C\\H) aromatic
3013 ν(C_H) of unsatured lipids, triglycerides, fatty acids 2957, 2923,
2871, 2852
νas(CH3), νas(CH2), νs(CH3),νs(CH2),
(Gly, Pro, Hyp, Ala) of proteins + phospholipids, triglycerides Most representative of proteins: νs(CH3)
Most representative of lipids: νas(CH2) and νs(CH2)
1740 ν(C_O) of ester carbonyl groups of phospholipids and triglycerides
1712 ν(C_O) of nucleoside side of nucleic acids and ν(C_O) of free fatty acids
1646 Amide I ν(C_O)
Multi-component band sensitive to protein secondary structure
Better resolved in second derivative or FSD spectra 1540 Amide II ν(C-N), δ (N-H)
Multi-component band sensitive to protein secondary structure
Better resolved in second derivative or FSD spectra 1515 Tyrosine band
1471, 1452 δ(CH2) scissoring, δ(CH3) bending of lipids (mainly), proteins
1392 νs(COO-) of free amino acids, fatty acids, δ(CH3)
1338 δ(CH2) wagging of proline chain
Specific band of collagen
1310–1202 Amide III δplan(N\\H) and ν(C\\N) of proteins
Sensitive to secondary structure 1240 cm− 1: specific of ECM (collagen)
1204 cm− 1: specific of ECM (collagen)
1304 cm− 1: specific of myofibers
1246–1235 νas(PO2−) stretching of phospholipids, nucleic acids
1226 ν(SO42−) of proteoglycans
1200–1000 ν(C\\O), ν(C\\C), ν(C\\OH), ν(C\\O\\C) of proteins, oligosaccharides, glycolipids
Better resolved in second derivative or FSD spectra In peculiar
1171: νas(CO\\O\\C) of cholesterol esters, phospholipids (specific of myofibers)
1159: ν(C\\OH) of Hyp and nucleic acids
1127: ν(C\\O) lactate, polysaccharides, glycogen - specific of myofibers
1080: ν(C\\O\\C) collagen, glycogen, oligosaccharides, glycolipids, proteoglycans – specific of ECM νs(PO2−) nucleic acids, phospholipids
1042: νs(CO\\O\\C) of carbohydrates residues and polysaccharides
1120: glycogen (specific of myofibers)
973 Phosphorylated proteins, phospholipids, nucleic acids 930 υ(Cα-C)characteristic of α helices
classically used to enhance the chemical information present in overlap-ping infrared absorption bands of spectra, and these techniques were applied to the spectra of remote and infarcted myocardial tissues in order to follow the evolution of the proteins structures. The important shift of the amide I towards low wave number (from 1646 to 1637 cm− 1) in peri- and infarcted zone, which is visible at 10 and 21 days post-MI (Fig. 2B) attests the important modification of the sec-ondary structures of proteins post-MI.
As an averaging technique, IR spectroscopy simultaneously provides information concerning all proteins present in the tissue. Thus, it is not possible to attribute specific amide absorptions to peculiar secondary structures within individual proteins. However, the appearance of an amide I maximum at 1650 cm− 1in FSD spectra (Fig. 5A) was corrobo-rated by a main minima at the same wave number in second derivative spectra in remote myocardium (Fig. 5B). These results indicate that the proteins in myocardium adopt a predominantly α-helical/random con-formation. This is also confirmed by the main maximum of amide II at 1538 cm− 1in the FSD spectrum of remote tissues (and confirmed by a main minima in its second derivative spectrum), associated with α he-lical structures/unordered in heart[25]. Another secondary structure evidenced in remote tissue is the β sheet structure with its associated vibration at 1632 cm− 1in the amide I zone and at 1555 cm− 1in the amide II zone (Fig. 5A and B).
Both amide I and amide II undergo profound modifications in in-farcted tissues, at 10 and 21 days post-MI, in particular with the emer-gence of a new band at 1637 cm− 1(marked onFig. 5A and B). It is noteworthy that this component becomes the most intense in the FSD spectrum of infarcted tissues at 21 days post-MI, explaining the shift to-ward low wavenumber of the amide I of the global spectrum of infarct-ed tissues (Fig. 2B). Another important modification concerns the amide II band with the vanishing of the main component at 1538 cm− 1 (assigned to α helical or unordered structures) and the emergence of a new main component at 1542–1545 cm− 1both in FSD and second de-rivative spectra (Fig. 5A and B).
Finally, there is a shift of the band at 1632 cm− 1(associated with β sheets structures) toward 1627 cm−1in infarcted tissues (Fig. 5A), that could be attributed to an aggregation of proteins (inter molecular β sheets).
3.4. Spatio-temporal alterations in lipids post-MI
A slight decrease of the absorption of the 1740 cm− 1band associated to phospholipids and nucleic acids was detected in peri- and infarcted zones both at 10 and 21 days post-MI (Fig. 2B). This decrease is in agree-ment with the decrease of the absorption band of unsaturated lipids at 3013 cm− 1 in the averaged spectra of infarcted tissues at 21 days post-MI (Fig. 2A).The indicator of the amount of phospholipids related to proteins drastically decreases in peri- and infarcted myocardial tis-sues at all stages of post-MI (Fig. 4B). The loss of phospholipids and the increase in structural proteins in the ischemic areas is illustrated by the third indicator (collagen/phospholipid ratio) (Fig. 4C) computed from distinct absorption bands and proportional to the ratio of ECM structural proteins against the lipid phase.
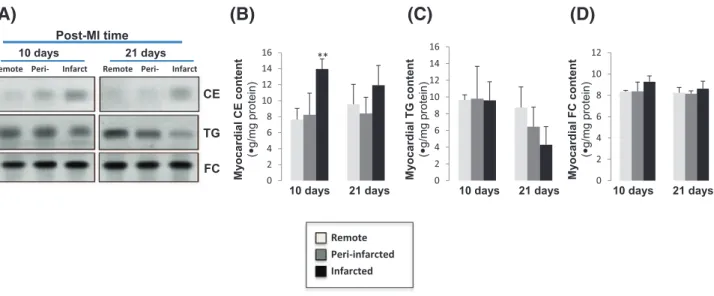
TLC after lipid extraction showed a significant increase of CE content in the infarcted area compared to peri- and remote areas at 10 days post-MI (Fig. 6A and B). At 21 days post-MI, the CE content is also higher in infarct areas but lacks significance. In contrast to CE, TG remained constant between the three tested zones at 10 days and has a tendency to decrease in infarct areas at 21 days post-MI (Fig. 6A and C). There was not alteration in the myocardial FC content between areas at 10 or 21 days post-MI (Fig. 6A and D).
3.5. Spatio-temporal alterations in proteoglycans and polysaccharide post-MI
The zone 1250–1200 cm− 1that corresponds to the mixed zone of proteins/phospholipids/proteoglycans/polysaccharide is altered in in-farcted tissues at 21 days post-MI, with a shift of the main maximum
(B) (C)
(A)
Figs. 2. Averaged FTIR spectra of healthy, remote, peri- and infarcted myocardial tissues in the 4000–2500 cm− 1window (A) in the 1800–1350 cm−1window (B) and in the 1370–
900 cm− 1window (C). N = 4. Major assignments are noted on the graphs. Amides I and III marked by dotted lines to show the shift. Frame of the specific absorbance of collagen at
2
1
d
a
y
s
Elas
tin
T
n
T
D
API
P
o
la
ri
z
ed
ligh
t
1
0
da
y
s
Elas
tin
T
n
T
D
API
P
olariz
ed
ligh
t
Infarct
Peri-infarct
Remote
A
B
D
C
E
F
G
H
I
J
K
L
(M)
0 2 4 6 8 10 121 day 10 days 21 days
C o llagen ty pe I mRN A (n o rm a liz e d b y A rb p ) *** C ol la g e n t y p e I II m R N A (n o rm a liz e d b y A rb p )
(N)
0 2 4 6 8 10 121 day 10 days 21 days
*** *** 0 2 4 6 8 10 12 14
1 day 10 days 21 days
Elasti n mRN A (n o rm a liz e d b y A rb p ) *** ***
(O)
Fig. 3. (A–L) Collagen and elastin histological analysis at 10 and 21 days post-MI. Immunofluorescence staining (A–C and G–I) showing elastin distribution (green) in infarcted, peri-infarcted and remote zones. Cardiac troponin T (grey) was also detected for structural contrast. Nuclei were counterstained with 4′,6-diamidino-2-phenylindole (DAPI, blue). Sirius red-staining under polarized light (D–F and J–L) to distinguish collagen I (yellow/red) and III (green) fibers. Scale bar 20 μm. (M). Bar graphs showing relative expression of collagen type I (M), collagen type III (N) and elastin (O) mRNA in infarct zone versus remote zone at 1, 10 and 21 days post-MI. Values were normalized to Arbp. Results are expressed as mean ± SEM. N = 6. ⁎⁎⁎P b 0.005 versus 1 day post-MI.
(A)
(B)
(C)
Fig. 4. Bar graphs showing the collagen/proteins indicator (A), the phospholipid/proteins -indicator(B) and the collagen/phospholipids indicator (C) from the corresponding FTIR peaks area ratio as mentioned in the Y-axis for remote, peri- and infarcted myocardial tissues. Results are expressed of mean ± SEM. N = 3. ⁎⁎P b 0.01 versus remote area.
from 1232 towards 1222 cm− 1(Fig. 2C). This shift could be due to the increase of the proteoglycans. The 1042 cm−1band associated with car-bohydrate residues of proteins (in peculiar collagen) and polysaccha-rides is increased in peri- and infarct zones at 21 days post-MI. 3.6. Spatio-temporal evolution in the hydric organization of myocardial tissues
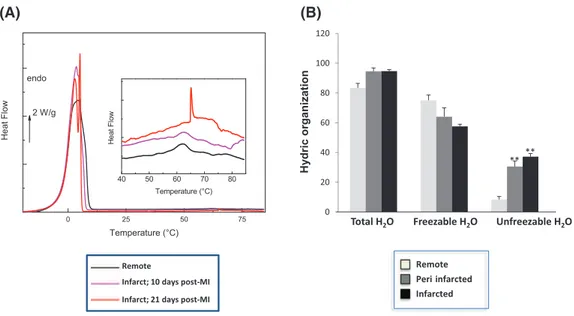
InFig. 7A are reported the DSC thermograms of fresh myocardial tis-sues corresponding to the first heating at 10 °C min− 1between
− 30 and 85 °C; for the sake of clarity only one thermogram for each type of sample was presented.
All the thermograms are characterized by an endothermic peak in the [− 10;10 °C] zone corresponding to the melting of previously frozen water. This extrinsic transition is widely used to quantify the amount of total freezable water in hydrated proteins and tissues (by dividing the area of the measured endothermic peak by 334 J g− 1, corresponding to the melting enthalpy of pure ice at 0 °C)[14,38,39]and completes thermogravimetric analyses giving the total amount of water. The term freezable water is preferred to the term ‘free’ water – rather re-served to vibrational or relaxational techniques - since it covers bulk
water in excess but also confined water in mesopores. The amount of unfreezable water can be calculated by a simple difference. This quanti-fication was performed for all the samples and reported inFig. 7B.
The amounts of total water and unfreezable water were higher in peri- and infarcted tissues than in healthy ones where was higher the amount of freezable water.
4. Discussion
LV remodeling can be currently characterized by Proteomics, gene arrays and physiological techniques. Here, we provide conformational and thermal characterization of key cardiac components in LV remodel-ing at 10 and 21 days MI. At early infarct stages (1 day post-MI) the main component of infarcted areas is inflammation and inflam-matory cells. Therefore, FITR and other techniques suitable for charac-terization of extracellular matrix physical structure seem to be useless at this time post-MI. In contrast, RT-PCR and confocal microscopy showed a strong increase in collagen and elastin in peri- and infarcted areas at 10 and 21 days versus 1 day post-MI. Coherently, we have per-formed conformational ant thermal characterization at 10 and 21 days post-MI.
(A)
(B)
Fig. 5. Averaged second derivative spectra (A) and FSD spectra (B) computed from FTIR spectra of remote, peri- and infarcted myocardial tissues. Arrows indicate new bands in infarcted tissues. N = 4.
(A)
(B)
(C)
(D)
Fig. 6. Representative thin layer chromatography (TLC) (A) showing the content of cholesteryl esters (CE), triglyceride (TG) and free cholesterol (FC) in the myocardium. Bar graphs showing the quantification of bands corresponding to CE (B), TG (C) and FC (D). Results are expressed as mean ± SEM. N = 5. ⁎⁎P b 0.01 versus remote area.
Here, we report three main findings, 1) phospholipid/protein ratio decreases while collagen/protein increases in peri- and infarcted zones; 2) peri- and infarcted areas are more hydrophilic than non-infarcted areas and 3) alterations in secondary structures and aggrega-tion of proteins are important phenomena in infarcted areas.
Here, we observed that among the different vibrations found in the FTIR spectra, the band of 1338 cm− 1was the only one that did not over-lap with the absorption of other components like DNA, lipids or proteo-glycans. In previous studies, the peak at 1338 cm− 1was used to estimate the collagen integrity[40]and more recently it has reported a strong correlation between FTIR absorption at 1338 cm− 1and deposi-tion of collagen type I analyzed by immuno-histochemical staining[41]. In post-MI, collagen deposition allows scar maturation[42,43]. These findings agree with our FTIR results and confocal microscopy images showing and important collagen deposition in the peri- and infarcted areas at 10 and 21 days post-MI, when the scar is forming.
We also found in peri- and infarct areas a clear increase in the quan-tity of elastin, other key structural protein of the ECM. The increase in the quantity of collagen and elastin deposition in these areas was con-comitant with a parallel decrease in unsaturated lipids, previously asso-ciated with necrosis and phagocytosis of membrane debris[44]. In addition, the decrease of the ratio phospholipid/protein ratio that we have observed in the infarcted tissues in mice is in agreement with pre-vious results published in Syrian hamster model[26]. The higher amount of total and unfreezable water in infarcted myocardium that we have found in DSC thermograms is coherent with the enhancement of the H-bonded OH absorption in the Amide A and the decrease of phospholipid/proteins ratio quantified by FTIR on freeze-dried tissues. Taken together, these results show a strong extracellular remodeling with increased collagen and elastin and decreased phospholipid content occurring in infarcted myocardium. These results are in agreement with previous results[45]. In our model, the important decrease of phospho-lipid/protein ratio could be due to both the decrease of phospholipids from plasmatic membranes of cardiomyocytes (due to the necrosis of cardiomyocytes and phagocytosis of membrane debris in the first stage of MI) and to scar formation with collagen deposition as main component in the infarcted zone. The FSD spectra evolution confirms this assumption, with the reduction of the 1713 cm− 1band, one of the major DNA sensitive bands[46], in infarcted areas.
The hydrophilic evolution of the infarcted zones is confirmed by the significant modification of the unfreezable water/freezable water ratio (from 0.11 in remote tissues to 0.57 in infarcted tissues, p b 0.05).
Unfreezable water –corresponding to the filling of the first hydration shell of proteins and other hydrophilic components, and so associated with ‘bound’ water- is a very minor part in remote tissues, containing more than 20% in weight of lipids that exclude water and organize it in freezable water. In our case, collagen deposition in infarcted areas leads to a significant increase of the unfreezable water. It can be explain through the collagen co-deposition with hydrophilic compounds as heparan-sulfate proteoglycans[47,48]. Proteoglycans could increase the hydrophilic character of the infarcted area, increasing the unfreezable water content detected by DSC thermograms. Myocardial water content is clinically used as an in-vivo marker of myocardial edema[49–51]. Traditionally it has been considered that edema occurs soon after reperfusion and dissipates at 24 h. However, Fernandez-Jimenez and collaborators have recently reported that edema in the is-chemic region follows a bimodal pattern in a pig model of myocardial infarction[52,53]. The first wave of edema is clearly related to reperfu-sion, however, according to authors, the second wave of edema could be caused by removal of cardiomyocyte debris and its replacement by water, collagen and healing. Our results support this hypothesis since we have found a significant increase of unfreezable water and proteo-glycans in the ischemic regions at 21 days post-MI. Therefore, we pro-pose that proteoglycans may participate in unfreezable water increase and ultimately post-MI edema. Indeed, previous studies already report-ed proteoglycans to be key for the development of pulmonar report-edema[54, 55]. Further studies are required to evaluate the role of proteoglycans on edema formation and evolution. Indeed, this is a crucial clinical question due to the pivotal role of edema on diagnosis, prognosis and therapeu-tics. In particular, previous studies have reported that volume of edema relates to functional recovery after reperfused acute myocardial infarc-tion[56].
In the 45–85 °C zone of remote tissues thermograms, multiple and weak endothermic events are observed corresponding to the denatur-ation zone of cardiac muscle proteins. Myofibrillar, sarcoplasmic pro-teins and collagens constitute the major class of propro-teins in muscle. According to DSC literature data, at least four major transitions are char-acteristic of muscle proteins: myosin in the [52–58 °C], sarcoplasmic proteins in the [60–72 °C], collagen in the [61–65 °C] and actin in the [71–83 °C] ranges[22,57]. Remote and infarcted tissues at 10 days post-MI exhibit a very similar denaturation profile with major transi-tions at 52, 57, 62, 69 and 75 °C. In contrast, the denaturation feature of infarcted tissues at 21 days post-MI is very distinct, with the emer-gence of a sharp and intense peak at 65 °C that is associated with
(A)
(B)
Fig. 7. DSC thermograms (A) and bar graph of the hydric organization (B) of remote, peri- and infarcted myocardial tissues (fresh tissues). Results are expressed as mean ± SEM. N = 3. ⁎⁎P b 0.01 versus remote area.
neosynthesized collagen fibers for the scar maturation. As a matter of fact, the mature cardiac scar contents cross-linked stiff collagen forms that provide rigidity and stability to the scar[58].
This specific thermal signature of the triple helix domain at 65 °C has to be connected to the specific vibrational component at 1637 cm− 1, ev-idenced both in the second derivative and FSD spectra in infarcted areas. It has been identified as a specific marker of the triple helix of collagen by some authors[59]and evidenced in the triple helical synthetic poly-peptide (Pro-Hyp-Gly)10[60], which corroborates the quantitative FTIR analysis and microscopic images of remodeled infarcted tissues. Even if the assignation to peculiar secondary structures is less straightforward for amide II, and most of all in the case of complex tissues[61], the band at 1543 cm− 1that intensifies at 21 days post-MI can be assigned to another specific marker of collagen in infarcted tissues[59]. It has been previously reported that triple helix characteristically represent fi-brosis, that may only appear in old myocardial infarction and that these structures are extensively involved in the infarction process[62].
In summary, we have determined the spatiotemporal biochemical and biophysical alterations of key cardiac components in LV remodeling at 10 and 21 days post-MI. Our analysis evidence a profound evolution of protein secondary structures and an important collagen deposition in association with a significant reorganization of water in the infarcted tissue, reflecting physical processes involved in scar maturation post-MI.
Funding
The research leading to these results received funding from the Instituto de Salud Carlos III (FIS PI14/01729 and FIS PI14/01682) that was cofinanced by the European Fund for Regional Development, and CIBER Cardiovascular (CB16/11/00403), as well as from the Ministerio de Ciencia e Innovación (SAF2011-30067-C02-01), the Fundació La Marató de TV3 (201521_10, 201502_30 and 080330), the Red de Terapia Celular-TerCel (RD12/0019/0029), the Sociedad Española de Cardiología and the Fundació Privada Daniel Bravo Andreu. DdG is a recipient of CD14/0109 from Sara Borell of the Instituto de Salud Carlos III.
Transparency Document
TheTransparency documentassociated with this article can be found, in online version.
References
[1] M.H. Drazner, J.E. Rame, E.K. Marino, J.S. Gottdiener, D.W. Kitzman, J.M. Gardin, T.A. Manolio, D.L. Dries, D.S. Siscovick, Increased left ventricular mass is a risk factor for the development of a depressed left ventricular ejection fraction within five years: the cardiovascular health study, J. Am. Coll. Cardiol. 43 (2004) 2207–2215.
[2] C.S. Lam, J. Grewal, B.A. Borlaug, S.R. Ommen, G.C. Kane, R.B. McCully, P.A. Pellikka, Size, shape, and stamina: the impact of left ventricular geometry on exercise capac-ity, Hypertension 55 (2010) 1143–1149.
[3] D.L. Mann, M.R. Bristow, Mechanisms and models in heart failure: the biomechani-cal model and beyond, Circulation 111 (2005) 2837–2849.
[4] M.A. Pfeffer, E. Braunwald, Ventricular remodeling after myocardial infarction. Ex-perimental observations and clinical implications, Circulation 81 (1990) 1161–1172.
[5] L.H. Opie, P.J. Commerford, B.J. Gersh, M.A. Pfeffer, Controversies in ventricular re-modelling, Lancet 367 (2006) 356–367.
[6] G.W. Dorn II, Novel pharmacotherapies to abrogate postinfarction ventricular re-modeling, Nat. Rev. Cardiol. 6 (2009) 283–291.
[7] B.I. Jugdutt, Ventricular remodeling after infarction and the extracellular collagen matrix: when is enough enough? Circulation 108 (2003) 1395–1403.
[8] F. Zannad, F. Alla, B. Dousset, A. Perez, B. Pitt, Limitation of excessive extracellular matrix turnover may contribute to survival benefit of spironolactone therapy in pa-tients with congestive heart failure: insights from the randomized aldactone evalu-ation study (RALES). Rales investigators, Circulevalu-ation 102 (2000) 2700–2706.
[9] D.L. Mann, Inflammatory mediators and the failing heart: past, present, and the foreseeable future, Circ. Res. 91 (2002) 988–998.
[10] K.T. Weber, P. Anversa, P.W. Armstrong, C.G. Brilla, J.C. Burnett Jr., J.M. Cruickshank, R.B. Devereux, T.D. Giles, N. Korsgaard, C.V. Leier, et al., Remodeling and reparation of the cardiovascular system, J. Am. Coll. Cardiol. 20 (1992) 3–16.
[11] B.I. Jugdutt, Remodeling of the myocardium and potential targets in the collagen degradation and synthesis pathways, Curr. Drug Targets Cardiovasc. Haematol. Disord. 3 (2003) 1–30.
[12] M. Kuwahara, K. Bannai, H. Segawa, K. Miyamoto, H. Yamato, Cardiac remodeling as-sociated with protein increase and lipid accumulation in early-stage chronic kidney disease in rats, Biochim. Biophys. Acta 1842 (2014) 1433–1443.
[13] K.M. Marzec, A. Rygula, M. Gasior-Glogowska, K. Kochan, K. Czamara, K. Bulat, K. Malek, A. Kaczor, M. Baranska, Vascular diseases investigated ex vivo by using Raman, FT-IR and complementary methods, Pharmacol. Rep. 67 (2015) 744–750.
[14] Y.T.N. Aktas, H.Y. Gökalp, Determination of freezable water content of beef semimembranous muscle DSC study, J. Thermal Anal. 48 (1997) 259–266.
[15] E. Fodor, J.W. Mack, J.S. Maeng, J.H. Ju, H.S. Lee, J.M. Gruschus, J.A. Ferretti, A. Ginsburg, Cardiac-specific Nkx2.5 homeodomain: conformational stability and spe-cific DNA binding of Nkx2.5(C56S), Biochemistry 44 (2005) 12480–12490.
[16] V. Samouillan, J. Dandurand, C. Lacabanne, R.J. Thoma, A. Adams, M. Moore, Compar-ison of chemical treatments on the chain dynamics and thermal stability of bovine pericardium collagen, J. Biomed. Mater. Res. A 64 (2003) 330–338.
[17] C.A. Miles, T.V. Burjanadze, A.J. Bailey, The kinetics of the thermal denaturation of collagen in unrestrained rat tail tendon determined by differential scanning calo-rimetry, J. Mol. Biol. 245 (1995) 437–446.
[18] V. Samouillan, J. Dandurand, C. Lacabanne, A. Stella, M. Gargiulo, A. Degani, A. Gandaglia, M. Spina, Characterization of aneurysmal aortas by biochemical, thermal, and dielectric techniques, J. Biomed. Mater. Res. A 95 (2010) 611–619.
[19] J.M. Lee, C.A. Pereira, D. Abdulla, W.A. Naimark, I. Crawford, A multi-sample denatur-ation temperature tester for collagenous biomaterials, Med. Eng. Phys. 17 (1995) 115–121.
[20] D.J. Wright, P. Wilding, Differential scanning calorimetric study of muscle and its proteins: myosin and its subfragments, J. Sci. Food Agric. 35 (1984) 357–372.
[21] F.K.T. Dergez, N. Farkas, J. Belőgyi, D. Lõrinczy, DSC study of glycerol-extracted mus-cle fibers in intermediate states of ATP hydrolysis, J. Therm. Anal. Calorim. 80 (2005) 445–449.
[22] M.C.P.P. Tamilmani, Thermal analysis of meat and meat products, J. Therm. Anal. Calorim. 123 (2016) 1899–1917.
[23] A. Bayes-Genis, C. Soler-Botija, J. Farre, P. Sepulveda, A. Raya, S. Roura, C. Prat-Vidal, C. Galvez-Monton, J.A. Montero, D. Buscher, J.C. Izpisua Belmonte, Human progeni-tor cells derived from cardiac adipose tissue ameliorate myocardial infarction in ro-dents, J. Mol. Cell. Cardiol. 49 (2010) 771–780.
[24] A. Nicoletti, D. Heudes, N. Hinglais, M.D. Appay, M. Philippe, C. Sassy-Prigent, J. Bariety, J.B. Michel, Left ventricular fibrosis in renovascular hypertensive rats. Effect of losartan and spironolactone, Hypertension 26 (1995) 101–111.
[25] E. Staniszewska, K. Malek, M. Baranska, Rapid approach to analyze biochemical var-iation in rat organs by ATR FTIR spectroscopy, Spectrochim. Acta A Mol. Biomol. Spectrosc. 118 (2014) 981–986.
[26] W.S.Q. Wang, L.M. Miller, A. Voigt, K. Klingel, R. Kandolf, et al., Infrared imaging of compositional changes in inflammatory cardiomyopathy Vib, Spectroscopy 38 (2005) 217–222.
[27] K.M. Gough, D. Zelinski, R. Wiens, M. Rak, I.M. Dixon, Fourier transform infrared evaluation of microscopic scarring in the cardiomyopathic heart: effect of chronic AT1 suppression, Anal. Biochem. 316 (2003) 232–242.
[28] P.S. Bromberg, K.M. Gough, I. MC. Dixon, Collagen remodeling in the extracellular matrix of the cardiomyopathic Syrian hamster heart as assessed by FTIR attenuated total reflectance spectroscopy, Can. J. Chem. 77 (1999) 1843–1855.
[29] V. Zohdi, B.R. Wood, J.T. Pearson, K.R. Bambery, M.J. Black, Evidence of altered bio-chemical composition in the hearts of adult intrauterine growth-restricted rats, Eur. J. Nutr. 52 (2013) 749–758.
[30] K. Belbachir, R. Noreen, G. Gouspillou, C. Petibois, Collagen types analysis and differ-entiation by FTIR spectroscopy, Anal. Bioanal. Chem. 395 (2009) 829–837.
[31] C. Kirschner, R. Ofstad, H.J. Skarpeid, V. Host, A. Kohler, Monitoring of denaturation processes in aged beef loin by Fourier transform infrared microspectroscopy, J. Agric. Food Chem. 52 (2004) 3920–3929.
[32] V. Dritsa, K. Pissaridi, E. Koutoulakis, I. Mamarelis, C. Kotoulas, J. Anastassopoulou, An infrared spectroscopic study of aortic valve. A possible mechanism of calcifica-tion and the role of magnesium salts, In Vivo 28 (2014) 91–98.
[33] I.J. Goldberg, C.M. Trent, P.C. Schulze, Lipid metabolism and toxicity in the heart, Cell Metab. 15 (2012) 805–812.
[34] G.M. Fomovsky, S. Thomopoulos, J.W. Holmes, Contribution of extracellular matrix to the mechanical properties of the heart, J. Mol. Cell. Cardiol. 48 (2010) 490–496.
[35] M.C. Popescu, C. Vasile, O. Craciunescu, Structural analysis of some soluble elastins by means of FT-IR and 2D IR correlation spectroscopy, Biopolymers 93 (2010) 1072–1084.
[36] A. Barth, The infrared absorption of amino acid side chains, Prog. Biophys. Mol. Biol. 74 (2000) 141–173.
[37] O.S. Rabotyagova, P. Cebe, D.L. Kaplan, Collagen structural hierarchy and sus-ceptibility to degradation by ultraviolet radiation, Mater. Sci. Eng., C 28 (2008) 1420–1429.
[38] A. Panagopoulou, A. Kyritsis, I.S.R. Sabater, J.L. Gomez Ribelles, N. Shinyashiki, P. Pissis, Glass transition and dynamics in BSA-water mixtures over wide ranges of composition studied by thermal and dielectric techniques, Biochim. Biophys. Acta 1814 (2011) 1984–1996.
[39] K.R. Heys, M.G. Friedrich, R.J. Truscott, Free and bound water in normal and catarac-tous human lenses, Invest. Ophthalmol. Vis. Sci. 49 (2008) 1991–1997.
[40] N.P. Camacho, P. West, P.A. Torzilli, R. Mendelsohn, FTIR microscopic imaging of col-lagen and proteoglycan in bovine cartilage, Biopolymers 62 (2001) 1–8.
[41] R. Cheheltani, J.M. Rosano, B. Wang, A.K. Sabri, N. Pleshko, M.F. Kiani, Fourier trans-form infrared spectroscopic imaging of cardiac tissue to detect collagen deposition after myocardial infarction, J. Biomed. Opt. 17 (2012) 056014.
[42] O. Dewald, G. Ren, G.D. Duerr, M. Zoerlein, C. Klemm, C. Gersch, S. Tincey, L.H. Michael, M.L. Entman, N.G. Frangogiannis, Of mice and dogs: species-specific differ-ences in the inflammatory response following myocardial infarction, Am. J. Pathol. 164 (2004) 665–677.
[43] N.G. Frangogiannis, The immune system and cardiac repair, Pharmacol. Res. 58 (2008) 88–111.
[44] K. Lui, M. Jackson, M.G. Sowa, H. Ju, I.M. Dixon, H.H. Mantsch, Modification of the ex-tracellular matrix following myocardial infarction monitored by FTIR spectroscopy, Biochim. Biophys. Acta 1315 (1996) 73–77.
[45]Y. Nasa, Y. Sakamoto, A. Sanbe, H. Sasaki, F. Yamaguchi, S. Takeo, Changes in fatty acid compositions of myocardial lipids in rats with heart failure following myocar-dial infarction, Mol. Cell. Biochem. 176 (1997) 179–189.
[46] K.Z. Liu, L. Jia, S.M. Kelsey, A.C. Newland, H.H. Mantsch, Quantitative determination of apoptosis on leukemia cells by infrared spectroscopy, Apoptosis 6 (2001) 269–278.
[47] A.W. Lyon, S. Narindrasorasak, I.D. Young, T. Anastassiades, J.R. Couchman, K.J. McCarthy, R. Kisilevsky, Co-deposition of basement membrane components during the induction of murine splenic AA amyloid, Lab. Invest. 64 (1991) 785–790.
[48] I.G. Lunde, K.M. Herum, C.C. Carlson, G. Christensen, Syndecans in heart fibrosis, Cell Tissue Res. 365 (2016) 539–552.
[49] T.D. Scholz, J.B. Martins, D.J. Skorton, NMR relaxation times in acute myocardial in-farction: relative influence of changes in tissue water and fat content, Magn. Reson. Med. 23 (1992) 89–95.
[50]D. Garcia-Dorado, J. Oliveras, Myocardial oedema: a preventable cause of reperfu-sion injury? Cardiovasc. Res. 27 (1993) 1555–1563.
[51] D. García-Dorado, J. Oliveras, J. Gili, E. Sanz, F. Pérez-Villa, J. Barrabés, M.J. Carreras, J. Solares, J. Soler-Soler, Analysis of myocardial oedema by magnetic resonance imag-ing early after coronary artery occlusion with or without reperfusion, Cardiovasc. Res. 27 (1993) 1462–1469.
[52]R. Fernández-Jiménez, J. García-Prieto, J. Sánchez-González, J. Agüero, G.J. López-Martín, C. Galán-Arriola, A. Molina-Iracheta, R. Doohan, V. Fuster, B. Ibáñez, Patho-physiology underlying the bimodal edema phenomenon after myocardial ische-mia/reperfusion, J. Am. Coll. Cardiol. 66 (2015) 816–828.
[53]R. Fernández-Jiménez, J. Sánchez-González, J. Agüero, J. García-Prieto, G.J. López-Martín, J.M. García-Ruiz, A. Molina-Iracheta, X. Rosselló, L. Fernández-Friera, G. Pizarro, A. García-Álvarez, E. Dall'Armellina, C. Macaya, R.P. Choudhury, V. Fuster, B. Ibáñez, Myocardial edema after ischemia/reperfusion is not stable and follows a bimodal pattern: imaging and histological tissue characterization, J. Am. Coll. Cardiol. 65 (2015) 315–323.
[54] P. Pelosi, P.R. Rocco, D. Negrini, A. Passi, The extracellular matrix of the lung and its role in edema formation, An. Acad. Bras. Cienc. 79 (2007) 285–297.
[55] D. Negrini, A. Passi, A. Moriondo, The role of proteoglycans in pulmonary edema de-velopment, Intensive Care Med. 34 (2008) 610–618.
[56] A. Kidambi, A.N. Mather, P. Swoboda, M. Motwani, T.A. Fairbairn, J.P. Greenwood, S. Plein, Relationship between myocardial edema and regional myocardial function after reperfused acute myocardial infarction: an MR imaging study, Radiology 267 (2013) 701–708.
[57]R. Schubring, Characterizing protein changes caused by application of high hydro-static pressure on muscle food by means of DSC, J. Therm. Anal. Calorim. 82 (2005) 229–237.
[58] B. Lopez, A. Gonzalez, N. Hermida, F. Valencia, E. de Teresa, J. Diez, Role of lysyl ox-idase in myocardial fibrosis: from basic science to clinical aspects, Am. J. Physiol. Heart Circ. Physiol. 299 (2010) H1–H9.
[59] C. Petibois, G. Gouspillou, K. Wehbe, J.P. Delage, G. Deleris, Analysis of type I and IV collagens by FT-IR spectroscopy and imaging for a molecular investigation of skele-tal muscle connective tissue, Anal. Bioanal. Chem. 386 (2006) 1961–1966.
[60]T. Kishimoto, Y. Morihara, M. Osanai, S. Ogata, M. Kamitakahara, C. Ohtsuki, M. Tanihara, Synthesis of polyHyp-Gly)(n) by direct poly-condensation of (Pro-Hyp-Gly)(n), where n = 1, 5, and 10, and stability of the triple-helical structure, Biopolymers 79 (2005) 163–172.
[61]F. Bonnier, S. Rubin, L. Debelle, L. Venteo, M. Pluot, B. Baehrel, M. Manfait, G.D. Sockalingum, FTIR protein secondary structure analysis of human ascending aortic tissues, J. Biophotonics 1 (2008) 204–214.
[62] T.T. Yang, S.F. Weng, N. Zheng, Q.H. Pan, H.L. Cao, L. Liu, H.D. Zhang, W. Mu da, His-topathology mapping of biochemical changes in myocardial infarction by Fourier transform infrared spectral imaging, Forensic Sci. Int. 207 (2011) e34–e39.