fTPI UNIVERSITEDE
t£l SHERBROOKE
Faculte de genie
Department de genie civil
Effets de la composition et des parametres
de melange sur la performance des betons
autoplacants utilises pour la prefabrication
d'elements precontracts
(Effects of Mix Design and Parameters on
Performance of Self-Consolidating Concrete Used
in Precast, Prestressed Applications)
Memoire de maftrise es sciences appliquees
Specialite: genie civil
Jury:
Kamal H. Khayat
Radhouane Masmoudi
Patrick Paultre
Guillaume LEMIEUX
Sherbrooke (Quebec), Canada Mars 2008
1*1
Library and Archives Canada Published Heritage Branch 395 Wellington Street Ottawa ON K1A0N4 Canada Bibliotheque et Archives Canada Direction du Patrimoine de I'edition 395, rue Wellington Ottawa ON K1A0N4 CanadaYour file Votre reference ISBN: 978-0-494-37901-1 Our file Notre reference ISBN: 978-0-494-37901-1
NOTICE:
The author has granted a non-exclusive license allowing Library and Archives Canada to reproduce, publish, archive, preserve, conserve, communicate to the public by
telecommunication or on the Internet, loan, distribute and sell theses
worldwide, for commercial or non-commercial purposes, in microform, paper, electronic and/or any other formats.
AVIS:
L'auteur a accorde une licence non exclusive permettant a la Bibliotheque et Archives Canada de reproduire, publier, archiver,
sauvegarder, conserver, transmettre au public par telecommunication ou par I'lnternet, prefer, distribuer et vendre des theses partout dans le monde, a des fins commerciales ou autres, sur support microforme, papier, electronique et/ou autres formats.
The author retains copyright ownership and moral rights in this thesis. Neither the thesis nor substantial extracts from it may be printed or otherwise reproduced without the author's permission.
L'auteur conserve la propriete du droit d'auteur et des droits moraux qui protege cette these. Ni la these ni des extraits substantiels de celle-ci ne doivent etre imprimes ou autrement reproduits sans son autorisation.
In compliance with the Canadian Privacy Act some supporting forms may have been removed from this thesis.
While these forms may be included in the document page count,
their removal does not represent any loss of content from the thesis.
• * •
Canada
Conformement a la loi canadienne sur la protection de la vie privee, quelques formulaires secondaires ont ete enleves de cette these.
Bien que ces formulaires aient inclus dans la pagination, il n'y aura aucun contenu manquant.
AKNOWLEDGEMENTS
The author has been working on the evaluation of the influence of mixture constituents and raw material characteristics and performance of self-consolidating concrete used in precast for prestressed applications. The author would like to thank Professor Kamal Henri Khayat for his trust, his support and his motivation during this project. The author is also grateful to Prof. Khayat to give him the opportunity to work with Dr. Soo-Duck Hwang, Dr. Hoi-Keun Lee, Mr. Wu Jian Long and, Dr. Ammar Yahia and all other students and researchers who have participated in the NCHRP "Dream Team".
The author would also like to thank Prof. Richard Gagne, Prof. Arezki Tagnit-Hamou, and all the research assistants and graduate students of the Cement and Concrete Research Group. Special thanks to Dr. Olivier Bonneau for his friendship and his support during the author's studies and for the organization of CNCCC 2006. The author is also thankful to Dr. Ahmed El-Sayed for his patience and his meticulous comments on the text of this thesis. The author realizes that all the works he accomplished would not be achieved without the continuous support of the technicians in the group: Claude, Denis, Ghislaine, Jean-Yves, Rajko, and Sylvain.
The author would like to thank the Natural Sciences and Engineering Research Council of Canada (NSERC), le Fond Quebecois de la Recherche sur la Nature et les Technologies (FQRNT), Transports Quebec, and ACI local chapter for their financial support during his graduate studies.
Finally, the author wishes to dedicate his thesis to his family and friends. The author can hardly find the appropriate words to express his gratitude for their dedication, encouragement, and authenticity.
TABLE OF CONTENTS
1. Introduction 3
1.1 Precast, Prestressed Concrete 3 1.1.1 History of Precast, Prestressed Concrete 3
1.1.2 Prestressing Methods 3 1.1.3 Advantages of Prestressed Concrete 4
1.2 Using SCC in Precast, Prestressed Industries 4
1.3 Benefits of Using SCC 4
1.4 Objectives 5 1.5 Structure of the Thesis 5
2. SCC and precast, prestressed industries 8
2.1 Type of Elements Built in Precast Industry 8 2.2 Advantages of Using SCC in Precast, Prestressed Market 9
2.3 Case Studies of SCC in Precast, Prestressed Applications 10 2.3.1 SCC Prestressed T-girders for the Higashi-Oozu Viaduct in Japan 11
2.3.2 SCC Implementation in Brazilian Precast Industries 12 2.3.3 Implementation of SCC in Double Cycling Production of Double Tee Beams in the
United States of America 14 2.3.4 High-Early Strength SCC Used for the Construction of 171 Prestressed Girders in
Indianapolis 15 2.3.5 Economical Analysis of Building Components Made with SCC and Normal
Concrete 16 2.3.6 Applicability of SCC for Fabrication of Box andl-Beams 17
2.4 Mixtures Design Used in Precast, Prestressed Industry 19 2.5 Research Needed for Successful Implementation of SCC in Precast, Prestressed
Industry 20
3. Literature Review on SCC Technology 22
3.1 Workability of SCC 22 3.1.1 Definitions 22 3.1.2 Test Methods to Evaluate Workability of SCC 25
3.2Rheology 36 3.2.1 Definitions 36 3.2.2 Classification of Liquids 36 3.2.3 Rheology of SCC 40 3.2.3 Stability of SCC 40 3.3 Performance of SCC 42 3.3.1 Homogeneity 42 3.3.2 Bond Strength 43 3.3.3 Top-bar Effect 44 3.4 Material Considerations for Proportioning SCC for Precast, Prestressed Applications. 47
3.4.2 Aggregate Type and Combination 48
3.4.3 Chemical Admixtures 49 3.4 Materials Considerations for Proportioning SCC for Precast, Prestressed Applications48
3.4.1 Binder Type and Content 49 3.4.2 Aggregate Type and Combination 49
3.4.3 Chemical Admixtures 50
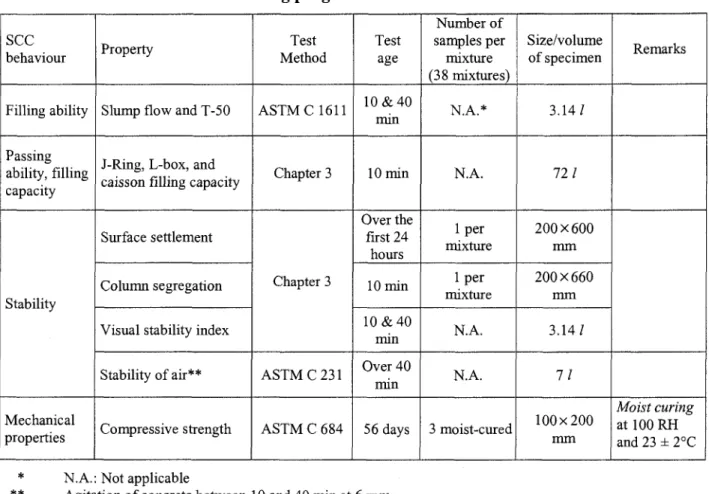
4. Experimental Program 50
4.1 Methodology 50 4.1.1 Phase I - Test Methods and Acceptance Criteria for SCC 50
4.1.2 Phase II - Effect of Mixture Proportioning and Material Characteristics on Key
Parameters Affecting Fresh Properties of SCC 53 4.1.3 Phase III - Validation of Workability and Acceptance Criteria for SCC 54
4.2 Materials 58 4.2.1 Cement and Supplementary Cementitious Materials 58
4.2.2 Aggregates 59 4.2.3 Chemical Admixtures 64
4.3 Mixture Proportioning 64 4.3.1 Mixture Proportioning in Phase 1 64
4.3.2 Mixture Proportioning in Phase II 73 4.3.3 Mixture Proportioning in Phase III 77
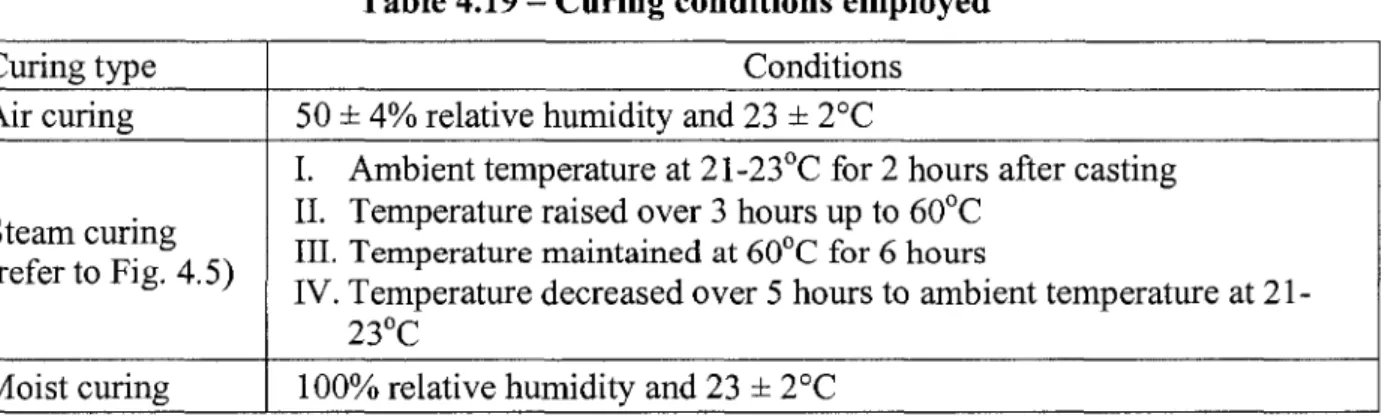
4.4 Mixing Sequence 80 4.5 Curing Method 80
5. Effects of Mixture Constituents on Workability and Compressive Strength of S C C . 82
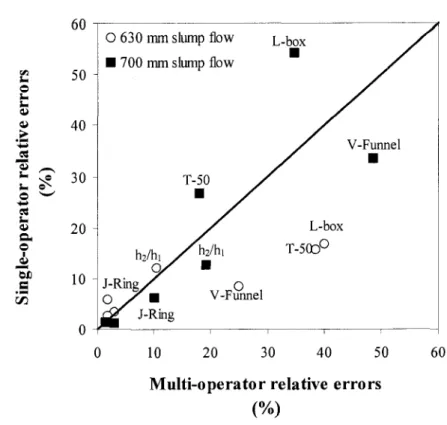
5.1 Scope of the Work 82 5.2 Repeatability of SCC Test Methods 82
5.2.1 Evaluation of Repeatability by Single-Operator 83 5.2.2 Evaluation of Repeatability by Multi-Operator 84
5.4 Fresh Properties of SCC 89 5.4.1 Filling Ability 90 5.4.2 Passing Ability 93 5.4.3 Filling Capacity 99 5.4.4 Stability 102 5.5 Mechanical Properties of Hardened SCC 110
5.5.1 Compressive Strength at 18 hours 110 5.5.2 Compressive Strength at 56 days 115 5.6 Recommendations for Proportioning SCC 120
6. Correlations among Various SCC Workability Responses 126
6.1 Scope of the work 126 6.2 Comparison of Passing Ability and Caisson Filling Capacity Responses 126
6.3 Combined Test Methods to Evaluate Restricted Deformability 129
6.4 Assessment of Static Stability 134 6.5 Recommended Test Methods and Limit Values for Workability of SCC Used in Precast,
7. Effect of Mixture Combinations on Workability and Compressive Strength of SCC141
7.1 Scope of the Work 141 7.2 Factorial Design Approach 141
7.3 Effect of Mixture Parameters on Fresh Properties 142 7.4 Exploitation of Statistical Models for Workability Responses 146
7.5 Effect of Mixture Parameters on Mechanical Properties 151 7.6 Exploitation of Statistical Models for Mechanical Properties 152 7.6 Mixture Combinations Recommended to Assure Adequate Workability and Strength
Development of SCC Used in Precast, Prestressed Applications 154
8. Validation and Mixture Recommendations 159
8.1 Scope of the Work 159 8.2 Validation of the Statistical Models 160
8.3 Bond Strength of Prestressing Strand Embedded in Wall Elements Cast with SCC... 165
8.3.1 In-place Compressive Strength 166 8.3.2 Pull-out Bond Strength and Top-Bar Effect 169
8.4 Assessment of the Homogeneity of Wall Element Cast with SCC of Different Stability
Levels 172 8.4.1 Relationship between Static Stability and In-place Compressive Strength 173
8.4.2 Image analysis approach 175 8.4.3 Electrical Conductivity Method 175
8.5 Conclusions 177
9. General Conclusions 178
9.1 Objectives and Overall Conclusions 178 9.2 Recommendations for Future Research 180
REFERENCES 182 APPENDIX A 187 APPENDIX B 188 APPENDIX C 199 APPENDIX D 209 APPENDIX E 222
LIST OF TABLES
CHAPTER 2
Table 2 . 1 - Mixture proportioning used for casting main girders of the Higashi-Oozu Viaduct
[Ouchi et al., 2003] 11 Table 2.2 - Result of quality control of SCC [Ouchi et al., 2003] 12
Table 2.3 - Comparison of cost performance between SCC and conventional concrete [Ouchi
e t a l , 2003] 12 Table 2.4 - Production costs in company A [Tutikian et al., 2005] 13
Table 2.5 - Production costs in company B [Tutikian et al., 2005] 13 Table 2.6 - Comparison between mixture composition of SCC and conventional mix [Hughes
etal., 2002] 15 Table 2.7 - Mix composition of concrete [Naito and Hoover, 2005] 18
Table 2.8 - Plastic materials properties [Naito and Hoover, 2005] 18 Table 2.9 - Requirements for air entrainment [Texas State DOT, 2004] 19 Table 2.10 - Mixture characteristics for structural concrete [ville de Montreal, 2005;
Transport Quebec, 2005; Khayat, 2005] 20
CHAPTER 3
Table 3.1 - Workability properties of SCC and test methods [Hwang, 2006] 25
Table 3.2 - Visual stability index (VSI) rating [Daczko et al., 2001] 33 Table 3.3 - Definition of stability indices [Khayat et al., 2003a] 34 Table 3.4 - Estimation of typical SCC properties in defferent countries [Wallevik, 2006].... 40
Table 3.5 - Fresh Properties of the four concrete mixtures [Hwang, 2006] 46
CHAPTER 4
Table 4.1 - Parametric experimental program of Phase 1 51 Table 4.2 - Testing program of mixtures selected in Phase 1 52 Table 4.3 - Factorial experimental program in Phase II 54 Table 4.4 - Mixtures selected for validation program in Phase III 55
Table 4.5 - Testing program for validation in Phase III 56 Table 4.6 - Selection of SCC and HPC mixtures for strand bond test 57
Table 4.7 - Testing program of mixtures selected in Phase III for wall experiment 58 Table 4.8 - Physical properties and chemical composition of cement, fly ash, and
blast-furnace slag 59 Table 4.9 - Grain-size distribution and properties of coarse aggregate and sand 60
Table 4.10- Mixture proportioning of SCC made with crushed aggregate with MSA of 19 mm 66 Table 4.11 - Mixture proportioning of SCC made with crushed aggregate with MSA 9.5 mm
67 Table 4.12 - Mixture proportioning of SCC made with crushed aggregate with MSA of 12.5
mm 68 Table 4.13 - Mixture proportioning of SCC made with rounded aggregate with MSA of 12.5
Table 4.14 - Mixture proportioning of SCC made with air entrainment and crushed aggregate
with MSA of 12.5 mm 70 Table 4.15- Mixture proportioning of SCC mixtures with low filling ability and high risk of
segregation 71 Table 4.16 - Mixture proportioning of SCC mixtures used in repeatability evaluation 72
Table 4.17 - Mixture proportioning of SCC investigated in Phase II 74 Table 4.18 - Mixture proportioning of SCC investigated in Phase III 78
Table 4.19 - Curing conditions employed 80
CHAPTER 5
Table 5.1 - Single-operator workability repeatability tests for 38-MS-C12.5 mixture with 700
+ 10 mm slump flow 85 Table 5.2 - Single-operator workability repeatability tests for 38-MS-C12.5 mixture with 630
± 10 mm slump flow 86 Table 5.3 - Multi-operator workability repeatability results for 38-MS-C12.5 SCC with 700 ±
10 mm slump flow 87 Table 5.4 - Multi-operator workability repeatability results for 38-MS-C12.5 SCC with 630 ±
10 mm slump flow 87 Table 5.5 - Summary of relative error for recommended workability test methods 89
Table 5.6 - Test methods used to evaluate workability characteristics of SCC 89
Table 5.7 - Relative performance levels of SCC mixtures of Phase 1 120 Table 5.8 - Workability responses and recommendations for proportioning SCC for
precast/prestressed applications 124 Table 5.9 - Mechanical properties responses and recommendations for proportioning of SCC
for precast/prestressed applications 125
CHAPTER 6
Table 6.1 - Combined test methods and recommended workability values for SCC used in
precast, prestressed applications 139
CHAPTER 7
Table 7.1 -Absolute and coded values of modeled parameters 142
Table 7.2 - Repeatability of test results 142 Table 7 . 3 - Parameter estimates of derived models for fresh properties, 143
Table 7.3 (cont'd)- Parameter estimates of derived models for fresh properties, 144 Table 7.4 - Parameters estimate of derived models for mechanical properties 152 Table 7.5 - Relative significance of modeled mixture parameters on key workability and
strength responses of SCC used in precast, prestressed applications 156 Table 7.6 - Mixture combinations recommended to secure workability limits and compressive
strengths of SCC for precast, prestressed applications 157
CHAPTER 8
Table 8.1 - Mean and relative errors of central point at 90% confidence limit 160
Table 8.2 - Selection of SCC and HPC mixtures for strand bond test 165
Table 8.3 - Fresh properties of wall elements 166 Table 8.4-In-place compressive strength at 56 days of age 167
Table 8.5 - Bond strength values of prestressing strands at 56 days of age 171
Table 8.6 - Static stability test results for wall elements 173 CHAPTER 9
Table 9.1 - Test methods and recommendations for fabrication of precast, prestressed
elements 179 Table 9.2 - Summary of recommended values to elaborate proper mix design for precast,
LIST OF FIGURES
CHAPTER 1
Figure 1.1 - Structure of the thesis 7
CHAPTER 2
Figure 2 . 1 - Standard structural shapes [Sheppard and Philips, 1989] 8 Figure 2.2 - Casting process improvements [Ramsburg et al., 2005] 14 Figure 2.3 - SCC and typical concrete agregate gradation [Hughes et al., 2002] 16
Figure 2.4 - Economical comparison between vibrated concrete and SCC [Uebachs et al.,
2005] 17
CHAPTER 3
Figure 3.1 - Mechanism of blocking [Takada and Tangtermsirikul, 2000] 23
Figure 3.2 - P h o t o of slump flow test 26 Figure 3.3 - Schematic of L-box apparatus [Petersson et al., 1996] 26
Figure 3 . 4 - Schematic of U-box apparatus [Erkmen et al., 2005] 27
Figure 3.5 - Photos of J-Ring test [Bartos, 1998] 28 Figure 3.6 - Photo of V-funnel test [Swedish Concrete Association, 2002] 29
Figure 3.7-Photo of Orimet test [Bartos, 1998] 29 Figure 3.8 - Filling capacity (caisson) test [Yurugi et al., 1993] 30
Figure 3.9 - Surface settlement test [Khayat, 1999] 32 Figure 3 . 1 0 - Photo of column segregation test [Assaad et al., 2004] 32
Figure 3.11 - Schematic of IBB rheometer 35 Figure 3.12 - Geometry of the vane used to determine the rheological flow curves of SCC.. 35
Figure 3.13 - Rheological curves obtained with Hershel-Bulkley model [Ferraris, 1999] 38
Figure 3 . 1 4 - Hysteresis loop curve of a thixotropic material [Wallevik, 2006] 39 Figure 3.15 - Flow curves of normal, high strength, self-consolidating concrete [Wallevik,
2006] 40 Figure 3.16 - "Workability box" relating column segregation and rheological parameters
[Assaad et al., 2004] 41 Figure 3.17 - Distribution of the ratio op place compressive strength at 28 days to control
strength determined from reference cylinders [Khayat et al., 2003b] 43 Figure 3.18 - Variations of normalized top-bar ratio of prestressing strands at 28 days [Khayat
etal., 2003b] 44 Figure 3.19 - Variations of top-bar effect with maximum settlement [Hwang, 2006] 47
CHAPTER 4
Figure 4.1 - Mixtures proportion for validation program in Phase III 55
Figure 4.2 - Schematic of two combined wall elements 57 Figure 4.3 - Particle-size distribution of sand and coarse aggregate 61
Figure 4.4 - Particle-size distribution of combined aggregate retained on various sieve
openings 63 Figure 4.5 - Steam curing regime 81
CHAPTER 5
Figure 5.1 - Comparison of relative errors at two levels of slump flow consistency 88 Figure 5.2 - Comparison of relative errors with single- and multi-operators testing methods 88
Figure 5.3 - Effect of MSA and binder type on HRWRA demand of SCC 91
Figure 5.4 - Effect of coarse aggregate on HRWRA demand 92 Figure 5.5 - Effect of air entrainment on slump flow consistency and HRWRA demand 93
Figure 5.6 - Effect of MSA and binder type on J-Ringflow 95 Figure 5.7 - Effect of MSA and binder type on L-box blocking ratio 96
Figure 5.8 -Effect of air entrainment on J-Ring flow 97 Figure 5.9 - Effect of air entrainment on L-box blocking ratio 97
Figure 5.10 - Effect of fluidity level (low, medium, and high) on J-Ring flow 98
Figure 5.11 - Effect of fluidity level on L-box blocking ratio 99 Figure 5.12 - Effect of MSA and binder type on filling capacity 100 Figure 5.13 - Effect of coarse aggregate type on filling capacity 101 Figure 5.14 - Effect of air entrainment on filling capacity 102 Figure 5.15 - Effect of MSA and binder type on stability of air in SCC made with 0.38 w/cm
103 Figure 5.16 - Effect of coarse aggregate type on stability of air in SCC made with 0.33 w/cm
104
Figure 5.17 - Effect of binder type and MSA on maximum surface settlement 105
Figure 5.18 - Effect of binder type and MSA on segregation index 106 Figure 5.19 - Effect of coarse aggregate type on maximum settlement for SCC made 108
Figure 5.20 - Effect of coarse aggregate type on segregation index for SCC made 109
Figure 5.21 - Effect of fluidity level on maximum surface settlement 109
Figure 5.22 - Effect of fluidity level on segregation index 110 Figure 5.23 - Effect of binder type and MSA on 18-hour compressive strength of air-cured
and steam-cured concrete 112 Figure 5.24 - Effect of aggregate type on 18-hour compressive strength of air-cured and
steam-cured concrete 113 Figure 5.25 - Effect of air entrainment on 18-hour compressive strength of air-cured and
steam-cured concrete 114 Figure 5.26 - Effect of fluidity level on 18-hour compressive strength of air-cured and
steam-cured concrete 115 Figure 5.27 - Effect of MSA and binder type on 56-day compressive strength of moist-cured
concrete 116 Figure 5.28 - Effect of aggregate type on 56-day compressive strength of moist-cured
concrete 118 Figure 5.29 - Effect of air entrainment on 56-day compressive strength of moist-cured
concrete 119 Figure 5.30 - Effect of fluidity level on 56-day compressive strength of moist-cured concrete
119
CHAPTER 6
Figure 6.1 - Variations of filling capacity with slump flow measured at 10 minutes 131 Figure 6.2 - Relationship between filling capacity and J-Ring flow measured at 10 minutes
Figure 6.3 - Relationship between filling capacity and spread between slump flow and J-Ring
flow measured at 10 minutes 132 Figure 6.4 - Variations of filling capacity with L-box blocking ratio (fe/hi) 133
Figure 6.5 - "Workability box" for filling capacity as a function of L-box blocking ratio and
slump flow 134 Figure 6.6 - Recommended lower limits of slump flow and spread between slump flow and
J-Ring flow values of SC made with crushed aggregate to secure filling capacity greater than
80% 134 Figure 6.7- Contour diagrams between filling capacity, slump flow, and L-box blocking ratio
determined at 10 minutes (R2=0.82) (Eq. 6.1) 136
Figure 6.8 - Contour diagrams between filling capacity, slump flow, and J-Ring flow
determined at 10 minutes (R2=0.83) (Eq. 6.2) 137
Figure 6.9 - Contour diagrams between filling capacity, slump flow, and (slump flow - J-Ring
flow) determined at 10 minutes (R2=0.80) (Eq. 6.3) 137
Figure 6.10 - Contour diagrams between filling capacity, J-Ring flow, and L-box blocking
ratio determined at 10 minutes (R2=0.85) (Eq. 6.4) 138
Figure 6.11 - Relationship between rate of settlement and maximum settlement 139 Figure 6.12 - Variation in column segregation index with rate of surface settlement 140 Figure 6.13 - Relationship between column segregation index (C.O.V.) and degree of
segregation 141 Figure 6.14 - Variations in the degree of segregation with rate of surface settlement 142
CHAPTER 7
Figure 7 . 1 - w/cm - binder content contour diagram of HRWRA demand (R2 = 0.96) 151 Figure 7.2 - w/cm - binder content contour diagram of J-Ring flow (R2 = 0.94) 152 Figure 7.3 - w/cm - binder content contour diagram of slump flow - J-Ring flow
(R2 = 0.94) 152
Figure 7.4 - w/cm - binder content contour diagram of L-box blocking ratio for S/A ratio of
0.46 (R2 = 0.94) 153
Figure 7.5 - w/cm - binder content contour diagram of filling capacity for Type MS cement
(R2 = 0.91) 154
Figure 7.6 - w/cm - binder content contour diagram of maximum surface settlement for S/A
0.46 (R2 = 0.86) 155
Figure 7.7 - w/cm - binder content contour diagram of column segregation for S/A of 0.54
(R2 = 0.88) 156
Figure 7.8 - w/cm - binder content contour diagram of plastic viscosity (R2 = 0.92) 157 Figure 7.9 - w/cm - S/A contour diagram of 18-hour compressive strength (R2 = 0.93) 159 Figure 7.10 - w/cm - binder content contour diagram of 56-day compressive strength 160
CHAPTER 8
Figure 8.1 - Comparison of predicted HRWRA demand to measured one 161 Figure 8.2 - Comparison of predicted J-Ring flow values to measured ones 161 Figure 8.3 - Comparison of predicted slump flow - J-Ring flow values to measured ones . 162
Figure 8.4 - Comparison of predicted L-box blocking ratio values to measured ones 162 Figure 8.5 - Comparison of predicted filling capacity values to measured ones 163 Figure 8.6 - Comparison of predicted surface settlement values to measured ones 163
Figure 8.7 - Comparison of predicted column segregation index to measured ones 164 Figure 8.8 - Comparison of predicted plastic viscosity values to measured ones 164 Figure 8.9 - Comparison of predicted 56-day compressive strength values to 165 Figure 8.10 - Distribution of in-place compressive strength at 56 days determined from core
samples 168 Figure 8 . 1 1 - Variations of relative in-place compressive strengths with height (core relative
to reference cylinder) 169 Figure 8.12 - Variations of relative in-place compressive strengths with height (core relative
to bottom layer core) 169 Figure 8.13 - Definition of pullout loads corresponding to bond strength comparisons 170
Figure 8.14 -Variations in bond strength at P3 load level 171 Figure 8.15 - Variations of normalized top-bar effect of prestressing strands at P3 load level
172 Figure 8.16 - Relationship between surface settlement results determined based on PVC
column and wall element 174 Figure 8.17 - Relationship between relative in-place compressive strength and maximum
surface settlement determined on PVC column 174 Figure 8.18 - Relationship between top-bar effect at P3 load level, maximum surface
settlement, and the segregation index from image analysis 175 Figure 8.19 - Correlation between the segregation index obtained from image analysis, the
segregation index (S.I) and the homogeneity index (H.I) obtained by electrical conductivity 176
CHAPTER 9
LIST OF ABBREVIATIONS
BAP: Beton autoplacant CC: Conventional concrete FA: Fly ash
HE: High-early strength
HESC: High-early strength concrete HPC: High performance concrete
HRWRA: High-range water reducing admixture MS: Moderate sulphate
MSA: Maximum size aggregate S/A: Sand-to-total aggregate ratio SCC: Self-consolidating concrete VMA: Viscosity modifying admixture VSI: Visual stability index
RESUME
La prefabrication des elements de beton est un domaine dans lequel la vitesse de production et la qualite du produit sont primordiales. Les developpements techniques et les methodes de production avec lesquels la qualite du produit est amelioree tout en reduisant la quantite de main-d'oeuvre necessaire sont alors devenus tres importants pour cette industrie. De plus, dans les elements prefabriques, la forte presence d'armatures de renforcement, des cables de precontrainte et des gaines de postcontrainte utilises pour la construction de ponts creent une congestion importante au niveau des coffrages. Le beton utilise pour ce type d'application doit etre tres fluide afin de pouvoir bien enrober ces renforcements, tendons et gaines de postcontrainte, et ce, sans toutefois creer de la segregation. Le developpement des betons autoplacant (BAP) devient done une alternative tres interessante pour les prefabriquants.
Le BAP est un beton tres maniable qui peut facilement s'ecouler au travers d'elements fortement armes ou ayant une geometrie tres complexe sans qu'il y ait du ressuage ou de la segregation. Cependant, 1'absence d'etudes specifiques sur les BAP utilises dans ce domaine nuit grandement a 1'implantation de ce nouveau type de beton a hautes performances. De nouveaux essais de controle de la qualite ainsi que de nouvelles procedures d'essai doivent etre mis au point, doivent etre adoptes afin de caracteriser et de controler les proprietes autoplacantes de ce materiau.
Le programme experimental qui a ete entrepris au cours de cette etude avait objectifs suivants :
• Evaluer l'effet de la taille du granulat, le type de granulat, le type de liant, le rapport eau/liant sur la maniabilite ainsi que sur le developpement des resistances en compression des BAP;
• Evaluer, a l'aide de plan d'experimentation factoriel l'impact de la variation des caracteristiques et du dosage des divers materiaux utilises pour la fabrication des BAP;
• Comparer la performance des divers essais de maniabilite et suggerer des criteres de performances;
• Evaluer la validite des valeurs cibles couramment employees pour les essais de controle de la qualite du BAP par rapport aux performances structurales obtenues sur des murs experimentaux.
A la suite de cette etude, les resultats ont demontre qu'une combinaison adequate d'essais permet d'evaluer la stabilite dynamique des BAP en usine. De plus, une methode simplifiee de calcul du degre de segregation permet d'evaluer de facon plus rapide la stabilite statique de ce type de beton.
L'utilisation du plan d'experimentation factoriel 25 4 a permis d'elaborer des modeles statistiques permettant de predire les proprietes a l'etat frais et les resistances en compression apres 18 heures de cure a la vapeur et a 56 jours de BAP fait avec divers dosages en liant, rapport eau/liant, dosage en agent de viscosite, types de liant et ratio sable/agregats.
Finalement, a la suite d'essais d'arrachement de torons d'acier dans des murs experimentaux de beton, il fut demontre que les murs faits avec des BAP possedent une adherence et une uniformite similaire, voire meme superieures, a un murs fait a 1'aide d'un beton haute performance consolide a l'aide de vibration interne.
1. Introduction
1.1 Precast, Prestressed Concrete
1.1.1 History of Precast, Prestressed Concrete
Prestressed concrete is a relatively new material. In fact, this technology has been used since about 50 years by using high strength steel to realize sustainable prestressing. At the beginning, prestressed has been used with mild steel. After a certain while, the prestress has almost totally disappeared. At this period, people were unable to explain this loss of prestressing in steel, which is due to relaxation of steel.
Prestressed concrete is considered as a French invention resulting from Eugene Freyssinet works. Freyssinet has been the first to explain the cause of the loss of prestress and suggested the use of high strength steel. The use of that kind of steel does not reduce losses but, the effective steel stresses after losses and relaxation can stay sufficiently high [Picard, 2001].
1.1.2 Prestressing Methods
Prestressed concrete may be obtained in two different ways [Sheppard and Philips, 1989]. These ways are pretensioning and posttensioning.
• Pretensioning: Strands are stressed before the concrete is poured and hardened around them. When the concrete has reached a sufficiently high compressive strength to withstand the force imposed by the strand force (also called release strength), the strands are cut and the prestessing force is transfered into the member. This is the method used to produce precast prestressed concrete member.
• Posttensioning: The concrete element is cast with conduit or ducts sufficiently large to receive bundles of strand, wires, or high-strength rods, which are called tendons. The tendons are stressed after the concrete has reached sufficient strength to withstand the force imposed by the tendons. Posttensioning is usually done with cast-in-place concrete at the job site.
1.1.3 Advantages of Prestressed Concrete
According to Picard [2001], the main advantages of using prestressed structures are durability, economy, lightness, rigidity, and good control of deformability. Well-constructed and well-designed prestressed concrete structures show better durability than other concrete structures. This is due to low level of cracking. As a result, the stiffness of the structure is better than other reinforced concrete structures. From an economical point of view, prestressed concrete structure need less amounts of concrete and steel than other concrete structural system to resist the same loads. Thus, elements are smaller and consequently, lighter. Even if the size of elements is reduced, the rigidity of the prestressed element is higher than conventional reinforced ones. Also, and by adjusting a proper eccentricity of prestressing, it is possible to control deformability.
1.2 Using SCC in Precast, Prestressed Industries
SCC has grown dramatically in worldwide usage, from inception in Japan through rapid acceptance in Europe. North American precast, prestressed concrete producers are converting to SCC in order to speed production, reduce labour costs, and generate parts with higher quality, bug-hole free form finishes. SCC is recommended for over 40% of all non-DOT precast, prestressed concrete cast in North America [Benedict and Worsfold, 2005].
1.3 Benefits of Using SCC
As mentioned earlier, implementation of SCC offers many advantages in terms of quality, productivity and durability. This can also lead to additional benefits [Khayat, 1998]:
• Economical benefits: less intensive construction activities resulting in labour savings, time savings due to higher rate of production, possibility of using cast-in-place versus precast construction for certain applications.
• Technological benefits: better filling of formwork with difficult access, use of vibration free concrete in urban areas to reduce noise, avoid vibration in areas sensitive to vibration, etc.
1.4 Objectives
The aim of the proposed research is to contribute to wider acceptance of SCC in the construction of precast, prestressed concrete bridge elements. The main objectives are as follows:
• to develop SCC that can be produced consistently in the field and in precast plant;
• to qualify practical test methods capable of identifying key workability properties of SCC (deformability, passing ability, filling capacity, and stability) for mix design purposes in the laboratory;
• to assess the use of these tests for quality control and compliance in precasting plant;
• to develop performance-based specifications including criteria for specifications and compliance testing of SCC for precast, prestressed bridge elements;
• to determine the influence of key parameters affecting structural performance of SCC, including raw materials, mixture proportioning, mixing, production, placement, and characteristics of the cast elements; and
• to compare performance of effective SCC mixtures suitable for casting bridge prestressed structural elements with those of conventional high-performance concrete typically used in the fabrication of precast, prestressed concrete elements.
1.5 Structure of the Thesis
As shown in Figure 1.1, the thesis is divided into 8 chapters. Chapter 1 briefly describes precast and prestressed industries as well as the advantages of SCC. Chapter 2 presents a review of precast, prestressed concrete and presents some successful implementation of SCC in precast, prestressed applications. Chapter 3 reviews SCC testing methods, performance, and materials used in SCC technology. Chapter 4 describes the scope of experimental program, including material and mixture parameters evaluated in this study.
Chapter 5 presents the effects of mixture constituents on workability and compressive strength development of SCC. Limit values and recommendations relevant to mixture constituents are also presentend in this chapter. Chapter 6 presents different correlations among various workability responses for SCC quality control. Chapter 7 discusses the effects of combination of five different mixture parameters on workability and strength development of SCC. Recommended values for these parameters and validations of these results are also presented. A large-scale testing of the homogeneity of bond to prestressing strands along wall elements cast with various SCC mixtures of different stability levels is discussed in chapter 8.
Finally, chapter 9 summarizes the main parameters affecting workability of SCC used in precast, prestressed applications and makes recommendations for the test methods and mix design considerations to achieve proper workability and strength development of SCC for precast, prestressed constructions.
This research project has been conducted in concordance with National Cooperative Research Program (NCHRP) about Self-consolidating concrete for precast, prestressed bridge elements (Project 18-12).
STRUCTURE OF THE THESIS
2. SCC and precast, prestressed industries
2.1 Type of Elements Built in Precast Industry
Certain standard precast and prestressed concrete structural shapes are made by precast concrete manufacturers. These components are used together to form structures which fall into two general categories (Sheppard and Philips, 1989):
1. Frame structures, 2. Shear wall structures.
Various combinations of these systems form subcategories that allow the architect to optimize the function of the building and at the same to minimize the architectural constraints imposed by the structural lateral force resistance of the building. Figure 2.1 shows the basic standard structural shapes to build structures in precast concrete. Whenever possible, the designer should attempt to use the standard shapes and sizes available in the region of the jobsite. The resulting savings in mold costs will reduce the final product costs.
Approximate size ranges
Width Depth Span
Double T Single T 4-12 ft 10-41 in 30-90 ft ? * -6-12 ft 16-48 in 30-110 ft Channel slat) Flat slab 3-12 ft 24-42 in 40-90 ft -Vs -^ 8-12 ft 3-6 in 14-22 ft (35 ft with shoring) }Q O O O O O O O 0 O oLS 3 ft 4 in-8 ft 6-12 in 16-42 ft Hollow-core plank Rectangular girder & 12-36 in 18-48 in 24-70 ft
Approximate size ranges
Width Depth Span
Inverted-T girder [ T,
6
Ledger beam j_ p Column [ Bearing pile [ j€>
<?
C^
s^
12-24 in 12-30 in 10-24 in 12-24 in 4-8 ft 18-48 in 18-48 in 12-24 in 12-24 in 10-16 in 24-^8 ft 24-48 ftFigure 2.1 (cont'd) - Standard structural shapes [Sheppard and Philips, 1989]
2.2 Advantages of Using SCC in Precast, Prestressed Market
Many benefits can be anticipated by implementations of SCC in precast industry. The ability of SCC to flow under its own weight (without vibration) without creating blockage, coupled with the absence of the noise associated with vibration, has led to a new atmosphere of production opportunities for the SCC precast, prestressed industry [Khayat, 2005]:
• Greater flexibility to produce a wide variety of architectural finishes;
• Increased assembly rates and reduction in the use of labour for vibration and finishing; and
• Improved working environment:
- reduced noise levels at the manufacturing plant;
- reduced hazards associated with the need for workmen to walk on top of the form; and
• Lower capital investment costs and longer service life of the formwork elements;
• Improved surface quality with greater uniformity and fewer surface imperfections requiring repair.
The total time for the production process can be shortened, although care must be taken during placement that the concrete be given sufficient time to de-aerate. Measures for distributing and smoothing the concrete are very largely reduced, and production time is determined essentially by the rate of delivery of the fresh concrete. The higher early strength of SCC permits more rapid prestressing and de-molding of prestressed concrete elements, which increases productivity.
Personnels are no longer needed for mechanical compaction of the plastic concrete and there is saving in the associated expenditure. Due to absence of external vibrators, there is virtually no noise nuisance during production and there is an improvement in working conditions. No capital investment is required for the vibration equipment and the formwork can be lighter construction. Its service life is increased, as there are no dynamic stresses involved.
SCC virtually permits the production of any cross-sectional shape and allows difficult concreting sections with very high percentage of reinforcement and bottlenecks at built-in fitting to be completely filled with concrete. Edges and corners of precast elements can be well shaped and with fewer tendencies to bleeding at the joints in the formwork. As a whole, the surface is smoother, with more uniform coloration than with normal concrete, making SCC particularly suitable for fair-faced concrete.
2.3 Case Studies of SCC in Precast, Prestressed Applications
During last 10 years, SCC has been used in several precast applications. In many countries,
SCC is expected to gradually replace most of the ordinary concrete currently produced as the construction industry strives to increase competitiveness and reduce environmental impact. This is especially the case for precast industry in Netherlands, Sweden, Denmark, Germany,
and France. In Sweden, a certain number of bridges have been successfully cast using SCC and excellent results of strength and durability are reported [Skarendahl, 1998].
The following section presents few case studies to highlight successful applications of SCC in the precast, prestressed market and to illustrate some of the benefits.
2.3.1 SCC Prestressed T-girders for the Higashi-Oozu Viaduct in Japan
Precast, prestressed T-girders were used as main girders of the Higashi-Oozu Viaduct [Ouchi et al., 2003]. In the beginning of the fabrication, the conventional concrete with slump of 80 mm was planned. However, it was found that conventional concrete was not capable of forming suitable surfaces of the girder because of the large girder dimensions. Complaints due to noise and heavy vibration were raised from neighbours of the plant. Therefore, SCC was chosen to fabricate the girders. Table 2.1 presents mixture proportioning used for this application.
Table 2.1- Mixture proportioning used for casting main girders of the Higashi-Oozu Viaduct [Ouchi et al., 2003]
W/B <%) 30.5 F/B (%) 20 Unit weight ( Water 175 Binder Cement 457 Fly Ash 118 kg/m3) Fine Aggregate 840 Coarse aggregate 744 HRWRA demand 1.0
Table 2.2 shows results of quality control of the SCC. Results of fresh concrete and compressive strength are almost stable, and they satisfied the target values.
From an economical point of view, the authors reported that overall costs of girders made with SCC are approximately 7% lower than those made with vibrated concrete having 80 mm of slump. Expenses for trial mixes and making specimen are not included in the SCC cost. Table 2.3 presents a summary of the costs of the two types of concrete. Costs are compared in term of percentage.
Table 2.2 - Result of quality control of SCC [Ouchi et al., 2003] Target Values Number of Data Mean Value Maximum Value Minimum Value Standard deviation
Fresh Concrete Test Slump Flow (mm) 650 39 665 695 620 20 VType Funnel (sec) 12 39 12.1 14.0 9.0 1.5 Air Content (%) 2.0 39 1.8 2.5 1.2 0.3
Compressive Strength (Mpa) At Stripping 30MPa or more 39 41.2 54.2 33.5 5.5 At the Age of 1 Day 19 39.7 44.5 33.5 2.7 7 days 28 days 50 Mpa or more 35 52.4 69.5 58.0 3.0 34 71.0 80.5 64.9 4.7
Table 2.3 - Comparison of cost performance between SCC and conventional concrete [Ouchi et al., 2003] Material Labor Total Conventional concrete 100 100 100 SCC 104.1 67.2 92.5
2.3.2 SCC Implementation in Brazilian Precast Industries
A comparison of production costs using conventional concrete (CC) and SCC was carried out for two precast industries. In the first company (A), the compressive strength of the concrete was 30 MPa, and the slump was 60 mm. The second company (B) had a conventional concrete with compressive strength of 60 MPa and the same workability of the first company. Tables 2.4 and 2.5 present the cost of the two options of using CC or SCC. Costs are indicated in Brazil Reais.
Table 2.4 - Production costs in company A [Tutikian et al., 2005]
COMPANY 'A'
Concrete
Concrete mixing Concrete Transportation Demoiding agent: application Placement Finishing Repairs TOTAL € € Labour 0 1 1 3 5 4 '1 £3i%^%~i
Costs (ES/ m3] Labour
142.46 3,43 15,49 10,66 26,70 7,03 14.55 21tf,8» 0 1 1 3 2 7 0 Costs (RS/ m3) 177,29 3,43 15,49 10.66 5.34 1,41 0,00 210,19
Table 2.5 - Production costs in company B [Tutikian et al., 2005]
EMPRESA 'B'
Concrete
Concrete mixing Concrete Transportation Demoiding agent application Placement Finishing Repairs TOTAL
cc
L a b o u r 0 2 2 2 9 5 3 Costs (BSJ ms) 715,23 6,86 20.46 5,81 47,78 8,78 21,58 819,34sec
Labour 0 2 2 2 4 7 0 Costs (RS/ m3> 805,15 6,86 20,16 5,81 9,56 1,76 0,00 842,43As shown in both tables, the use of SCC significantly reduced placement, finishing, and repair costs. The authors also reported that labour reduction was another benefit of SCC implementation. Seven and eleven workers were reduced in companies A and B, respectively [Tutikian e t a l , 2005].
2.3.3 Implementation of SCC in Double Cycling Production of Double Tee Beams in the United States of America
The need to increase the productivity of existing precast production shop led few precast plants to use SCC for the production of double tee beams. The SCC mixtures needed to achieve 25 MPa (3500 psi) at six to seven hours, and 50 MPa (7000 psi) at 28 days. Steam-curing with maximum concrete temperature of 71 °C (160 °F) is typically used to achieve the targeted six to seven hours compressive strength.
The authors reported that a total of 474 kg of cementitious materials with 20% slag replacement was optimum for early strength gain in precast shop environment. The slump flow value targeted was 610 to 660 mm, at a 0.36 w/cm. Inverted slump flow, J-Ring, column segregation method, and Visual Stability Index test methods were used to qualify SCC mixtures [Ramsburg et al., 2005].
Figure 2.2 shows improvement in the casting process because of using SCC instead of conventional concrete for the production of double tee beams.
Minutes QConvensional Concrete •SCC
<r ^
^ ^ # VFigure 2.2 - Casting process improvements [Ramsburg et al., 2005]
The total of individual function in the production of one double tees with conventional concrete was 53.5 minutes. On the other hand, the same product could be cast with a total of 33 minutes of labour by using SCC. Both the time to cast one bed of multiple members and
the total man hours to cast this product was cut in half when using SCC [Ramsburg et al., 2005].
Finally, the incorporation of SCC in precat plants was found to [Ramsburg et al., 2005]: 1. Improve the appearance of the final product.
2. Improve the general safety of Double Tee beam production.
3. Provide adequate early strength for double cycling prestressed product. 4. Produce durable hardened concrete.
2.3.4 High-Early Strength SCC Used for the Construction of 171 Prestressed Girders in Indianapolis
In one of the first large-scale SCC applications in North America, girders were cast for an express transit "People Mover" system in Indianapolis, IN. The 2.5 km elevated structure contains 171 curved and straight precast spans, with an average span length of 24.3 m [Hughes et al., 2002].
In this project, 600 to 700 mm slump flow was required to ensure adequate consolidation with
w/cm of 0.38. ASTM C 150 Type III cement was used to generate release strength of 34.5
MPa in 12 hours. Table 2.6 presents a comparison between typical mix proportion of conventional mix and SCC used in precast, prestressed applications.
Table 2.6 - Comparison between mixture composition of SCC and conventional mix [Hughes et al., 2002] Mortar Fraction {%) Fine to Coarse Aggregate Ratio Volume©* Water to Volume of CementiOous Materia) Ratio Water to CermmtWous Material Ratio Conventional Mix S5-- 6© &M-0MQ 1.20-1,30 O.37-0.40 SCC Mix 60-07 0.50-0.57 1.00-1.16 0.37-0.41
Authors also reported the important role of aggregate grading in production of SCC. Based on the experience gained, an optimized SCC grading curve was developed. This curve is presented in Fig. 2.3. T**^*^*s*!^jz**iv^. 33»* »** UH liM 5 * * H ^ v^ f ¥ *' *-f *** 4? #* < / ^f *
Figure 2.3 - SCC and typical concrete agregate gradation [Hughes et al., 2002]
Figure 2.3 also indicates a typical US fine and coarse aggregate grading curve. According to Hughes and al. (2002), a number of problems can be anticipated with this grading:
1. Segregation due to lack of intermediate size aggregates to help suspend larger particles in the matrix,
2. Blocking of aggregates behind reinforcement due to higher proportion of top size stone,
3. Increased paste (cementitious) content required to compensate for poor packing density.
2.3.5 Economical Analysis of Building Components Made with SCC and Normal Concrete
Uebachs et al. (2005) analysed the economical aspects of SCC produced by precast plant of 100 building components. The case study showed that the production costs slightly increase to a maximum of 3 % when a powder type-SCC is applied instead of a vibrated concrete of the same strength, as shown in Fig. 2.4.
Typical Gap — Graded ! • Aggregate People Mover Project SCC mix grading
Beam T-Seam Column Foundation Slab • Personnel Costs Reinf. g Material Costs Reinf. D E n 0 r9V Costs • Personnel Costs • Material Costs
C55/B7 P-TypB C5S67 P-Type C5SS? F-Type C55#67 P-Type C55/67 P-Type
Figure 2.4 - Economical comparison between vibrated concrete and SCC [Uebachs et al., 2005]
In general, the personnel costs seem to be significantly reduced when SCC is used. In the other hand, a significant increase of the material costs, up to 18% in the case of slab, was observed for the use of SCC in comparison with normal concrete. The costs of building components requiring more manpower for the casting process, as in the case of columns, could even be reduced. However, the authors reported that the entire rationalizing potential can be used only when a precast element plant is completely readjusted.
2.3.6 Applicability of SCC for Fabrication of Box and l-Beams
SCC and conventional high-early strength concrete (HESC) were compared through an extensive series of plastic and hardened material tests, and through the examination of full-scale SCC and HESC bulb tee beams. Mixture compositions and test performed to assess workability of plastic concrete are shown in Tables 2.7 and 2.8, respectively.
Table 2.7 - Mix composition of concrete [Naito and Hoover, 2005] Material. Type (per yd3)
Cement (Type 3 & Slag) [lb] Slag Cement [%]
Coarse Aggregate by Volume [%] Water / Cement Ratio
High Range Water Reducer [oz] Viscosity Modifying Admixtee [oz]
HE&C 750 34% 39 0.34 60.0 0 0 \ ^ w -849 25% 34 0.32 136.2 16.0
Table 2.8 - Plastic materials properties [Naito and Hoover, 2005] Material
# of Batches Sampled Avg. Unit Weight [lb/ft3] Air Content [%]
Skimp / Spread [in.]
Spread reduction J-Ring [%] Visual Stability Index
HESC 4 149.8 5.4 6.3 N.A. N.A.
sec
5 148.8 5.0 21.3 6.5% 0 to 0.5In addition to direct benefits to I-beam and box beam fabrication, Naito and Hoover (2005) reported that SCC could provide other benefits. The high flow characteristics allow enhanced placement around congested reinforcement, thus allowing for the potential of using thinner sections and reduction in weight. In combination with reactive pozzolans, SCC could provide the ability to reduce w/cm even further, thus allowing the production of highly flowable concrete with low w/cm, higher strength, and better durability characteristics.
Naito and Hoover (2005) also reported that SCC had the potential to remove one of the biggest production-related roadblocks to widespread use of modified density concretes in prestressed girders. In particular, the elimination of high intensity vibration, which aggravates segregation in lightweight aggregates, will no longer be an issue. Lower densities have the potential to significantly reduce weight without impacting structural performance thus increasing the span range for prestressed girders.
2.4 Mixtures Design Used in Precast, Prestressed Industry
According to the AASHTO LRFD Bridge Design and Construction, the mixture proportion selected for the construction of bridge elements shall be sufficiently workable and easy to finish for the intended use and shall conform to the mixture requirements. For prestressed concrete and bridge decks, the specified compressive strength at 28 days shall not be less than 27.6 MPa. Consideration should be given to limiting the nominal aggregate size to 19 mm for prestressed members. In Quebec, due to climatic conditions, high performance concrete (HPC) is generally used to achieve higher durability of the structural elements. Table 2.10 summarizes the main mixture characteristics that are recommended by ville de Montreal, Transports Quebec, and various State Departments of Transportations (DOTs) for concrete used for the construction of precast prestressed structures.
Texas DOT Specifications [2004] recommend all concretes, except for low strength concrete, be air-entrained in accordance with Table 2.9, unless otherwise shown on the plans. The specifications recommended the use of moderate exposures values unless otherwise specified. If the air content is more than 1.5% and 3% above the required air, the load of concrete will be rejected. If the air content is more than 1.5% but less than 3% points above the required air, the concrete may be accepted based on strength test.
Table 2.9 - Requirements for air entrainment [Texas State DOT, 2004]
MSA 9.5 mm 12.5 mm 19 mm 25 mm 38 mm 50 mm Air volume (%)* Moderate Exposure 6% 5.5% 5% 4.5% 4.5% 4% Severe Exposure 7.5% 7% 6% 6% 5.5% 5%
Table 2.10 - Mixture characteristics for structural concrete [ville de Montreal, 2005; Transport Quebec, 2005; Khayat, 2005]
Mixture characteristics Structural elements w/cm Binder content Binder type Air content Slump (mm) 28-day design strength Min. 28-day compressive strength MSA (mm) Ville de Montreal Structural concrete <0.37 > 360 kg/m3 GUb-F/SF, GUb-S/SF, orMH 4 - 7% 140 - 220 N.S. > 50 MPa 14 mm Transports Quebec Prestressed girder 0.35 or 0.37 >410 kg/m3 GUb-SF 5 - 8% 180 ±40 N.S. 50 MPa or 60 MPa 14 mm Texas State DOT Precast, prestressed concrete beams, box girders <0.45 <415 kg/m3 Type III cement Refer to table 2.9 - 100 mm for design and placement - 165 mm for maximum acceptable placement - 230 mm with HRWRA As indicated on plans N.S. N.S. Florida State DOT Bridge deck <0.44 >365 kg/m3 N.S.* 1 - 6% - 75 mm - 180 mm when HRWRA is used 34.5 MPa N.S. N.S. New York State DOT General purpose structural concrete <0.46 360 kg/m3 Max. 20% replaced with fly ash
or slag 5 - 8% 65 - 90 mm 25 MPA . N.S. N.S. Washington State DOT Precast, prestressed girder N.A. >355 kg/m3 Type I or II cements Fly ash < 25% 4.5 - 7.5% N.S. N.S. N.S. 12.5 mm or 19 mm N.S.: Not specified
2.5 Research Needed for Successful Implementation of SCC in
Precast, Prestressed Industry
In spite of its benefits and widespread use in Japan and Europe, the use of SCC in North America has been limited because of concerns about certain design and construction issues
that are perceived to influence the structural integrity of concrete members. In general, there is uncertainty about the effects of SCC on design and construction in the following areas, which must be further addressed to permit wider acceptance of SCC in precast, prestressed market:
• Workability
• Strength development • Creep and shrinkage • Durability
• Constructability • Performance
In this thesis, workability, strength development, and performance of SCC in terms of homogeneity and bond strength were studied.
3. Literature Review on SCC Technology
3.1 Workability of SCC
3.1.1 Definitions
SCC is a new category of high-performance concrete that exhibits low resistance to undergo deformation and flow into place, even among closely-spaced obstacles, without segregation. The workability of concrete refers to the ease of mixing, placement, consolidation, and finishing of concrete. In SCC technology, it also refers to the flowing and filling properties of the concrete during placement. Workability of SCC is described in terms of filling ability, passing ability, and stability; these properties are characterized by specific testing methods. In general, the workability requirements of SCC are complex and depend on several parameters, including the type of construction, selected placement and consolidation methods, the complexity and shape of the formwork, the degree of congestion of the structural member, the intended placement method, labour skills, as well as quality assurance and quality control measures [Khayat, 1999].
Filling ability
The principal aim of the filling ability tests is to determine how far a fresh SCC mix would flow under its own weight, and how well it would fill formwork and spaces of varying degrees of complexity. In addition, it may be important, particularly for very large or complicated pours, to determine how fast the mix would flow [Bartos, 2005]. Many parameters can affect filling ability of SCC. In order to achieve good filling ability, the concrete must attain the following properties [Khayat 1999; Skarendahl and Peterson, 2001]:
• Small inter-particle friction: The friction between the various solid particles, which includes coarse aggregate, sand, and powder materials, must be reduce to make the concrete deform well. Friction between these particles increases the internal resistance to flow, thus limiting the deformability and the speed of deformability of the fresh concrete.
• Paste with excellent deformability: the cement paste has to deform well to achieve low yield value and moderate viscosity. A highly deformable cement paste will give the
SCC the ability to flow readily around various obstacles and achieve good filling capacity.
Passing ability
Passing ability determines how well a fresh SCC mix will flow through constricted spaces and between reinforcement. The aim of the test is to assess the level of risk that the coarse aggregate in the mix will become wedged between bars and form arches, which will partially or fully block or obstruct flow of the fresh mix [Bartos, 2005]. Takada et al. (2000) explained this arching mechanism by using an illustrative model of concrete flowing through an opening, as shown in Fig. 3.1.
7 v : . . ' • • ' . ' " . . Af|regale 1 mailing
•o c i ^ o o c^o* o* O o x 0*0*0*
O^^Q^^r——— . 0*\. O*
0 " 0 » r ;CF| o* ' 0 * 0 *
Figure 3.1 - Mechanism of blocking [Takada and Tangtermsirikul, 2000]
In order to achieve good passing ability, the concrete must attain the following properties [Khayat 1999; Skarendahl and Peterson, 2001]:
• Small aggregate size and low content: The arching is developed easier when the size of aggregate is large and also the content is high. This can be explained by the fact that aggregate particles around the opening have to change their flow path. As a result, collision among aggregate particles arises creating many instantaneous contacts among the particles at the vicinity of the opening. For smaller aggregate size, arching may occur when the aggregate content is high, however, arching may not occur when the particles are too small compared to the dimension of opening.
• Adequate cohesiveness of mortar: Cohesiveness of the mortar is achieved by reducing the water to powder ratio and/or incorporating an adequate dosage of viscosity modifying agent (VMA).
Resistance to segregation
The resistance to segregation, also known as stability, is defined as the ability of SCC to remain homogenous during transport, placing, and after placement [PCI Interim Guidelines, 2003]. There are two types of stability characteristics in SCC technology: dynamic and static stability. The dynamic stability refers to the resistance of concrete to the separation of the constituents during placement in the formwork [ACI Committee 237, 2005]. This characteristic of concrete is required to ensure uniform distribution of solid constituents upon transport and placement into the formwork [PCI Interim Guidelines, 2003]. Static stability refers to the resistance of the fresh concrete to segregation, bleeding, and surface settlement after casting while the concrete is still in plastic state [ACI Committee 237, 2005].
In order to ensure dynamic and static stability, SCC must attain the following properties [Khayat, 1999]:
• Small aggregate size and low volume of coarse aggregate. • High cohesiveness between the mortar and coarse aggregate.
• Low amount of free water in the mixture: this property can be achieved by using low water content and/or by using powder materials with high surface area in order to retain additional water onto the solid particle surface.
• High viscosity of the water: this property can be achieved by using VMA in SCC mixture.
It is important to note that a concrete mix is classified as SCC if the requirements of all three characteristics described above are fulfilled. In instances, where passing ability is not a concern, this parameter need not be addressed [PCI Interim Guidelines, 2003]. Also, these properties are not independent but rather interrelated and must be satisfied to achieve self-consolidation [Mayen, 2005].
3.1.2 Test Methods to Evaluate Workability of SCC
Many different test methods exist to assess workability of SCC. In general, these methods include the components required for evaluating simultaneously filling ability, passing ability, and stability. Hwang [2006] classified most of these test methods commonly used for the evaluation of workability of SCC as shown in Table 3.1. In this chapter, only the following test methods are elaborated: slump flow, T50, L-Box, U-Box, J-Ring, V-funnel, Orimet, filling capacity, GTM screen test, surface settlement, column segregation, visual stability index (VSI), and rheological parameters.
Table 3.1 - Workability properties of SCC and test methods [Hwang, 2006]
Filling ability Passing ability Filling capacity Segregation resistance Test method Slump flow T50 slump flow L-box, U-box, J-Ring V-funnel, Orimet Filling vessel (caisson) GTM screen test Surface settlement Column segregation Visual stability index Electrical conductivity Pressure bleeding Plunger penetration
Slump flow test
The slump flow is used to assess the horizontal free flow of SCC in the absence of obstruction [PCI Interim Guidelines, 2003]. The test is based on the test method for determining the slump of a normal concrete. The diameter of the concrete circle is a measure for the flowability of the SCC, as shown in Fig. 3.2. The time needed for the concrete to spread 50 cm is also noted.
Figure 3.2 - Photo of slump flow test
L-box test
The L-Box test consists of an L-shaped apparatus, as shown in Figure 3.3 [Petersson et al., 1996]. The vertical part of the box is filled with 12.7 L of concrete and left at rest for one minute. The gate separating the vertical and horizontal compartments is then lifted, and the concrete flows out through closely spaced reinforcing bars at the bottom. The time for the leading edge of the concrete to reach the end of 600 mm long horizontal section is noted. The heights of concrete remaining in the vertical section (Hi) and at the leaving edge (H2) are measured. The h2/hi value is calculated to evaluate the self-leveling characteristic of the concrete. The gate between the vertical and horizontal parts can be used with smooth bars with different diameters and spaced at different intervals. In accordance with normal reinforcement considerations, three times the maximum aggregate size might be appropriate [Hwang, 2006].
U-box text
The U-box test, also called the "box-shaped test", is used to measure the filling and the passing ability of SCC by assessing the height of the mixture on one side of the U (hi) to the height on the opposite side of the U (I12). Reinforcing bars with nominal diameter of 12.5 mm
(V2 in.) are installed at the gate with center-to-center spacing of 50 mm (2 in.). The left-hand
section is filled with about 20 liters of concrete and after one minute, the gate is lifted and concrete flows upwards into the other section (Figure 3.4).
iding door
4 o
1/2" d> rebars with 2" center4o-ceEiter spacing
5,5"" SJ'1-^
Figure 3.4 - Schematic of U-box apparatus [Erkmen et al., 2005]
J-Ring test
The J-Ring test can be used to assess the restricted deformability of SCC through closely spaced obstacles [Bartos, 1998]. The equipment consists of a rectangular section of 20 by 25 mm open steel circular ring with a 300 mm diameter, drilled vertically with holes to accept threaded sections of bars. These sections of bars can be with different diameters and spaced at different intervals. In accordance with normal reinforcement considerations, three times the maximum aggregate size might be appropriate [PCI Interim Guidelines, 2003].
The ring is positioned around the base of the slump cone, and the mean diameter of the spread concrete is determined (Figure 3.5). Also, this test can be used in conjunction with the Orimet
test or the V-funnel. These combinations test the flowing ability and the passing ability of the concrete [Khayat, 2005]. ""'• '• • v o E a a n r s t t . ' '•:.•• ii J30 aim W mm U,. d, Kvint'orvcmciri bars n*i hi Total spread — - * * +
"gHfr
'%Figure 3.5 - Photos of J-Ring test [Bartos, 1998]
V-funnel test
As shown in Figure 3.6, the equipment consists of a V-shaped funnel with an opening of 65 x 75 mm. This test is used to determine the filling ability of SCC with a maximum size aggregate of 20 mm [PCI Interim Guidelines, 2003]. The funnel is filled with about 12 litres of concrete, then after one minute, the gate is open and the time taken for concrete to flow through the apparatus is measured.
Figure 3.6 - Photo of V-funnel test [Swedish Concrete Association, 2002]
Orimet test
The Orimet test is based on the principle of an orifice rheometer. The Orimet consists of a vertical casting pipe fitted with a changeable inverted cone-shaped orifice at its lower discharge end with a quick-release trap door to close the orifice (Figure 3.7). Usually, the orifice has an 80 mm internal diameter which is appropriate for assessment of SCC mixes of aggregate size not exceeding 20 mm. Orifices of other sizes can be fitted instead.
The operation consists simply of filling the Orimet with concrete, then opening the trapdoor and measuring the time taken for light to appear at the bottom of the pipe [PCI Interim Guidelines, 2003].
Filling capacity test (caisson)
Also known as Kajima test, the filling capacity test is used to measure the filling ability of SCC with a maximum size aggregate of 20 mm. The filling vessel (caisson) test provides a small-scale model of a highly congested section and is suitable to evaluate the filling capacity and its self-consolidating characteristics [Ozawa et al., 1992; Yurugi et al, 1992].
The filling capacity can be determined by casting the concrete in a transparent box (caisson) measuring 300 x 500 x 300 mm containing closely-spaced smooth horizontal tubes of 16 mm in diameter (Figure 3.8) [Yurugi et al., 1993].The clear spacing among the tubes is 34 mm in both the horizontal and vertical directions. The concrete is introduced from a tremie pipe equipped with a hopper at a constant rate of approximately 20 L/min until the concrete reaches 220 mm from the bottom part of the box. Once the flow of the SCC among the bars ceases, the area occupied by the concrete in the restricted section is used to calculate the filling capacity. The maximum filling capacity is 100% when determined according to the ratio given in Figure 3.8.
The filling capacity test is difficult to perform on site due to complex structure of the apparatus and large weight of the concrete. However, it gives a good indication of the self-compacting characteristics of the concrete. Even a concrete mix with a high filling ability will perform poorly if the passing ability and segregation resistance are poor [Khayat, 2005].
Ax 100 Filling capacity = • Copper tube ($=16 mm) 220 x 350
o o O O O O Width =300 mm
150 mm 7x50 = 350 mm
GTM Screen Test
This test has been developed to assess segregation resistance (stability). It consists of taking a sample of 10 litres of concrete, allowing to stand for a period to allow any internal segregation to occur, then pouring half of it into a 5 mm sieve of 350 mm diameter, which stands on a sieve pan on a weight scale. After 2 minutes, the mortar that passed through the sieve is weighed, and expressed as a percentage of the weight of the original sample on the sieve. A percentage of mortar passing through the sieve should be 5% to 15% of the weight of the sample for the segregation resistance to be considered as satisfactory.
Although this test method is simple, it is not a rapid test and requires an accurate weigh-scale, so may not be suitable for site use. The repeatability of results may be questionable [PCI Interim Guidelines, 2003].
Surface settlement test
Surface settlement test method can be used to evaluate the surface settlement of SCC from a plastic state until the time of hardening [Manai, 1995]. It enables the quantification of the effect of mixture proportioning on static stability. A PVC column measuring 200 mm in diameter and 800 mm in height can be used (Figure 3.9). The settlement is monitored using a dial gauge with a 0.001 precision or a linear variable differential transformer (LVDT) with a minimum travel range of 50 mm, fixed on top of a 4 mm acrylic plate placed at the upper surface. The plate is anchored into a 600 mm high concrete column, and the settlement is monitored until steady state condition.
Column segregation
Column segregation test consists in casting concrete in a column measuring 660 mm in height and 200 mm in diameter, and then determining the variation in the relative concentration of coarse aggregate in four sections along the concrete sample [Assaad et al., 2004]. The PVC pipe is divided in four sections of 165 mm in height, as shown in Fig. 3.10. The column is filled with concrete which is compacted vertically five times with a 20 mm diameter steel bar. Then, the concrete is left 15 minutes before removing each section. From each section, the concrete is weighed and washed out on a 5 mm sieve to retain coarse aggregate. Then, the
![Table 2.3 - Comparison of cost performance between SCC and conventional concrete [Ouchi et al., 2003] Material Labor Total Conventional concrete 100 100 100 SCC 104.1 67.2 92.5](https://thumb-eu.123doks.com/thumbv2/123doknet/3074267.86843/26.926.155.786.148.455/table-comparison-performance-conventional-concrete-material-conventional-concrete.webp)
![Figure 3.17 - Distribution of the ratio op place compressive strength at 28 days to control strength determined from reference cylinders [Khayat et al., 2003b] 3.3.2 Bond Strength](https://thumb-eu.123doks.com/thumbv2/123doknet/3074267.86843/57.926.194.753.448.742/distribution-compressive-strength-strength-determined-reference-cylinders-strength.webp)
![Figure 3.18 - Variations of normalized top-bar ratio of prestressing strands at 28 days [Khayat et al., 2003b]](https://thumb-eu.123doks.com/thumbv2/123doknet/3074267.86843/58.928.196.753.621.974/figure-variations-normalized-ratio-prestressing-strands-days-khayat.webp)
![Table 3.5 - Fresh Properties of the four concrete mixtures [Hwang, 2006] Fresh properties](https://thumb-eu.123doks.com/thumbv2/123doknet/3074267.86843/60.926.132.814.296.823/table-fresh-properties-concrete-mixtures-hwang-fresh-properties.webp)