Comparison of Pinning Voltage Estimation Methods in Pinned Photodiode CMOS Image Sensors
Texte intégral
Figure
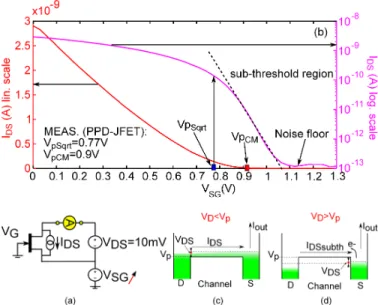
![Fig. 5. (a) Equivalent circuit of the test set-up used in the Sqrt. method [12]. (b) Square root of the drain to source current (I DS ) as a function of the gate to source biasing voltage V SG measured on a PPD-JFET structure (square root characteristic)](https://thumb-eu.123doks.com/thumbv2/123doknet/3116285.88512/5.918.150.377.81.470/equivalent-circuit-current-function-voltage-measured-structure-characteristic.webp)
![Fig. 8. (a) Equivalent circuit of the test set-up for the floating source (FS) extraction method discussed in [14]](https://thumb-eu.123doks.com/thumbv2/123doknet/3116285.88512/6.918.75.449.371.579/fig-equivalent-circuit-floating-source-extraction-method-discussed.webp)
Documents relatifs
Comme la m´ ethode num´ erique exploite ces estimations, il suffira de coupler ` a ces es- timations les deux techniques propos´ ees pour produire op´ erationnellement la
L’objectif principal de ce chapitre est l’étude de l’impact de la taille de pores sur la colonisation microbienne des électrodes et la production de courant
On the suction side, URANS predicts the same transition process than on the pressure side: first a periodic transition induced by incoming wakes before to reach a
For every case, it is observed that the air content measured in hardened conditions is always lower than what is measured in fresh condition. For OPC system, the difference
Again in the limit of large inertia ratios, LSA predicts existence of two unstable oscillating modes which are nothing but those associated with the linear wake instability past a
In this paper, we present globally adaptive control variate, a numerical integration method based on control variate, targeting arbitrary scalar or vector-valued integrands
chemical results of milk analysis from three dairy farms, located in the surrounding of Algiers area (Algiers, Blida and Tipaza) show a significant effect (p < 0.05) of the
For the receiver located before the beginning the structure (Figure 5.12a), two groups of waves travelling at different velocities are visible between 50-100 Hz and above 150
