O
pen
A
rchive
T
oulouse
A
rchive
O
uverte
(OATAO)
OATAO is an open access repository that collects the work of some Toulouse researchers and makes it freely available over the web where possible.
This is
an author'sversion published in: https://oatao.univ-toulouse.fr/23808
Official URL :
https://doi.org/10.1504/IJEX.2017.086169To cite this version :
Any correspondence concerning this service should be sent to the repository administrator:
Gourmelon, Stéphane and Théry Hétreux, Raphaële and Floquet, Pascal A systematic approach: combining process optimisation exergy analysis and energy recovery for a better efficiency of industrial processes. (2017) International Journal of Exergy, 23 (4). 298-329. ISSN 1742-8297
OATAO
A systematic approach: combining process
optimisation exergy analysis and energy recovery
for a better efficiency of industrial processes
Stéphane Gourmelon,
Raphaële Théry-Hétreux* and Pascal Floquet
Laboratoire de Génie Chimique, Université de Toulouse,
CNRS, INPT, UPS, Toulouse, France Email: [email protected] Email: [email protected]
Email: [email protected] *Corresponding author
Abstract: Exergy analysis has been shown to be a powerful tool for assessing and improving the energy efficiency of thermal and chemical processes. However, the lack of systematic procedures in examining and interpreting the results of the exergy balance or the exergy efficiency makes this kind of analysis more or less limited to the academic world. This paper intends to promote an efficient energy usage through pinch, exergy analyses and energetic optimisation and by providing the engineer with specific improvement means by using a case-based reasoning (CBR) system. To make exergy analysis more understandable, it was decided to develop two methodological tools: a supporting graphical representation of the exergy analysis and a CBR system to help the user in developing alternatives. Both tools are grouped together into a general methodology for the analysis and retrofit design of industrial sites. This new approach is illustrated through an ammonia processing plant case study. Keywords: exergy analysis; process retrofitting; ternary exergy diagram; CBR; case-based reasoning; optimisation.
Reference to this paper should be made as follows: Gourmelon, S., Théry-Hétreux, R. and Floquet, P. (2017) ‘A systematic approach: combining process optimisation exergy analysis and energy recovery for a better efficiency of industrial processes’, Int. J. Exergy, Vol. 23, No. 4, pp.298–329.
Biographical notes: Stéphane Gourmelon is graduate from Toulouse Chemical Engineering School in 2012 (ENSIACET), he has prepared a PhD Thesis in the Laboratory of Chemical Engineering (LGC UMR5503 CNRS/INPT/UPS, Toulouse) from 2012 to 2015. His topic concerned exergy analysis of process and its implementation on a process simulation software. Currently, he is process engineer in Air Liquide Company.
Raphaële Théry-Hétreux is graduate from Toulouse Chemical Engineering School in 1999 (ENSIGC). She is an Assistant Professor at the National Polytechnic Institute of Toulouse – National School of Engineers in Chemical and Technological Arts (ENSIACET), member of the Laboratory of Chemical Engineering (LGC UMR5503 CNRS/INPT/UPS, Toulouse) in the field of
Process System Engineering. She has obtained her PhD in 2002. She has been a lecturer since 2006 and her research activities currently concern energy planning process integration, pinch analysis and exergy analysis. In addition, she is in charge of the courses given to engineering students at ENSIACET in the same field.
Pascal Floquet is Professor since 2001 at the National Polytechnic Institute of Toulouse – National School of Engineers in Chemical and Technological Arts (ENSIACET), member of the Laboratory of Chemical Engineering (LGC UMR5503 CNRS/INPT/UPS, Toulouse) in the field of Process System Engineering. His oldest research activities relate to mathematical programming in process engineering (Implementation of ‘Branch & Bound’ and ‘Lagrangian augmented’ procedures, applied to ‘classical’ processes problems involving a set separator reactors and recycling). His more recent work deals with less deterministic procedures, such as combinatorial optimisation methods (simulated annealing, genetic algorithm, …) and the use of concepts of fuzzy logic in process design in order to better take into account uncertainties about the data and the subjective nature of human reasoning.
1 Introduction
Tackling climate change and reducing greenhouses gas emissions, which are largely attributable to human activity, represent one of the biggest challenges for humanity in the coming years. In such a context, the promotion of best practices to enable the efficient utilisation of energy has emerged as one of the major points of focus. The high volatility of energy prices and the increasingly stringent environmental regulations have forced industrials to improve their processes continuously, in order to reduce energy consumption and GHG emissions.
For this purpose, industries need tools to perform energy audits on facilities, to ease decision making and to enable them to develop their energy efficiency solutions on their sites. In recent papers (Gourmelon et al., 2015), the fundamental calculation tools dedicated to the formulation of exergy balances and the evaluation of exergy efficiency of unit operation has been introduced but no systematic approach was introduced to fill the gap between the exergy balances display and the retrofit proposals. In this context, this study aims to introduce a new combined pinch and exergy-based systematic procedure for analysing and improving existing industrial processes from an energy viewpoint. The structure of the proposed method is relatively straightforward; however, it relies on original tools and approaches, such as a new graphical representation of the exergy balance and a case-based reasoning (CBR) system helping engineers to identify an energy efficiency solution. It should be highlighted that to help the engineer to select the best solution, an economic analysis should be performed. However, this contribution rather develops the approach for proposing structural and parametric modifications of existing processes and does not deal with economic aspects.
The first part of this paper is dedicated to the methodology employed. Each step is detailed, and the new tools are introduced. In the second part, the proposed methodology is illustrated through the example of an ammonia processing plant.
2 The COOPERE methodology
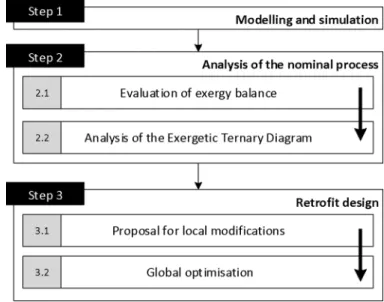
As shown in Figure 1, our methodology, which essentially relies on the use of a process simulation software such as ProsimPlus® developed by Prosim S.A. is broken down into
three main steps: a first step for modelling and simulating the nominal process, followed by an analysis step. Finally, the methodology is concluded by a retrofit design step.
Figure 1 General presentation of the methodology
2.1 Step 1: Modelling and simulation
As mentioned above, the first step of the proposed methodology consists of modelling and simulating the industrial site as close as possible to the real conditions. To do so, as mentioned by the ADEME – the French Environment and Energy Management Agency – data collection represents the starting point of any approach that aims to improve the energy efficiency of a process (ADEME, 2014). This is a prerequisite for an accurate energetic optimisation; erroneous information on process parameters will systematically lead to incorrect improvement proposals. These data relate to flow rates, temperatures, pressures, etc., and enable a simulation model to be validated. Challenges in data extraction have already been discussed by Gundersen (2013).
Then, the collected data may be exploited to implement a model of the industrial process within process simulation software. In this methodology, the steady-state process simulation software ProsimPlus® has been selected. This simulation environment
commercialised by Prosim S.A. has features for automatic stream data extraction on the basis of a converged steady-state mass and energy balance calculation.
2.2 Step 2: Analysis of the nominal process
The second step consists of an in-depth analysis of the nominal process using an exergy analysis methodology. As attested by the numerous publications reported by Luis
Modelling and simulation
Evaluation of exergy balance
Analysis of the Exergetic Ternary Diagram
Proposal for local modifications
(Luis, 2013; Luis and Van Der Bruggen, 2014; Tesch et al., 2016), exergy analysis has been shown to be a powerful tool for assessing and improving the energy efficiency of thermal and chemical processes. As described by Petrakopoulou et al. (2012), both conventional and advanced exergy analysis rely on computing the exergy balance, but also on the calculation of exergetic indicators such as the exergy efficiency. However, as noted by Asprion et al. (2011) the cumbersome calculations make this kind of analysis more or less limited to the academic world. To overcome this problem, a complete exergy analysis tool has already been implemented and is available within the ProSimPlus®
thermodynamic server Simulis Thermodynamics®. As stated by Gourmelon et al. (2015), this generic exergy formulations is valid for each physical phase and whatever the chosen approach for phase equilibria modelling (homogeneous or heterogeneous approach). Moreover, as SimulisThermodynamics is embedded in ProSimPlus, it is possible to carry out exergy balance and exergy efficiency calculations for the whole process. In that way, exergy balances become as simple and automatic to perform as for enthalpy balances. The defaults assumption for process state, environmental state and standard dead state in the process simulator are as follows:
• Process state: The process state refers to the initial state of the system under
study (T, P, z).
• Environmental state: The restricted equilibrium refers to a state where the conditions
of mechanical and thermal equilibrium between the system and the environment are satisfied. It requires the pressure and the temperature of the system and environment to be equal. The state that satisfies the condition of restricted equilibrium with the environment will be referred as the environmental state (T00, P00, z).
• Standard dead state: In the unrestricted equilibrium not only pressure and
temperature but also the chemical potentials of the substances of the system and environment must be equal to satisfy the conditions of full thermodynamic equilibrium between the system and the environment. Under these conditions, the value of exergy of the system is zero because the system cannot undergo any changes of state through any form of interaction with the environment. This state of the system is called the standard dead state (T00, P00, z00).
However, to make the analysis ProSimPlus offers the possibility to modify the temperature of the environmental state T00.
Moreover, a barrier that keeps process engineers from using exergy analysis is their inability to interpret results from exergy calculations. This represents the major bottleneck for a widespread use of such a methodology. To help the engineer to define the units of a process that should be first regarded as a source for improvement, it is convenient to draw graphics such as pie charts, bar charts or even Grassmann diagrams (Kotas, 1985). However, the latter do not allow the amount of exergy lost/destroyed and the exergy efficiency of each unit to be represented in the same chart. To make exergy analysis more understandable and to overcome some of the difficulties in industrial applications, it was decided to develop a supporting graphical representation of exergy analysis. After a brief review of exergy analysis, a new graphical representation is introduced.
2.2.1 Exergy concept
The exergy of a system (B) is defined by Szargut et al. (1988) as the maximum amount of work that can be obtained by bringing it to equilibrium with the reference environment. Like energy, there are three kinds of exergy support: material streams, heat streams and work streams (Dincer and Rosen, 2007).
• Material streams
Neglecting the kinetic and potential parts, the exergy of a material stream may be defined as the sum of thermal (∆T), mechanical (∆P) and chemical (ch) exergies, as expressed in equation (1). Both terms can be computed as proposed by Gourmelon et al. (2015). • Work streams
The work stream can be computed according to equation (2) (Dincer and Rosen, 2007). • Heat streams
A computer-aided exergy analysis for energy diagnosis purpose requires a modelling as close to reality as possible, i.e., modelling utility stream as material stream and not only as isothermal heat flux. For example, the calorie supply to the process should be represented as a HP steam flux.
material
T P ch
B =B∆ +B∆ +B (1)
work
B =W (2)
Using these equations, the exergy balance of any system can be computed. Different to mass or energy balances that follow the law of conservation, an exergy balance contains a term I, representing the thermodynamic imperfection, also known as internal losses or the irreversibility of the system (Tsatsaronis, 2007). Moreover, to refine the exergy balance, Gong and Wall (2003) proposed making a distinction between waste and utilised streams. The exergy balance is then rewritten as equation (3). Waste streams are streams that are directly released to the environment without specific use. Bin, Boututilised,
waste out
B and I,
respectively, represent the exergy input, utilised exergy output, external exergy losses and internal exergy losses.
utilised waste in out out
B =B +B +I (3)
The simple efficiency, which is defined as the ratio of all exergy output to all exergy inputs is based upon this formulation. It is the easiest formulation to implement in a process simulator. However such a formulation may provide misleading results for some unit operation (Gourmelon, 2015; Gourmelon et al., 2015). The sensitivity of the simple efficiency reduces with increasing quantities of untransformed components, which makes this kind of efficiency unsuitable for accurate exergy analysis. To provide the user with a more meaningful efficiency in the simulator, a produced–consumed exergy efficiency has also been developed. To perform this evaluation, another way to express the exergy balance of any system is given by equation (4), where ∆Bconsumed is the amount of exergy
consumed by the system and ∆Bproduced is the amount of exergy produced.
waste consumed produced out
B B B I
Exergy analysis, which is based on the simultaneous use of the first and second laws of thermodynamics, has been shown to be a powerful tool for improving industrial processes, as it enables one to pinpoint thermodynamical imperfections and to compare different configurations.
Umeda proposed the heat availability diagram (Umeda et al., 1979). It is a graphical representation of exergy by plotting the Carnot efficiency against enthalpy. Exergy change is then represented by the area under the line and the x-axis. The irreversibility of a heat transfer is given by the area between the total hot curve and the total cold curve. Later, Linnhoff and Dhole (1992) renamed the heat availability diagram as the exergy composite curve (ECC). Analogous to the Pinch Technology, an exergy grand composite curve (EGCC) is proposed for low-temperature processes. This shows the amount of exergy lost, not by the heat transfer between hot and cold streams, but by heat transfer between process and utility streams. Although the introduction of the Carnot factor instead of the temperature in the y-axis provides a direct visualisation of the irreversibility, the methodology remains suitable only for heat transfer systems (not for chemical and pressure change processes).
Ishida et al. proposed the enthalpy-direction factor diagram (Ishida and Kawamura, 1982) later renamed as the energy utilisation diagram (EUD) (Ishida and Nakagawa, 1985). This diagram that is, in a way, an extended ECC, plots the energy level vs. the energy H. Contrary to the simple Carnot factor, the enthalpy level can be applied to all kinds of energy transformations including physical or chemical systems (Taprap and Ishida, 1996). The concept of exergy donors (sources) and exergy acceptors (sinks) were then developed to characterise streams or unit operations that must donate or accept energy at some energy level. Taprap and Ishida (1996) adopted the EUD for exergy analysis of a distillation column.
Later, Feng and Zhu (1997) a proposed a “combined pinch and exergy analysis” for process modifications. They presented the exergy–energy (Ω–H) diagram and generalised the ECC using the Ω factor, an energy level introduced by Ishida and Kawamura (1982) for steady-state flow processes.
For a single unit operation, the exergy–energy diagram proposed by Feng and Zhu (1997) is similar to the enthalpy–direction factor diagram introduced earlier by Ishida and Kawamura (1982). The energy level Ω is drawn on the y-axis while enthalpy is plotted on the x-axis. The major difference between the Ω–H diagram and the EUD diagram is that the latter plots the sources and sinks of all unit operation in a consecutive way, while the former does not consider unit operations, but a set of sources and a set of sinks for the overall process.
Feng and Zhu (1997) also proposed the idea of a multi-level exergy analysis, but using the concept of avoidable and unavoidable exergy losses. The first level is a basic exergy analysis indicating the global performance of a system and pinpointing inefficient processes. Then, major problems may be identified. Finally, the true potential of process improvement can be evaluated by making the distinction between avoidable and unavoidable exergy losses. This approach was then applied for energy optimisation of a steam power plant (Ataei, 2011) and for the retrofit of an olefin plant by Ataei (2011), Ataei and Yoo (2010) and Ghorbani et al. (2012) applied the use of an ECC for the optimisation of a refrigeration cycle in an NGL recovery plant.
Staine and Favrat (1996) established a new diagram representing irreversibility due to heat transfers as well as those caused by pressure changes and heat exchanger
manufacturing. They proposed to represent it in the Carnot factor vs. heat rate diagram. This approach is a kind of Pinch extension for environmental impact studies.
Homsak and Glavic (1996) proposed the temperature vs. power availability (i.e., exergy flow) diagram, in addition to the usual approach in the Pinch technology, to deal with a heat exchanger where both temperature and pressure are important. The presented methodology was applied on a simple evaporative process including two pressure exchangers (expander and compressor). However, this method did not deal with chemical changes.
More recently, Anantharaman (2006) modified and expanded the concept of the energy level introduced by Ishida and Kawamura (1982). They proposed a general methodology for the ELCC construction (Anantharaman, 2011). However, this methodology does not provide any recommendation for process integration and improvement: it is “an idea generator rather than a design generator” (Anantharaman, 2011; Aspelund et al., 2007) proposed the ExPAnD (extended pinch analysis and design) methodology. This methodology is particularly focused on pressure-based exergy and on systems that are sub-ambient in temperature. Although this methodology does not consider any chemical composition change, it provides some hints for improving the exergy efficiency of thermo-mechanical processes involving phase changes. Note that the objective of this approach was to reduce the work consumption in sub-ambient processes by transforming pressure-based exergy into temperature-based exergy. Both methodologies were applied to the LNG process.
Gundersen el al. (2009) extended Pinch analysis and process integration in order to consider pressure and fluid phase changes. Later, Marmolejo-Correa and Gundersen (2012) proposed a new diagram including a new parameter to represent the energy quality, called the exergetic temperature. The proposed methodology is particularly suitable for low-temperature systems.
Sahafzadeh et al. (2013) applied a combined pinch and exergy methodology for the integration of a gas turbine in an ammonia production plant.
There is no graphical way to represent all the aspects of an exergy balance of chemical processes. To overcome this issue, we propose a new kind of diagram based on equation (4).
2.2.2 A new graphical representation: exergetic ternary diagram
Three different indicators can be defined by rearranging equation (4), providing the engineer with an estimate of the general usage of the exergy consumed by the system:
waste produced out
consumed consumed consumed
1 B B I
B B B
∆
= + +
∆ ∆ ∆ (5)
First, the intrinsic efficiency (IE) (equation (6)) might be defined as the ratio of exergy produced to the exergy consumed. Analogously, the intrinsic waste (IW) and the intrinsic irreversibility (II) are defined according to equations (7) and (8), respectively.
produced consumed B IE B ∆ = ∆ (6)
waste out consumed B IW B = ∆ (7) consumed I II B = ∆ (8)
Rearranging equation (5) with (6)–(8), we finally obtain equation (9).
1
IE IW II+ + = (9)
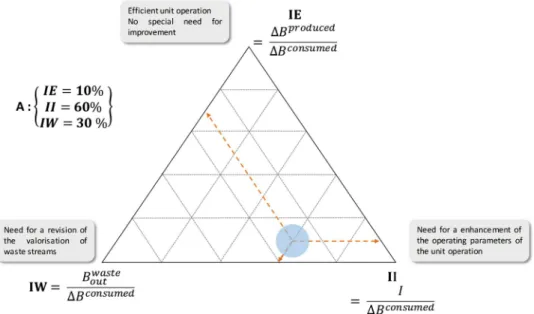
Consequently, each unit operation may be represented by a point located inside a ternary diagram. As an example, let us consider a unit operation represented by point A in Figure 2.
• The intrinsic efficiency (IE) of the unit operation is equal to 10%; this means that only 10% of the consumed exergy has been used to produce utilised exergy. • Its intrinsic irreversibility (II) is 60%: 60% of the consumed exergy is destroyed by
the unit operation.
• Finally, its intrinsic waste (IW) is 30%. This means that 30% of the consumed exergy is lost in waste streams.
The position of the point in the exergetic ternary diagram is a determining factor for the improvement of a unit operation. First, the engineer has to examine the position of the point referred to as the vertex IE. The closer it is to this vertex, the more efficient the unit operation. Consequently, the engineer would prefer first to improve unit operations located far from this vertex. Then, for these operations, the engineer would prefer for instance to modify the operating parameters to reduce internal losses (if the point is close to vertex II), or to recover a waste stream to decrease the amount of external losses (if the point is close to vertex IW).
Moreover, one has to consider the absolute value of the exergy loss. To that end, the point’s size is proportional to the amount of exergy losses in the unit operation. For instance, unit operation A has a greater exergy loss than point B. The use of such a graph will be illustrated through the case study.
However, although such a new kind of graph enables the emphasis to be placed on unit operations that should first be improved, and generally hints at the method of improvement (reducing internal losses or eliminating exergy waste), it does not provide the engineer with specific improvement means. To do so, a CBR system has been developed and is now presented.
2.3 Step 3: Retrofit design methodology
Relying on exergy analysis, the third and final step of the methodology consists of proposing more energy-efficient alternatives. However, apart from pinch analysis, which enables solutions to be proposed, no standard methods can be applied to suggest alternatives for improving processes from an exergy analysis (Taprap and Ishida, 1996). Exergy analysis simply enables us to quantify exergy losses in each unit operation, and to
compare different process configurations. To help the user in handling exergy data, some heuristics and general rules have been established (Feng and Zhu, 1997) without specific alternatives. To overcome this problem, De Jong et al. (1996) proposed combining AI techniques, and more precisely CBR systems, and exergy analysis to improve industrial processes. In the chemical engineering field, CBR systems have already been adopted for process designing (Ataei, 2011; Ataei and Yoo, 2010), separation process design (Ghorbani et al., 2012; Staine and Favrat, 1996), reactive distillation (Homsak and Glavic, 1996), mixing equipment selection (Anantharaman, 2011), process alternatives generation (Anantharaman et al., 2006) and more recently for cogeneration plant design (Aspelund et al., 2007; Gundersen et al., 2009).
Figure 2 Exergetic ternary diagram (see online version for colours)
In our proposed methodology, a CBR system is combined with Pinch analysis and process optimisation in order to propose more energy-efficient process alternatives. This methodology is subdivided into two steps: proposals for local modifications using a CBR system and proposals for global alternatives using process optimisation and pinch technology.
2.3.1 Step 3.1: Local modifications using a case-based reasoning system
CBR systems enable us to go further than rule-based systems (heuristics), as they do not rely on rules, but on experience (Ataei, 2011). They are based on the assumption that similar problems have similar solutions. Moreover, knowledge of heuristics can easily be included in a CBR system (Ghorbani et al., 2012). Included in an exergy analysis methodology, the CBR system can be used as an ‘idea generator’ for proposing processes.
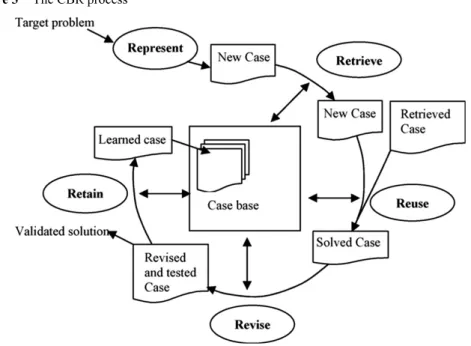
The CBR process cycle (Figure 3) consists of a five-step approach (R5 methodology):
Representation of the target problem, Retrieval of similar solved problems, Reuse of chosen solution, Revise and adaptation of the solution, and finally Retain the
{
IE
10%}
A: II= 60%
IW
=
30 %Efficient unit operation No special need for improvement IE l::.Bproduced t::.Bconsumed \ //\\, // )" \ : \ \_ .,/ \ .,/ ' \ /
Need for a revision of the valorisation of waste streams Bwaste IW
=
out t::.Bconsumed /'\\ // _..::\:::_--;/--+ \,,/ II INeed for a enhancement of the operating parameters of the unit operation
target problem with its validated solution (Marmolejo-Correa and Gundersen, 2012). Further details about the CBR approach are given elsewhere (Ataei, 2011; Homsak and Glavic, 1996; Anantharaman, 2011; Negny and Le Lann, 2008; Roldan-Reyes et al., 2004), Moreover, CBR systems can learn by acquiring new knowledge as cases and updating the information of the database, thus making maintenance easier (Staine and Favrat, 1996).
Figure 3 The CBR process
• Case representation
As mentioned above, the first step of a CBR approach consists of representing the problem. The main goal of case representation is to highlight its main characteristics and its associated solution. In the outlined approach, the problem is a unit operation or a set of units that might be constructed as a system generating required outputs for a given set of inputs. A material stream is defined by its common characteristic, i.e., temperature, pressure, flow rate, chemical composition, etc. In the context of an energy efficiency improvement, some data such as the exergies or the lower heating value (LHV) might be interesting to characterise a system. Each system is associated with one main function (e.g., reaction, separation, temperature change, pressure change and flow change) (Anantharaman, 2011) and with one or several technical functions ordered according to the flow path. A technical function denotes the objective of a given piece of equipment, for example, heat, cool, separate, divide, split or react. Lists of attributes of a problem are given in Tables 1–3. It is worth mentioning that the data required to define units and problems can easily be retrieved from a ProSimPlus®
simulation file. Target problem
'--..
G0
Validated solutior Revised and tested Casel
Table 1 List of attributes of problem description
Attributes Type
Main function Function
Technical functions List of technical functions
Inputs Set of material streams
Outputs Set of material streams
IsRecycling Logical
Components List of components
Upstream main function Function
Downstream main function Function
Pinch temperature Numeric
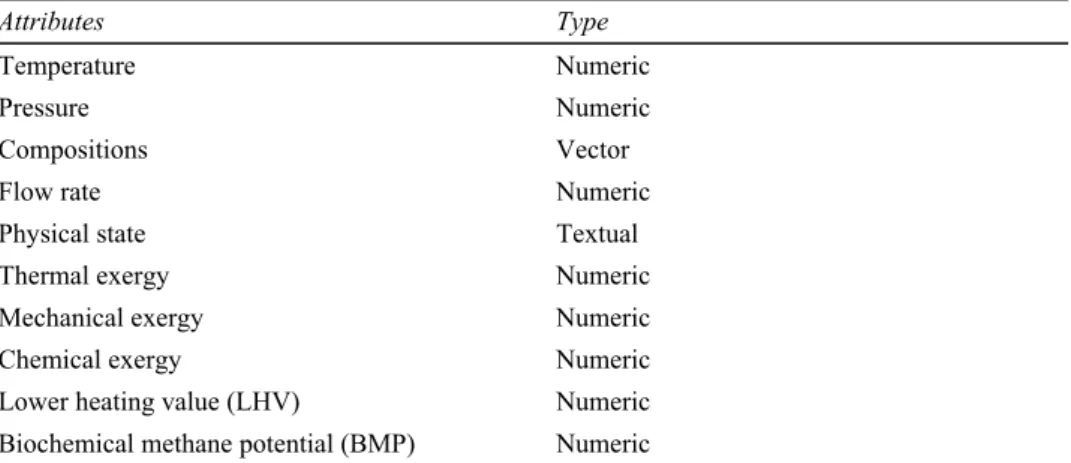
Table 2 List of attributes of material stream description
Attributes Type
Temperature Numeric
Pressure Numeric
Compositions Vector
Flow rate Numeric
Physical state Textual
Thermal exergy Numeric
Mechanical exergy Numeric
Chemical exergy Numeric
Lower heating value (LHV) Numeric Biochemical methane potential (BMP) Numeric Table 3 List of attributes of component description
Attributes Type
Name Character string
Formula Character string
Type Hierarchical
Molar weight Numeric
Let us take a heat exchanger to illustrate the problem’s definition. It is possible to define two opposing technical functions: cooling on the one hand and heating on the other. As a result, two different problems can be defined: the first by the cold side with ‘heat’ as a technical function, and the second by the hot side with ‘cool’ as a technical function. To generalise such an approach, a problem is not defined as a unit operation, but as a set of materially connected streams undergoing transformations to reach given output conditions.
Furthermore, in order to improve process energy efficiency, instead of only focusing on one unit operation, the engineer may prefer to analyse a set of units. To do so, Rodriguez-Martinez et al. (2004) propose a multi-model representation of a process, including the concept of an abstraction level. The idea is to generate meta-operation (a set of unit operations) by using an automated approach of reverse engineering. This methodology has been adapted in this work.
• Library of cases and cases retrieval
A case in the library is defined by a problem and its associated solution. A completed database is a prerequisite for proposing relevant solutions. To fill the database, fictitious problems solved according to heuristic rules have been created. Some process energy improvement strategies found in the literature were also added to the library. Filling up the library of cases is a time-consuming task, but as mentioned above, the CBR is kept up to date in a systematic way thanks to the retaining step.
The case retrieval step is the most important one in a CBR system. It involves identifying the most similar problems to the target problem. This can be achieved by computing a global similarity function:
(
)
(
)
attribute number 1 attribute number 1 .Similarity , Similarity , i i i i i i x y X Y ω ω = = =∑
∑
(10)where X and Y are two distinct problems, xi and yi are local attributes and ωi is a weight
supplied by the user to give more or less importance to each attributes. According to the kind of attributes (i.e., logical, numeric, textual), different functions have been proposed. The evaluation of the global similarity function is not discussed here, but was largely explained in Le Goff (1979). The use of the CBR system will be illustrated through the case study.
In this section, a CBR tool is introduced to help the engineer to define possible modifications of the process. Nevertheless, it is worth mentioning that a local improvement could lead to a global degradation of the global performance of the system (Cziela et al., 2006). One must then consider these local modifications within the whole system, in order to judge to their pertinence within the global objective of reducing utility consumption.
2.3.2 Step 3.2: Global energy efficiency optimisation
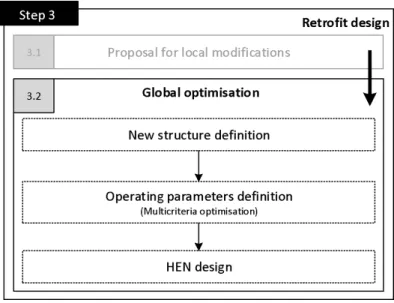
The objective of this paper is to propose a methodology to improve the energy efficiency of existing industrial processes but it should also be used to optimise the structures proposed for grassroots designs. This involves a decrease of cold and hot utility consumption, and also of shaft-work consumption. In the previous step, engineers focus on the proposal for local modifications. In Step 3.2, local modifications are recorded to generate global alternatives. To this end, one may follow the methodology shown in Figure 4 that consists of defining a new general structure of the process, determining the best operating parameters in an energy viewpoint, and synthetising the new heat exchanger network.
Figure 4 General methodology of step 3.2
• New general structure definition
Proposals for local modifications are implemented within the global process to build a general structure: adding or removing unit operations suggested by the CBR system are realised, and the operating parameters influencing energy efficiency are regarded as optimisation variables.
This new structure ends with a new list of hot and cold streams whose temperatures remains unknown. These temperatures may be variable parameters (e.g., preheating temperature, effluent released temperature, etc.) or may be impacted by other variable parameters, such as compression discharge pressure or oxygen excess rate in a combustor.
• Determination of operating parameters
The new structure is then used to determine the best operating parameters. To do so, a multi-criteria optimisation aims to define the best compromise in terms of cold utility consumption, hot utility consumption and shaft-work consumption. For this purpose, Pinch methodology is used to determine the minima of required energy (MER) in hot and cold utilities. These two data represent the two first criteria to minimise for the optimisation. The net power represents the third criterion to maximise. The optimising variables correspond to the variable operating parameters of the new structure.
• Design of process alternatives
Researching the best compromise then enables the operating parameters to be set. Therefore, all flow rates and temperatures are imposed and available to build the new heat exchanger network. Considering several compromises, the engineer can design different new alternatives.
Retrofit design
3.1 II Proposal for local modifications
Global optimisation
!
New structure definition ]:
...
.
...
.
...
.
1.
..
.
.
.
...
.
...
.
...
.
...
...
.
.
.... :
i
Operating parameters definitioni
: (Multicriteria optimisation) l
'..:::::·.:::·
.
:::::::::::::::·.::
::
:::::::
:
:::::::::::
:
:::·.:::·
.:
::i :::::::
:
·
.
:::::::::::
:
:::::::::::
:::::::::::::
:
::::
:
:::::·
.
::'.
i i
: HEN design :
3 Application: analysis of an ammonia processing plant
To highlight the relevance of the introduced methodology for energy optimisation of a chemical or the1mal process within a process modelling and simulation environment
such as ProSimPlus®, a simplified model of an allllllonia production plant from the literature (Hagi et al., 2013; Tsatsaronis, 1993) has been enriched and analysed as an illustrative case.
3.1 Process description and modelling
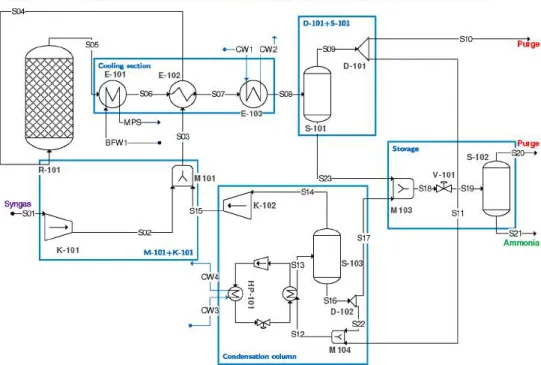
Figure 5 represents the process flow diagram for ammonia production plant from syngas.
Figure 5 PFD of the nominal ammonia processing plant ( see online version for colotu·s)
Syngas ~ro1 K-101 SOS M-l0l+K-101 t o-CW1 CW2
CondenNCion column
D-l0HS-101 - - - s10 - - - ~Pur• ge 0-101 S11 $17 J ~10~
~~
S22Along this process, syngas available at 50 bars and 20°C is compressed up to 280 bars in K-101 before entering the production loop though the mixer M-101, syngas
available at 50 bars and 20°C is compressed up to 280 bars in K-101 before entering the production loop though the mixer M-101. The reacting gas is preheated up to 215°C (heat exchanger E-102) and sent to convertor R-101. The conversion rate within the conve1tor is approximately 30% of nitrogen. The mixture leaving the reactor enables
medium pressure (MP) steam to be produced at 15 bars (E-101), satisfying the preheating in E-102. A primruy condenser (E-103 + S-101 + D-101) enables us to liquefy the mixture prutly by water cooling down to 40°C, and to separate the ammonia from
the unreacted gases. Ninety-five percent of the gases are recovered and sent to the condensation column; 5% others ru·e purged. The liquefied ammonia is stored. In the condensation column, cooled by an ammonia refrigeration machine (HP-101), the recycled gases are cooled down again to recover as much allllllonia as possible.
The gases are recycled in mixer M-101. Cold water (T = 18°C) is used as the cold utility stream. To summarise, streams ‘S10’, ‘S20’, ‘CW2’ and ‘CW4’ (respectively, the purges and utility outputs) are considered as waste streams, whereas streams ‘S21’ and ‘MPS’ are the production ones. The isentropic efficiency of the compressors is set at 0.8. The flashes chosen as adiabatic and isobaric are truly reversible.
The thermodynamic properties are computed thanks to the Soave–Redlich–Kwong (SRK) equation of state. The process is modelled and simulated in ProSimPlus®;
heat losses to the environment have been neglected. Mass balances are available in the supporting information file.
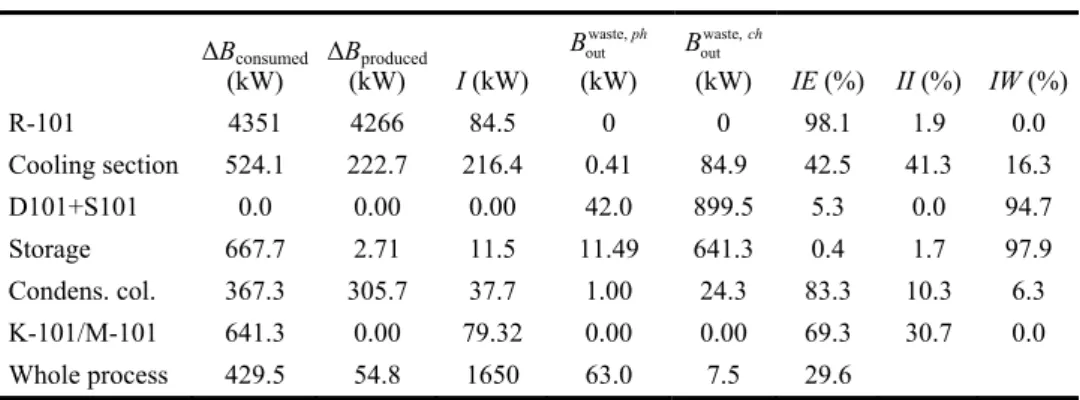
Table 4 Exergy analysis values for the nominal plant ∆Bconsumed (kW) ∆B(kW) produced I (kW) waste, out ph B (kW) waste, out ch B (kW) IE (%) II (%) IW (%) R-101 4351 4266 84.5 0 0 98.1 1.9 0.0 Cooling section 524.1 222.7 216.4 0.41 84.9 42.5 41.3 16.3 D101+S101 0.0 0.00 0.00 42.0 899.5 5.3 0.0 94.7 Storage 667.7 2.71 11.5 11.49 641.3 0.4 1.7 97.9 Condens. col. 367.3 305.7 37.7 1.00 24.3 83.3 10.3 6.3 K-101/M-101 641.3 0.00 79.32 0.00 0.00 69.3 30.7 0.0 Whole process 429.5 54.8 1650 63.0 7.5 29.6
Figure 6 Exergetic ternary diagram of the nominal process (see online version for colours)
D-101
+ S-101
3.2 Exergy analysis
Like any exergy analysis, the first step of the methodology consists of computing the
exergy balance. Thanks to the implementation of the exergy calculation within the ProsimPlus® simulation software (Gounnelon, 2015), exergy balances are automated, such as mass or energy balances. The results are repo1ted in Table 4 and are graphically
represented in the exergetic ternary diagram in Figure 6.
As reconunended above, the analysis should sta1t by the right-hand side of the ternary diagram, which brings to light the less energy-efficient unit operations. From right to left,
one should first analyse the storage, followed by 'D-101 + S-101 ', the cooling section,
'K-101 + M-101 ', the condensation column and finally the reactor R-101. As the amount of physical exergy lost within the storage is relatively low compared to the entire process, this area may first be left aside. Moreover, the reactor may be also excluded from the analysis, as it coITesponds to the core of the process and should be put away in the first step of the process analysis and optimisation.
3.2.1 D-101
+
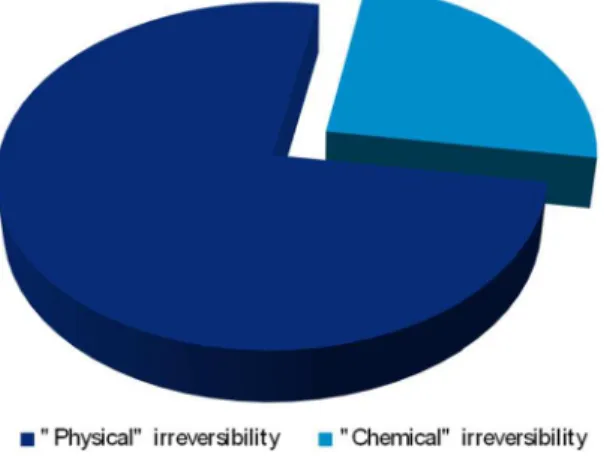
S-101This operation, which includes a purge, is located close to the '/W' ve1tex. This means that such an operation is responsible for a large amount of external exergy loss through stream S 10. There are two ways of reducing the amount of exergy loss: increase the ratio of recovered gases or decrease the amount of purged gases), and valorise the waste stream. To detennine the best potential valorisation technology, one can analyse the
exergy distribution in the waste stream shov.rn in Figure 7. As highlighted in this figure,
mechanical exergy represents the main pa1t of the exergy suppo1ted by stream S 10. Then, this stream could be valorised in a mechanical way such as a turbine, for example.
Figul'e 7 Exergy distribution the SlO waste stream (see online version for colours)
• Thermal exergy • Mechanical e,cergy
3.2.2 Cooling section
This area is composed of three heat exchangers (E-101, E-102 and E-103); the source of iITeversibility is the same for these three unit operations, and mainly comes from the high temperature difference between the hot and cold sides.
3.2.3 K-101 + M-101
This area is composed of a compressor (K-101) and a mixer (M-101). The latter is responsible for a large amount of exergy destruction. This thermodynamic imperfection comes from the non-homogeneities between feeds, i.e., a temperature difference and a chemical composition difference. To determine the main source of exergy destruction, we propose to simulate the same mixer but considering it as isothermal and isobaric. The result of this simulation provides us with an idea of the exergy destruction caused by the chemical composition difference, and that caused by temperature and pressure differences.
As shown in Figure 8, almost 75% of the irreversibility of mixer M-101 is caused by a temperature difference between the two feed streams. Then, the irreversibility can be reduced by mixing the streams as isothermally as possible. Concerning the compressor K-101, exergy destruction can be reduced by decreasing the input temperature or by staging the compression.
Figure 8 Irreversibility distribution of the mixer M101 (see online version for colours)
3.2.4 Condensation column
The major part of the exergy destruction in the condensation column comes from the refrigeration machine. The ternary diagram has been drawn for this in Figure 9. From this figure the major sources of exergy destruction of the refrigeration machine are the two heat exchangers, i.e., the condenser and the evaporator. Irreversibility can then be avoided by decreasing the temperature differences between the hot and cold sides. Concerning the evaluation of irreversibility, one must notice that a part of the irreversibility observed on a system is unavoidable as it is related to the purpose of the unit operations; for example, a reactor will necessarily display a significant value of irreversibility due to the chemical reaction. To evaluate more precisely the potential of improvement of the system, Feng et al. (1996) propose to distinguish the avoidable and unavoidable parts of irreversibility. To be implemented in the process simulator one should defined generic formulation for both terms. In the current version of the software, this calculation has not yet been implemented.
Figure 9 Exergetic ternary diagram of the refrigeration machine (see online version for colours)
3.3 Retrofit design of the ammonia processing plant 3.3.1 Local modifications: use of a CBR system
Finding alternatives to improve such a process may seem obvious for exergy and process integration experts, but for experienced users it can be a complicated task. To help the user in finding alternatives, use may be made of a CBR system tool. Each zone highlighted in the analysis will be analysed using the CBR system.
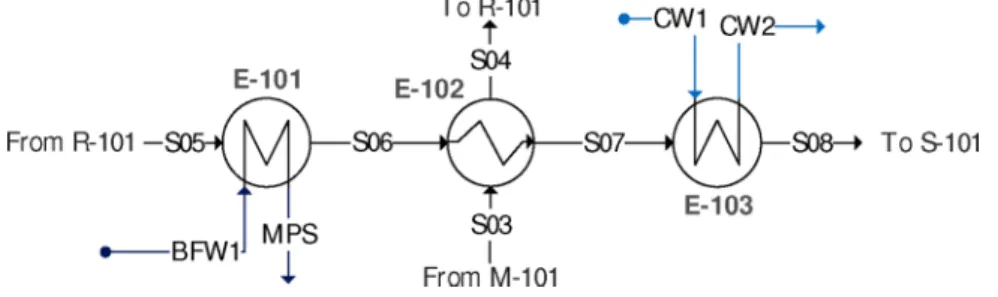
• Cooling section
Concerning the cooling section is shown in Figure 10. The purpose is to cool a process stream down from 458°C to 40°C with medium pressure steam and preheating the reactor input.
Figure 10 Cooling section of the nominal ammonia processing plant (see online version for colours)
IE
I
To
X
o1
-
- @ -
cw1 cw2---.
E-101 E-102
FromR-101- j t c =~ ~ -SJ? SOO-. ToS-101
~
E-103- BFW1 MPS 13
From this process area, one may define three different problems for a CBR system. The first corresponds to the cooling of the process stream (S05 → S08). The second is for the medium pressure stream production, while the third corresponds to the preheating of the reactor feed up to 215°C.
Problem 1: Cooling of the process stream
The Pinch temperature of the process is about 140°C; the cooling required on the process stream is then cross-pinch (from 458 to 40°C). According to Pinch methodology principles, one has to seek to reduce the cold utility need under the Pinch temperature in order to reduce the overall cold utility consumption while preserving the process from an overconsumption of hot utility.
Table 5 describes some attributes of this problem. The CBR tool has identified two potential solutions to this problem: a unit from a methanol (Greef et al., 2002) and another one for producing steam.
Table 5 Cooling section – problem description
Target problem
Main Function Temperature change
Technical function Cooling
Inputs (stream name) S05
• Temperature (°C) 458
• Pressure (bar) 278
• Physical State Vapour
• Flow rate (t/h) 2.9
Outputs (stream name) S08
• Temperature (°C) 40
• Pressure (bar) 278
• Physical state Vapour
• Flow rate (t/h) 2.9
IsRecycling False
Upstream function Reaction
Downstream function Separation
Table 6 summarises main features of problem description for both cases. The solution adopted to improve the methanol process is to introduce a gas turbine in the cooling section to recover the heat of reaction by producing shaft-work. This solution has been adapted for the production of ammonia. Note that this method of improvement was also developed elsewhere (De Jong et al., 1996).
While the second suggested solution is already implemented in the nominal processes, the emphasis will be only placed on the first one, consisting of integrating a gas turbine downstream of the reactor. It should be noted that the higher the feed temperature of the turbine, the greater the work recovered by the latter that
will be important. It is therefore better to place the turbine directly at the reactor outlet. Concerning the compressor, the inlet temperature should be as low as possible (Feng and Zhu, 1997).
Table 6 Cooling section – CBR result
Similar problem
Weight Methanol production Vapour production
Main function 1 Temperature change Temperature change
Technical function 1 Cooling Cooling
Inputs (stream name) – CA-04 23
• Temperature (°C) 1 280 1482
• Pressure (bars) 1 90 3
• Physical state 0.5 Vapour Vapour
• Flow rate (t/h) 0.1 66 35.2
Outputs (stream name) – CA-19 24
• Temperature (°C) 1 30 561
• Pressure (bars) 1 90 3
• Physical state 0.5 Liquid–Vapour Vapour
• Flow rate (t/h) 0.1 66 35.2
IsRecycling 0.5 False False
Upstream function 0.1 Reaction Reaction (combustion) Downstream function 0.1 Separation Temperature change
Similarity 78% 54%
Solution – Integration of a gas turbine Vapour production
Except for the K-201 discharge pressure that is imposed to 278 bar, this process section has variables that could impact both the process utility consumption and the investment cost, i.e., the T-201 discharge pressure, the temperature of stream S07, and the isentropic efficiencies of T-201 and K-201, for example. All of these parameters should be optimised in the next step of the methodology, consisting of proposing global alternatives.
Problem 2: MP steam production
One of the main aims of this study is to reduce the cold utility of the nominal ammonia processing plant without increasing the hot utility consumption. Then, to reduce the overall cold utility consumption, it would be interesting to increase the MP steam flow rate only if there exists a need in the MP steam onsite or on a neighbouring site. This adds a new parameter for the retrofit design of the global alternative.
Problem 3: Preheating of the reactor feed
This problem is similar to the last one, but with more important constraints. Indeed, the outlet temperature and the flow rate must remain unchanged. The unique solution
would be to decrease the inlet temperature to increase the need in calories to satisfy the preheating. To decrease the inlet temperature, one may have to act upon the mixer M-101 or on upstream unit operations such as the compressor K-101.
• ‘K-101 + M-101’ section
The detailed analysis of the mixer M-101 enables us to demonstrate that the high temperature difference between the inlet streams is the main source of exergy destruction in the mixer M-101. An easy solution consists of promoting isothermal mixing by heating up stream S15 and a cooling down stream S02 to the mixing temperature upstream of the mixer, as shown in Figure 11. Table 7 gives the temperature data for this problem.
Figure 11 Mixer-preheating and precooling to reduce irreversibility (see online version for colours)
Table 7 Temperature data for the ‘K-101 + M-101’ section
Stream FCp (kW/K) Temperature (°C) S02 2.67 268 S02′ 88 S15 18 7 S15′ 88 Tpinch (°C) 140
Introducing heat exchangers upstream the mixer will necessarily generate new hot and cold streams in the process. Then implementing such modifications, one must pay attention not to increase hot and cold utility requirement in the process. The rule is to introduce a new hot stream above the pinch temperature or/and a new cold stream below the pinch temperature. In our case, the solution would consist in installing:
• one heat exchangers upstream of the mixer to cool S02 stream down to 88°C to reduce the Minimal energy requirement by E1 MW where:
S02 E1=FCp ×[(268 1 40 140 − ) (− −88 0.2 MW)]= (11)
i
S03 ~ M101 ~ 2 Isis
Ic
:;
{
-S02~ ~S15-• one heat exchanger upstream of the mixer to heat S15 up to 88°C that will permit to reduce the Minimal energy requirement by E2 MW where:
S15
E2=FCp ×(88 − =7) 1.5 MW (12)
Of course, the real pinch temperature will necessarily depend on the final configuration of the entire process. Both output temperature for S02′ and S15′ will then be considered as new variables in the retrofit design of the new alternative configuration. On the other hand, as the energy, saving is not significant on the stream S02, a new problem consisting of the compressor and the mixer has been defined (see Figure 12). The CBR tool has identified two potential solutions for this problem: the first deduced from an ammonia processing plant and another from a fictitious process. Table 8 summarises main features of the problem description of both cases.
Figure 12 ‘K-101 + M-101’ problem
Table 8 Purge S10 – problem description and solution Weight Target problem
Ammonia
production Fictitious #3 Fictitious #4
Main Function 10 Waste reduction Waste reduction Waste reduction Waste reduction Technical function – – –
Inputs (stream name) S10 S19 1 1
• Temperature ( C) 100 40 32,2 25 150
• Pressure (bars) 100 278 128,3 100 100
• Physical state 50 Vapour Vapour Vapour Vapour • Composition 30 H2 (53%); N2 (11%); Ar (6%); CH4 (15%); NH3 (15%) H2 (82%); N2 (10%); Ar (1%); CH4 (4%); NH3 (3%) N2 (79%); O2 (21%) N2 (79%); O2 (21%) • Flow rate (t/h) 10 0.12 0.9 1 0.4
Outputs 80 Environment Environment Environment Environment
Pinch temperature ( C) 100 140 72 90 90
Solution – H2 recovery
membrane Heat + Expand Expand + Heat
Similarity – 6 % 67% 52% - s 0 1 ~ ~ S 0 2 K-101
i
S03 ; \ M101 S15-The most similar case is a fictitious process built from common rules used in exergy analysis and defined by Feng and Zhu (1997). Such a solution would not enable the cold utility consumption to be reduced, but would decrease the amount of shaft-work needed to run the compression.
• Purge S10
The purge represents another source of improvement of the process. The stream temperature is about 40°C and its pressure is 278 bar. The objective is to reduce the amount of exergy lost in the environment. To do so, we may define a new problem to be solved using the CBR system; the description is reported in Table 8. As shown in Table 8, the CBR tool has identified a thermo-mechanical valorisation from fictitious process #3. Therefore, for the next step, a heating followed by an expansion of the purge will be studied. Here, two parameters stay unknown, i.e., the preheat temperature and the turbine discharge pressure.
Table 9 Summary of proposed local modifications
3.3.2 Global alternatives proposals
Table 9 summarises all the local modifications that were proposed in the previous step. As mentioned earlier, some parameters appearing in this table that could influence both the energy consumption and the investment cost still remain undetermined. The next step consists of determining optimal values for the set of variables that will contribute to obtain the best compromises in terms of utility consumption. According to Table 10, one has to determine eight variables (PS06, PBFW1, DBFW1, PS01′, PS02′, TS15′, TS10′ and PS10′′).
To do so, and as suggested by the methodology, we perform an optimisation considering
Cooling section: probleml Cooling section: problem2 M101+K101 Purge ,-
~sr:::1
E-201 ~ e9'·"'' ~ T oS-101 ~n~ T-201V
K-201 E-203 Feed _...;..BFW-'-"l"-11>10~ E-207 vapour• outlet ,rom ~ 1 0 siaE]
S-I01 _ , . ~ l e t T-202Integration of a gas turbine
downstream of the reactor
Generation of steam
Introduction of a compression stage with an intermediate recooling and
preheating of stream S15
upstream of the mixer
Recovery of the exergy waste by preheating and expanding
the MER of cold and hot utilities and work consumption as criteria. The MER can be computed according to the problem table algorithm (Linnhoff and Dhole, 1992). The computation of the MER is realised on a set of hot and cold streams with undetermined temperatures; these streams are reported in Table 11. To determine these parameters, the stochastic optimisation module using a genetic algorithm available in ProsimPlus® has been used. Results of the optimisation are illustrated through the Pareto
surface shown in Figure 13.
Table 10 Summary of undetermined constraints and variables
Stream Temperature (°C) Pressure (bar) Flowrate (t/h)
S05 458 280 2.9 S06 TS06 PS06∈ [70; 277] 2.9 S07 Tdew(PS06) + 5 PS06 2.9 S07′ TS07′ 280 2.9 S08 40 280 2.9 BFW1 40 PBFW1∈ [13; 20] DBFW1∈ [0.5; 1.2] S01 20 50 0.9 S01′ TS01′ PS01′∈ [80; 277] 0.9 S02′ TS02′∈ [40; 270] PS01′ 0.9 S02 TS02 280 0.9 S15 8 280 2.0 S15′ TS15′∈ [8; 100] 280 2.0 S04 215 280 2.9 S10 40 280 0.1 S10′ TS10′∈ [40; 400] 280 0.1 S10″ TS10″ PS10″∈ [1; 277] 0.1
Table 11 Summary of hot and cold stream of the new process structure
Streams Inlet temperature (°C) Outlet temperature (°C)
S06 TS06 Tdew(PS06) + 5 S07′ TS07′ 40 BFW1 40 Tdew(PBFW1) + 15 S01′ TS01′ TS02′ S15 8 TS15′ S03 TS03 215 S10 40 TS10′
Two points (A and B) from this surface corresponding to two process configurations were studied. The parameters of configurations A and B are reported in Table 12.
• Configuration A
In configuration A, emphasis is placed on the minimisation of shaft-work consumption. According to parameters reported in Table 12, one may establish the new list of hot and cold streams (Table 13) and define a new heat exchanger network (Table 14). The new process scheme is shown in Figure 14.
Table 12 Operating parameters of configurations A and B
Parameters Configuration A Configuration B
PS06 169 277 (= no turbine) PBFW1 13 13 DBFW1 0.5 0.9 PS01′ 192 207 TS02′ 40 40 TS15′ 8 ( = no heat-exchanger) 8 ( = no heat-exchanger) TS10′ 382 65 PS10″ 1 1 Uf, min (kW) 340 107 UC, min (kW) 0 0 W (kW) –113 –195
Figure 13 Pareto surface of the tri-criteria optimisation (see online version for colours)
-50 ~ -100
..,,
C 0 :g_ E -150 :, V> C 0 u..,,
~
-200 200 Minimum Hot Utility (kW) 600Table 13 Configuration A – list of hot and cold streams
Streams Inlet temperature (°C) Outlet temperature (°C) Q (kW)
S06 397.40 55.47 853.04 S07′ 109.85 40 261.02 BFW1 40 206.98 395.39 S01′ 164.91 60 85.78 S15 8.87 56 86.15 S03 84.26 215 339.52 S10 40 382 37.90
Table 14 Configuration A – new heat exchanger network
Heat exchanger
Cold Stream Hot Stream Q
(kW)
Name Tin (°C) Tout (°C) Name Tin (°C) Tout (°C)
NE1 S10 40.0 382.0 S06 396.7 381.5 37.9
NE2 S03 35.0 215.0 S06 250.0 61.9 469.0
NE3 BFW1 138.2 207.0 S06 381.5 250.0 327.9
NE6 BFW1 40.0 138.2 S01′ 202.3 120.2 67.5
Figure 14 Ammonia processing plant – configuration A (see online version for colours)
In this configuration, a turbine (T-201) is introduced downstream of the reactor to produce shaft-work and to bring the stream up to 278 bar again; a compressor (K-201) must be integrated before the separator S-101. The T-201 discharge pressure is set to 170 bar. Such a modification enables us to recover about 40 kW of work (power generated by the turbine minus that needed to run the compressor) from the heat generated by
so,,,_ _ _ _ _ _ Purge i S10" S10 __
~
'
SlO' S12the exothermic reaction within R-101. Moreover, the waste stream S10 is valorised to generate about 38 kW of shaft-work. Finally, compressor K-101 is staged with an intermediate cooling. This intermediate cooling enables us to preheat the water before being vaporised. Once again, the compressor staging enables shaft-work consumption to be reduced from 209 W for the nominal process to 191 kW for configuration A. In addition, to reduce work consumption, this configuration also decreases the need for cold utility from 575 kW for the nominal process to 490 kW for this new configuration. • Configuration B
The second configuration does not propose the integration of a turbine at the reactor outlet but rather suggests an increase in the generated steam flow rate. The new heat exchanger network is reported in Table 15 and the new scheme is shown in Figure 15.
Table 15 Configuration B – new heat exchanger network
Heat exchanger
Cold stream Hot stream Q
(kW)
Name Tin (°C) Tout (°C) Name Tin (°C) Tout (°C)
NE1 BFW1 40.0 146.1 S01′ 216.5 57.2 131.3
NE3 BFW1 146.1 207.0 S06 457.9 233.5 580.4
NE3 S03 31.3 215.0 S06 233.5 48.4 478.7
Figure 15 Ammonia processing plant – configuration B (see online version for colours)
S04 S06' MPS
•
BFWl Purge..
S10 NE3SO
~
SOD
5-101 S03 ; \ MlOl D-101 S 18-+:::¾}--S 1 9 Syngas --s011:::::;-, NEl t_:::::::J-s01· K-202._
C
i
r
K-203/1 s01"@ - s o z· E-104 Is
- Q
oz
s
i
o
".'.!'
S Z ~3 V-10111 3 slsCIN
1 ~ K-102 S21-> BFWl!
T
._
513 ~-10:17 Ammonia S16 D-102 S22 S12 M104Two major modifications allowing an overall decrease in cold utility consumption are proposed with this scheme. The increase of the amount of steam produced, and the staging of the compressor K-101, enables the overall consumption to be reduced from 575 kW to 105 kW. Different to configuration A whose modifications intend to reduce the shaft-work consumption, configuration B promotes the reduction of cold utility consumption. These two proposals are summarised in Table 16.
Table 16 Summary of the more energy efficient proposals
Config. Modifications
Consumption (kW) – Gain (%)
Exergy efficiency Hot
Utility Cold Utility Shaft-work
Nominal 0 575 245 63%
Config. A • Turbine (T-201) + Compressor (K-201) integration downstream R-101
• Two stage compressor (K-101) (192 bar) with intermediate cooling (40 C)
• Pressure modification of the refrigerant (4.6 bar)
• Purge valorisation (preheated and expanded)
0 490 kW – 15% 144 kW – 41% 65%
Config. B • Increase of the produced steam up to 0.9 t/h
• Two stage compressor (K-101) (207 bar) with intermediate cooling (40 C) • Pressure modification of the
refrigerant (4.6 bar)
0 255 kW – 56% 222 kW – 9% 64%
4 Conclusions
We have proposed a new systematic procedure for the analysis and retrofit design to improve the energy efficiency of industrial sites. This methodology relies on the ProSimPlus modelling and simulation environment ability to compute the exergy balance in a systematic way, in addition to classical mass and energy balances (Gourmelon, 2015). It is based on a combination of exergy analysis, CBR and pinch analysis to help engineers to define ways of energy efficiency improvements.
First, in order to help the engineer in the interpretation of the exergy balance, a new graphical representation is introduced. As illustrated through the example of the gas turbine and the ammonia case study, the exergetic ternary diagram introduced for the analysis step enables us to prioritise a unit or set of units that be improved. Nevertheless, this graph could still be improved by taking into account the avoidable irreversibility instead of total irreversibility (Surma and Braunschweig, 1996; Pajula et al., 2001; Seuranen et al., 2005). This would enable the true potential to be calculated, in order to improve the unit operations (Avramenko and Kraslawski, 2006).
Then, traditional exergy analysis approaches found in the literature do not necessarily lead to alternatives proposals for improving the processes, a CBR system was developed and presented to help the engineer to make proposals for modification. Its utilisation has been demonstrated while searching for alternatives of the ammonia processing case study.
The effectiveness of such a system highly depends on the filling degree of the database. In the presented case, the database still has to be filled in order to propose more relevant solutions to the user.
Finally the different alternatives resulting from the application of the methodology should necessarily be improved using other criteria. First, a more accurate evaluation of potential improvement of exergy analysis would necessarily require the introduction of avoidable/non avoidable parts of exergy loss (Balli, 2017; Morosuk and Tsatsaronis, 2008; Hinderink et al., 1996). Moreover, of course, an economic evaluation is required and the development of a COST module in ProSimPlus software will enable this analysis and will help the engineer to make an informed decision. A sustainability assessment should finally be performed using dedicated metrics as suggested by Matzen et al. (2015) or introducing sustainability directly in exergy evaluation (Stougie and van der Kooi, 2016).
These development planned in the future will necessarily improve the accuracy of results provided by this approach and will allow its application for retrofit of processes as well as for the proposal of new designs for innovative processes.
Acknowledgement
Financial support provided by the French National Research Agency (ANR) is gratefully acknowledged.
References
ADEME (2014) Le Comptage de l’énergie, Dunod éd., Paris.
Anantharaman, R. (2011) Energy Efficiency in Process Plants with Emphasis on Heat Exchanger
Networks: Optimization, Thermodynamics and Insight, PhD Thesis, Norwegian University of
Science and Technology (NTNU), Trondheim.
Anantharaman, R., Abbas, O. and Gundersen, T. (2006) ‘Energy level composite curves – a new graphical methodology for the integration of energy intensive processes’, Applied Thermal
Engineering, Vol. 26, pp.1378–1384.
Aspelund, A., Berstad, D. and Gundersen, T. (2007) ‘An extended pinch analysis and process Integration procedure utilizing pressure based exergy for subamabient cooling’, Applied
Thermal Engineering, Vol. 27, pp.2633–2649.
Asprion, N., Rumpf, B. and Gritsch, A. (2011) ‘Work flow in process development for energy efficient processes’, Applied Thermal Engineering, Vol. 31, pp.2067–2072.
Ataei, A. (2011) ‘Application of combined pinch and exergy analysis in retrofit of an olefin plant for energy conservation’, Scientific Research and Essays, Vol. 6, pp.2437–2446.
Ataei, A. and Yoo, C. (2010) ‘Combined pinch and exergy analysis for energy efficiency optimization in a steam power plant’, International Journal of the Physical Science, Vol. 5, pp.1110–1123.
Avramenko, Y. and Kraslawski, A. (2006) ‘Similarity concept for case based design in process engineering’, Computers & Chemical Engineering, Vol. 30, pp.548–557.
Balli, O. (2017) ‘Advanced exergy analyses to evaluate the performance of a military aircraft turbojet engine (TJE) with afterburner system: splitting exergy destruction into unavoidable/avoidable and endogenous/exogenous’, Applied Thermal Engineering, Vol. 111, pp.152–169.
Cziela, F., Tsatsaronis, G. and Gao, Z. (2006) ‘Avoidable thermodynamic inefficiencies and cost in an externally fired combined cycle power plant’, Energy, Vol. 31, pp.1472–1489.
De Jong, E.D., Keuken, H., Van Der Pol, E., Den Dekker, E. and Kerckhoffs, E.J.H. (1996) ‘Exergy analysis of industrial processes using AI techniques’, Computer & Chemical
Engineering, Vol. 20, Suppl. 2, pp.1631–1636.
Dincer, I. and Rosen, M. (2007) EXERGY, Elsevier, Amsterdam.
Feng, X. and Zhu, X. (1997) ‘Combining pinch and exergy analysis for process modifications’,
Applied Thermal Engineering, Vol. 17, pp.249–261.
Feng, X., Zhu, X. and Zheng, J. (1996) ‘A practical Exergy method for system analysis’, Energy
Conversion Engineering Conference, Washington, pp.2068–2071.
Ghorbani, B., Salehi, G.R., Ghaemmaleki, H., Amidpour, M. and Hamedi, M.H. (2012) ‘Simulation and optimization of refrigeration cycle in NGL recovery plants with exergy-pinch analysis’, Journal of Natural Gas Science and Engineering, Vol. 7, pp.35–43.
Gong, M. and Wall, G. (2003) ‘On exergy and sustainable development – Part 2: indicators and methods’, Exergy, an international Journal, Vol. 1, pp.217–233.
Gourmelon, S. (2015) Méthodologie d’Analyse et de retro-conception pour l’amélioration
énergétique des procédés industriels, PhD Thesis, INP Toulouse, France.
Gourmelon, S., Hetreux, R., Floquet, P., Baudoin, P., Baudet, P. and Campagnolo, L. (2015) ‘Exergy analysis in ProSimPlus simulation software: a focus on exergy efficiency evaluation’,
Computers & Chemical Engineering, Vol 79, pp.91–112.
Greef, I.L., Visser, J.A., Ptasinski, K.J. and Janssen, F.J.J.G. (2002) ‘Utilization of reactor heat in methanol synthesis to reduce compressor duty– application of power cycle principles and simulation tools’, Applied Thermal Engineering, Vol. 22, pp.1549–1558.
Gundersen, T. (2013) Handbook of Process Integration (PI), WoodHead Publishing éd., Klemes J.J., Oxford.
Gundersen, T., Aspelund, A. and Berstad, D. (2009) ‘Extending pinch analysis and process integration into pressure and fluid phase considerations’, Chemical Engineering Translation, Vol. 18, No. 33. pp.33–38.
Hagi, H., Nemer, M., Le Moullec, Y. and Bouallou, C. (2013) ‘Assessment of the flue gas recycle strategies on oxy-coal power plants using an exergy based methodology’, Chemical
Engineering, Vol. 35. pp.343–348.
Hinderink, A.P., Kerkhof, F.P.J.M., Lie, A.B.K., De Swaan Arons, J. and Van Der Kooi, H.J. (1996) ‘Exergy analysis with flowsheeting simulator-II. Application; synthesis gas production from natural gas’, Chemical Engineering Science, Vol. 51, pp.4701–4715.
Homsak, M. and Glavic, P. (1996) ‘Pressure exchangers in pinch technology’, Computers &
Chemical Engineering, Vol. 20, p.711–715.
Ishida, M. and Kawamura, K. (1982) ‘Energy and exergy analysis of a chemical process system with distributed parameters based on the enthalpy-direction factor diagram’, Industrial &
Engineering Chemistry Process Design and Development, Vol. 21, pp.690–695.
Ishida, M. and Nakagawa, N. (1985) ‘Exergy Analysis of a pervaporation system and its combination with a distillation column based on the enthalpy-direction factor diagram’,
Journal of Membrane Science, Vol. 24, pp.271–283.
Kotas, T.J. (1985) The Exergy Method of Thermal Plant Analysis, Butterworths, London. Le Goff, P. (1979) Industrial Energetic, Technique et Documentation.
Linnhoff, B. and Dhole, V. (1992) ‘Shaftwork targets for low-temperature process design’,