Any correspondence concerning this service should be sent
to the repository administrator: [email protected]
This is an author’s version published in:
http://oatao.univ-toulouse.fr/21067
To cite this version:
Wang, Guiquan
and Abbas, Micheline
and Climent, Éric
Modulation
of the regeneration cycle by neutrally buoyant finite-size particles. (2018)
Journal of Fluid Mechanics, 852. 257-282. ISSN 0022-1120
Modulation of the regeneration cycle by
neutrally buoyant finite-size particles
G. Wang
1,2,3, M. Abbas
2,3† and E. Climent
1,31
Institut de M´ecanique des Fluides de Toulouse (IMFT), Universit´e de Toulouse, CNRS, Toulouse, FRANCE
2
Laboratoire de G´enie Chimique, Universit´e de Toulouse, CNRS, Toulouse, FRANCE 3FERMaT, Universite´ de Toulouse, CNRS, Toulouse, France
Direct numerical simulations of turbulent suspension flows are carried out with the Force-Coupling Method in plane Couette and pressure-driven channel configurations. Dilute to moderately concentrated suspensions of neutrally buoyant finite-size (Ly/d =
20) spherical particles are considered when the Reynolds number is slightly above the laminar-turbulent transition. Tests performed with synthetic streaks, in both turbulent channel and Couette flows, show clearly that particles trigger the instability in channel flow whereas the plane Couette flow becomes laminar. Moreover, we have shown that particles have a pronounced impact on pressure-driven flow through a detailed temporal and spatial analysis whereas they have no significant impact on plane Couette flow con-figuration. The substantial difference between both flows is related to spatial preferential distribution of particles in the large scale rolls (inactive motion) in Couette flow, whereas they are accumulated in the ejection (active motion) regions in pressure-driven flow. Through investigation of particle modification on two distinct flow configurations, we were able to show the specific response of turbulent structures and the modulation of the fundamental mechanisms composing the regeneration cycle in the buffer layer of near-wall turbulence. Especially for pressure-driven flow, the particles enhance the lift-up and let it act continuously whereas the particles do no significantly alter the streak breakdown process. The reinforcement of the streamwise vortices is attributed to the vorticity stretching term by the wavy streaks. The smaller and more numerous wavy streaks enhance the vorticity stretching and consequently strengthen the circulation of large scale streamwise vortex in suspension flow.
Key words: Turbulence transition, particles, simulations
1. Introduction
The experiments of Matas et al.(2003) have shed the light on the non-monotonous effect of particles on laminar-turbulent flow transition, depending on the particle-to-pipe size ratio and on suspension volumetric concentration. A small amount of neutrally buoyant finite-size particles allowed sustaining the turbulent state and decreasing the transition threshold significantly. Almost a decade later, particle-resolved numerical simulations provided some evidences that at moderate concentration, particles have a significant impact on the unsteady nature of the flow, enhancing the transverse turbulent
that there is no significant difference between single- and two-phase flows at equivalent effective Reynolds number (Wang et al. 2017).
If the size of the particles is large enough compared to the size of energetic eddies in a turbulent flow, the local flow streamlines are significantly modified (as would not be the case for pointwise particles). The rigid body constraints from finite-size particles influence the turbulent kinetic energy budget in two competing ways: they add perturbations that increase shear production of turbulence and simultaneously increase viscous dissipation (Qureshi et al. 2007;Bellani et al. 2012). The perturbations induced by the particles depend on their locations: their magnitude increases with the local flow strain rate. The spatial distribution of neutrally buoyant particles depends on the flow configuration (turbulent Couette or channel flow). Indeed, in addition to the turbulent dispersion that particles undergo, they are experiencing a lift force due to finite flow inertia at the particle scale. This lift force is normal to the walls, and its orientation depends itself on the flow configuration. Therefore particles are preferentially located either in the active region, i.e. near the walls in pressure-driven channel flow (Loisel et al. 2013), or in the inactive region, i.e. away from the walls in Couette flow (Wang et al. 2017).
Even though the stability in Couette and channel single-phase flows is different, they share at high Reynolds numbers some common turbulence features in the near wall regions. In the inner region of a boundary layer, the turbulent motion consists of an active part and an inactive part based on Townsend (1980). Near the walls, the active motion contains eddies with streamwise characteristic length of the order of 1000 wall units in highly turbulent flows that constitute the essential contribution to the Reynolds shear stress (−u0v0). Statistical properties of the flow stress in the
active region are universal functions of the wall shear stress τw and the wall-normal
position y, whereas the inactive motion gives no correlation between u0 and v0 and it is mainly related to the flow geometry (Bradshaw 1967; Jim´enez 2011; Panton 2001; Tuerke & Jim´enez 2013). The essential difference in both flow configurations is due to the mean velocity (u) profile which is anti-symmetric (resp. symmetric) in plane Couette (resp. pressure-driven) flow with respect to the midplane. The production term (−u0v0du/dy) in the turbulent kinetic energy equation has different roles according to the
flow configuration. In Couette flow, the fluid is pumped away from one wall to the other one, extracting energy from the mean flow, leading to the enhancement of turbulent structures (Papavassiliou & Hanratty 1997). However in pressure-driven channel flow, the shear layers are divided into two regions and the production is of opposite sign in both channel halves, making the turbulent structures relatively independent on each wall. The temporal and spatial development of wall turbulence consists of a self-sustained
Figure 1. Sketch of the regeneration cycle sub-steps
process, namely the near-wall regeneration cycle (located in the vicinity of the non-slip boundary condition 20 < y+ < 60, see Waleffe (1997)). During this complete cycle,
coherent large-scale streaks and alternating staggered rotating vortices sustain each other, altogether having impact on the wall friction. This cycle has been demonstrated to be independent of the outer layer: it can survive without any input from the core flow. Indeed Jim´enez & Pinelli (1999) carried out some simulations after removing all the fluctuations from the velocity field above y+= 60 (in a channel flow), and after hundreds of time units, they observed an almost unchanged turbulent flow compared to the original one. The regeneration cycle consists of three sequential sub-processes sketched in figure 1: streak formation, streak breakdown and streamwise vortex regeneration. The streaks are generated by a linear process, the so-called lift-up effect, whereas the following two processes are the result of non-linear interactions.
In order to understand how particles affect the flow turbulence and the transition from one regime to another, we are concerned in this paper with their impact on the regeneration cycle.Klinkenberg et al.(2013) have shown that inertial pointwise particles modify the transition to turbulence not by altering the lift-up effect but rather by modifying the dynamics of the oblique waves necessary for the streaks regeneration and breakdown. In this work, we consider the effect of neutrally buoyant finite-size particles on the regeneration cycle, in turbulent flows slightly above the transition limit of single-phase flows (Reynolds number equal to 500 for Couette and 2600 for channel flows). Numerical simulations are performed in a domain (so-called miniunit) which contains one set of coherent structures sufficient to sustain the flow turbulence. The size of this miniunit is different for both flows and it follows the findings ofJim´enez & Moin (1991) and Hamilton et al. (1995). The coupling between the fluid motion and the particle dynamics is taken into account using the Force Coupling Method (Climent & Maxey 2009). Neutrally buoyant particles 20 times smaller than the Couette gap or channel height are considered here at moderate volumetric concentration from 1% up to 10%.
The paper is organized as following. Section2summarizes the numerical configurations in both single- and two-phase flows. In section3, we show how particles affect the laminar-turbulent transition by using specific initial conditions for each flow configuration. Then, we discuss the effect of particles on the flow energy modulation in section4 and on the
fraction less than 20%.
Couette flow was driven by two walls moving at equal and opposite velocities. Pressure-driven channel flow was generated by imposing a global pressure drop in the streamwise direction, that is timely tuned in order to maintain constant flow rate. In both flow configurations, x and z are respectively the streamwise and spanwise flow directions, with periodic boundary conditions (the so-called homogeneous directions) while y stands for the wall-normal or velocity gradient direction. Turbulent flow simulations were performed using a so-called “miniunit” configuration, which is the minimal geometric domain that is sufficient to accommodate the self-sustained flow structures for single-phase turbulence, while allowing reasonable time for the computation of suspension flows with finite-size particles. The minimal simulation domain (different in both flow configurations) was carefully examined in Couette flow configuration byHamilton et al. (1995) and pressure-driven flow byJim´enez & Moin(1991). In both cases, the spanwise length is larger than 100 wall units which corresponds to the spanwise characteristic spacing between two coherent structures. The length and velocity in wall units are y+ ≡ yu
τ/ν, and u+ ≡ u/uτ, where uτ =pτw/ρ is the friction velocity based on the
wall shear stress and fluid density.
Table1contains a summary of all the parameters selected for this study. Through all the paper, we note C for plane Couette and P for pressure-driven channel flows. The size ratio between the Couette gap or channel height and the particle diameter is Ly/d = 20
in most cases. Particles experience turbulent fluctuations, and their inertia can be characterized by the dimensionless Stokes number Stturb = τ+p/τ
+
f, where τ+p is the
particle relaxation time scale in response to the turbulent flow forcing which characteristic time scale is τ+f. The latter is considered here as the ratio between the characteristic size of the large scale streamwise vortices L+y in Couette or L+y/2 in channel flow, and
the characteristic velocity fluctuation scale max(v0+, w0+) in the flow cross-section. The ability of the FCM to capture accurately the particle response to flow fluctuations was tested in Wang et al. (2017), where the motion of a rigid particle submitted to an external oscillating force in a still fluid was considered. The numerical solution of the particle motion was in a good agreement with the theoretical prediction when the ratio of the particle radius to the developed Stokes layer thickness δ2≡ ωa2/ν was less than 2
(ω being the oscillation frequency of the external forcing). This ratio is directly related to the particle Reynolds and Stokes numbers, i.e. δ2 = 9πSt
turb/(ρp/ρf + 1/2). In the
simulations considered for this work, with neutrally buoyant particles, δ2is always below
0.5 in Couette and 1.4 in pressure-driven flows.
Table 1 contains also the Stokes number based on the local shear which achieves its maximum value near the channel or Couette walls, where the shear rate is the highest.
Couette(C)
Ly/d = 20, Lx× Ly× Lz= 2.85 × 1.0 × 1.91,Nx× Ny× Nz= 382 × 134 × 256 pressure − driven(P )
Ly/d = 20, Lx× Ly× Lz = 1.57 × 1.0 × 0.63,Nx× Ny× Nz = 158 × 106 × 64 Case Np Φ(%) Ubulk uτ L+y d+ Reb Reτ Rep(max) St(max) Stturb
C500 − 0 0 0 0.5 0.040 80 – 500 40 – – – C500 − 5 3968 5 0.5 0.041 82 4.1 500 41 4.4 0.97 0.017 C500 − 10 7936 10 0.5 0.042 84 4.2 500 42 4.4 0.97 0.017 P 2600 − 0 0 0 0.5 0.048 187 – 2600 94 – – – P 2600 − 1 151 1 0.5 0.052 203 10.15 2600 102 10.6 2.36 0.068 P 2600 − 5 757 5 0.5 0.056 218 10.9 2600 109 7.8 1.73 0.074 Table 1. Parameters of the numerical simulations. The Reynolds number Reb≡ Ubulkh/ν for Couette flow and Reb≡ Q/ν for channel flow. h = Ly/2 is half of the Couette gap or channel height. In channel flow, the flow rate per unit depth is Q = 4UbulkLy/3. Ubulk is the velocity of the moving walls in Couette flow whereas it is half the central velocity that the channel flow would have if the flow was laminar. The Reynolds number based on the friction velocity and on the channel half-width is Reτ ≡ uτh/ν. The particle Reynolds number Rep ≡ Γ a2/ν based on local shear rate Γ = |du/dy|, and the Stokes number St ≡ 2ρp/(9ρf)Repare low near the Couette and channel centers and they are maximum near the walls where the shear rate is the highest. The maximum particle Reynolds and Stokes numbers are based on the shear rate calculated at one particle diameter away from the walls.
It is nearly 1 in Couette and 2.4 in channel flow. Note that the results of simulations in Couette flow with 1 < St < 4 (4 < d+ < 8) reported inWang et al.(2017) were similar
to those obtained in the present paper at St ≈ 1 (d+≈ 4). For both flow configurations,
the effect of particles on the statistics were formed at an effective Reynolds number 40% to 50% higher than the corresponding critical Reynolds number (estimated from figure2).
3. Particle effect on the transition
A theoretical analysis of flow stability in the presence of freely moving finite-size particles is actually impossible, from a mathematical point of view. For this reason we determined the transition threshold from an engineering point of view, by considering a fully-developed turbulent flow experiencing successive reductions of the Reynolds number down to a limit where the flow becomes eventually laminar. Every time the Reynolds number was decreased, the simulation was run for longer than 500 time units. Transition of single-phase flow was observed at Rec C ∼ 320 for Couette and at
Rec P ∼ 2200 for pressure-driven flows. It should be kept in mind that, first the value
of the critical Reynolds number depends on the simulation domain because periodic boundary conditions influence interactions between large scale vortices. Second, the relaminarization is a process that may occur randomly. Therefore the determination of a “rigourous” laminar-turbulent transition threshold (which is not the main scope of the present paper) would require a large amount of simulations to form statistics. Instead, an indicative threshold is determined in order to assess the impact of the particle presence on the flow features, and to evaluate qualitatively an eventual transition delay or enhancement.
Figure 2. Effect of neutrally buoyant particles on the laminar-turbulent transition threshold, as depicted from the temporal evolution of Cf, after decreasing Rebin (a) Couette flow and (b) pressure-driven flow. The initial flow configuration of the Couette (resp. channel) flow is taken from a fully-turbulent simulation at Reb= 500 (resp. 2300). (a): Reb= 500, Φ = 5%;
Reb= 470, Φ = 10%; Reb= 455, Φ = 10%; Reb= 440, Φ = 10%; Reb= 455 to 345, Φ = 5% and I to V corresponding to Reb = 455, 415, 390, 365 and 355. (b): Reb= 2000, Φ = 1%; Reb= 2000, Φ = 5%; Reb= 1700, Φ = 5%; Reb= 1500, Φ = 5%.
In the range of investigated suspension flow parameters (particle size and volumetric concentration), particles are expected to decrease significantly the laminar-turbulent transition threshold in pressure-driven flow based on the experiments of Matas et al. (2003), in opposite to Couette flow where particles seem to not affect the flow stability (see our previous study of Wang et al. (2017)). The wall friction coefficient Cf
(summed on both walls) was considered as an indicator of current flow regime, Cf = 2τw/(ρUbulk2 ) for Couette flow and 2τw/(ρ(Q/Ly)2) for pressure-driven flow.
The initial flow configurations were chosen from the single-phase flow simulations at Reb = 500 for Couette and Reb = 2300 for channel flow. The particles were then
randomly seeded in the simulation domain, at different volumetric concentrations (Φ = 5 or 10% in Couette and Φ = 1 or 5% in channel flow). The two-phase flow simulations were carried out for several hundreds of time units (typically more than 300), before the Reynolds number was decreased in order to evaluate the transition threshold. The evolution in time of the wall friction coefficient of the suspension flow is shown in figure2for different cases, after the Reynolds number was abruptly decreased. In Couette flow, the Reynolds number was decreased from 500 separately to 470, 455 or 440. At Φ = 10%, the flow became laminar for the two simulations at Reb= 455 and
440. At Φ = 5%, the flow remained turbulent at Reb= 455. When the Reynolds number
was progressively decreased as following: 455 → 415 → 390 → 365 → 355, the transition took place only around Rec≈ 355. This critical Reynolds number is calculated using the
pure fluid viscosity. The effective Reynolds number based on the suspension viscosity is lower if additional viscous dissipation introduced by the rigid particles is accounted
for, due to an increase of the flow viscosity νef f = νη(Φ, Re), with η(Φ, Re) > 1. There
are some possibilities to predict η(Φ, 0) from Eiler’s fit (Stickel & Powell 2005) and the correction at finite Reynolds number η(Φ, Re) at low concentrations (see for example Subramanian et al. (2011)). The simulations with FCM give access to the increase of the suspension viscosity induced by the particles through the second order term of the multipole expansion also called Stresslet (for the definition, seeWang et al. 2017). This leads to a critical Reynolds number of the suspension flow Rec,s≈ 312 for Φ = 5% which
is very close to the value of single-phase flow Rec C. The main conclusion of this test is
that in a Couette flow with moderate particle concentration, the particles act mainly as a source of energy dissipation in the flow, and that they do not change significantly the transition threshold if the suspension viscosity was taken into account in the Reynolds number definition.
In pressure-driven flow, the initial flow configuration was selected at Reb = 2300.
Particles were randomly seeded at concentration 1% or 5%. A small concentration of finite-size particles is enough to decrease the transition threshold (seeMatas et al. 2003; Loisel et al. 2013; Yu et al. 2013;Lashgari et al. 2015), keeping in mind that at low to moderate concentration, the threshold decreases when the concentration is increased, in contrast to Couette flow. Figure2(b) shows the temporal evolution of Cf after particles
were seeded and the Reynolds number was decreased from 2300 to 2000. For Φ = 1%, the flow is fully laminar at Reb = 2000. However for Φ = 5%, a stable two-sided turbulent
flow is sustained at Reb = 2000 while Jim´enez & Moin (1991) observed that in the
miniunit turbulent flow exists only near one wall in a single-phase flow, even at higher Reynolds number (Reb= 2667). Decreasing Rebfrom 2300 to 1700 and then to 1500, the
flow becomes laminar at Rec= 1500 (which corresponds to Rec,s= 1315 based on Eiler’s
fit whereas Rec,s= 1150 based on 5(c)). A significant drop of the transition threshold
(Rec P ∼ 2200 for single-phase flow) is observed although the effective viscosity has
increased.
Influence of particles on the flow stability
As will be further discussed in §4.1, particles tend to accumulate in the large scale vortex regions in Couette flow and in low-speed streak regions in channel flow. In order to understand how particles enhance or reduce the flow stability from their preferential spatial distribution, we carried out some simulations with specific flow configurations.
The first test was done in Couette flow and it was inspired from the study ofHamilton et al. (1995). When the streamwise velocity perturbations were removed, while the linear streamwise velocity profile and streamwise vortices were maintained from a fully turbulent simulation, the authors observed that the flow evolved again to the fully turbulent regime. In a similar way, we considered for the initial configuration, a snapshot from steady single-phase turbulent Couette flow simulation at Reb= 500 while
the large-scale x-independent streak is maximum (from M (0, β) defined in (4.1)). We removed the streaks, and abruptly decreased the Reynolds number to 455 and 430 in two separate simulations.
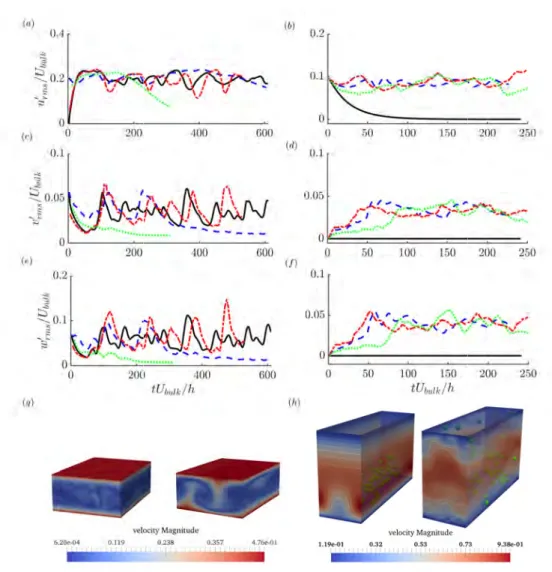
The temporal evolution of R.M.S velocity fluctuations shown in figures 3(a, c, e) as well as the mean velocity profile (not shown here) suggest that despite the initial destabilization, the flow recovers its fully turbulent features after 200 time units. Figure 3(g) shows the contours of velocity magnitude for single-phase flow, the left one is
Figure 3. Particle effect on flow stability. Left panel : Couette flow starting from a fully turbulent regime. The turbulent state is stable under single-phase condition, even when the streamwise velocity perturbations are suppressed, the flow recovers its fully turbulent nature. Adding particles damp the velocity fluctuations and make the flow laminar. Reb= 430, single-phase flow removes u0; Reb= 430, Φ = 5% and Ly/d = 10; Reb = 455, single-phase flow removes u0; Reb= 455, Φ = 10% and Ly/d = 20. Right panel : channel flow starting with a flow distribution according to (3.1) where an artifical streak is initially imposed. The single-phase flow tends towards the laminar state at Reb = 2600 which is above the laminar-turbulent transition. Adding small number of particles in the flow triggers the transition to turbulence.
single-phase flow; Φ = 0.5% and Ly/d = 16; Φ = 0.75% and Ly/d = 16; Φ = 0.5% and Ly/d = 20.
taken at t = 0 after removing u0 and its evolution after 500 time units can be seen in the right figure. The flow field plotted after nearly 5 regeneration cycles cannot be distinguished from the initial fully turbulent flow. Therefore the streamwise vortices, that were initially maintained, were strong enough to generate streaks through the lift-up effect and resumed the regeneration cycle.
The main effect of the presence of particles in the Couette flow is stabilizing in nature. When we added small particles (Ly/d = 20) at Φ = 10% and decreased the Reynolds
number down to 455, without removing the streamwise velocity perturbations, the flow became laminar. Adding larger particles (Ly/d = 10) at Φ = 5% and decreasing the
Reynolds number to 430, the flow velocity fluctuations were significantly damped, and the flow became laminar after staying quasi-turbulent for around 6 regeneration cycles. These observations suggest that the particles were mainly enhancing dissipation in the flow.
The test on flow stability for the channel flow configuration has been done using an artificial finite-amplitude low-speed streak that was supplemented to a mean flow profile corresponding to wall-bounded turbulence. We used the same base flow as Schoppa & Hussain(2002) who studied the streak transient growth mechanism in a two-dimensional streak configuration. The base flow is:
u(y, z) = U0(y) + (∆u/2)cos(βsz)g(y) (3.1)
in the streamwise direction, and v = w = 0 in the wall-normal and spanwise directions. U0(y) is the mean velocity and g(y) is an amplitude function which satisfies the no-slip
condition at y = 0 and localizes the streak velocity defect at a single wall. A ‘single-sided’ turbulent mean velocity profile is imposed, analogous to that observed in minimal channel turbulence (Jim´enez & Moin 1991), with a parabolic profile Ulam in the laminar
top half of the channel, and a turbulent Reichardt profile Uturb, that respects the
near-wall turbulence statistics, in the bottom half:
U0(y) =
Ulam= Uc[1 − ((y/h) − 1)2], ym6 y 6 2h
Uturb= u∗[2.5ln(1 + 0.4y/δ) + 7.8(1 − e(−y/11δ)−11δy e
(−y/3δ))],
0 6 y < ym
(3.2)
The friction velocity u∗ = pτw/ρ and viscous length scale δ = ν/u∗ are
calculated using a wall shear stress estimated from Dean’s empirical correlation (Cf ≡ 2τw/ρu2= 0.073Re−0.25b ) in a fully turbulent channel flow. For a given flow rate
Q, this leads the friction velocity to be u∗= Qp0.0365(Q/ν)−0.25/(2h). The two profiles
Uturb and Ulam are matched at a wall normal distance ym in the turbulent half, with
ym and Uc determined so that the mean flow velocity and vorticity are continuous at
the matching point, i.e. Ulam(ym) = Uturb(ym) and dUlam/dy |y=ym= dUturb/dy |y=ym. Consequently, at Re = Q/ν = 2600, ym= 0.918h and Uc= 1.2Q/(2h).
The function g(y) ∼ y · e−ηy2
is accounting for streak velocity defect, it has been normalized to unity with η specified such that the streak velocity defect ∆u and normal vorticity Ωy |max= βs∆u/2 exhibit a plateau in the range y+= 10 − 30, consistent with
the observed lifted streaks and ωy,rms statistics. Note that the amplitude function g(y)
in (3.1) determines the strength of the local streak upper bound u(y) shear layer (e.g. local maxim of ∂u/∂y) residing on the crest of the lifted streak. Instability growth rates for the dominant sinuous modes are found to be relatively insensitive to the strength of this shear layer and hence to the amplitude function g(y). The value η = 20 was used similarly toSchoppa & Hussain (2002). The streak spanwise wavenumber βs in (3.1) is
chosen as 2π/β+
s = 100, corresponding to the well-accepted average spanwise spacing of
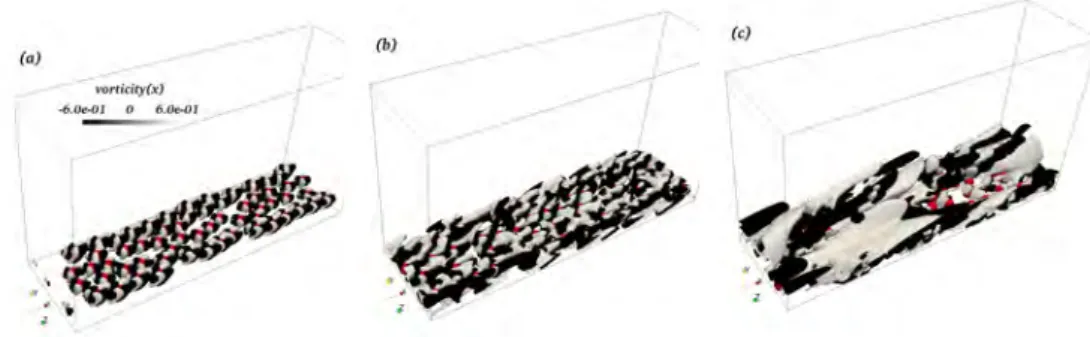
Figure 4. Flow vorticity induced by a layer of particles seeded in the plane y/d = 0.8 (near the wall) in the same flow configuration as3(h). The total volume concentration is Φ = 0.5%, and the size ratio Ly/d = 16 is used. The snapshots are taken at three time instants t = 0.2, 2.7 and 29.5 (scaled by h/Ubulk) which correspond to t+= 2, 27 and 295 (scaled by ν/u2τ).
Figure3(h)-left shows the velocity magnitude contours of the flow according to (3.1). Schoppa & Hussain (2002) found that this single-phase flow is stable and the energy of the artifical streaky perturbation will vanish in time due to viscous dissipation. A spanwise perturbation, following a sinuous profile in the flow direction, is necessary to trigger the growth in time of the perturbation. In the absence of such spanwise initial coherent motion, figures 3(b, d, f) confirm that the perturbation (3.1) is damped over time when the Reynolds number is equal to 2600 (above the transition threshold).
Unlike the Couette flow test, the particles in this particular channel flow were not seeded throughout the entire domain. Of course this would lead the flow to undergo the transition to turbulence. Instead, we seeded a small number of particles only in the low-speed artificial streak region (u(y, z)/Ubulk 6 1.5) keeping the flow Reynolds
number Reb= 2600. Two different local concentrations (particles-to-streak volume) were
considered (Φ = 0.5 and 0.75% for the case of Ly/d = 16 and Φ = 0.5% for the case
of Ly/d = 20). In all cases, the particle presence triggered the transition to turbulence
(this can be evidenced by the level of the R.M.S velocity signals), and the particles were found after ∼ 100 time units spread all over the simulation domain. The figure3(h)-right shows the contours of velocity magnitude for suspension flow in the case of Ly/d = 16
with Φ = 0 .75 % after 250 time units. We can observe a quasi fully-turbulent state at Reb = 2600 (instead of the one-side wall turbulence observed in single-phase flow noted
byJim´enez & Moin (1991)).
The influence of the particles on the transition is also illustrated in figure 4 showing the temporal evolution of the streamwise vorticity generated by the particles. The initial condition is equivalent to figure3(h), except that 60 particles were initially seeded in a plane parallel to the wall (instead of being located in the artificial streak). At the first instants (figure4(a)), streamwise vorticity is generated around finite-size particles due to the secondary flows occurring at finite Rep. As time goes on and particles move,
this streamwise vorticity is stretched in the streamwise direction as in figure 4(b). Furthermore, these structures are tilted due to the mean shear through the streamwise vorticity generation term −(∂w/∂x)(∂u/∂y) (explained in §5) which is large near the wall. They further interact with each other to form larger scale streamwise vortical structures as shown in figure 4(c). Clearly the generated vortical structures are comparable to
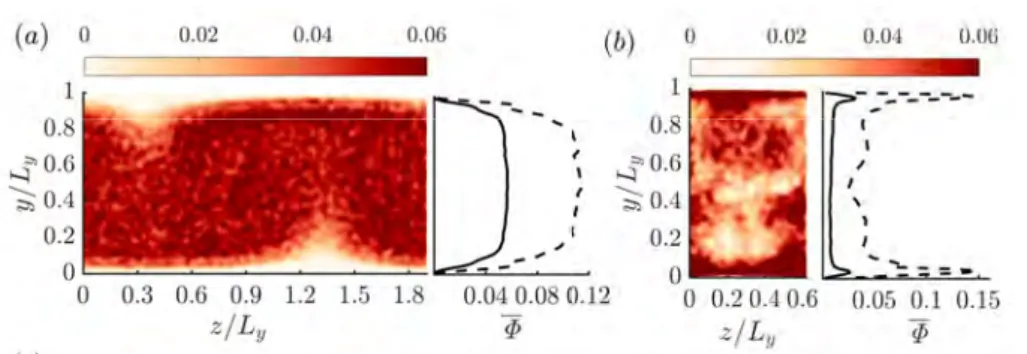
Figure 5. (a) and (b) Particle distribution in the cross-section (y − z plane) of Couette C500 − 5 and pressure-driven P 2600 − 5 flows respectively. The concentration contours are averaged in the streamwise direction, over 80 time units. The corresponding concentration profiles, averaged over 500 time units, are also shown for C500−5, C500−10 in (a), and P 2600−1,
P 2600 − 5 in (b).
the near wall vorticity layers induced by large scale vortices, which are the essential ingredients of the regeneration cycle for channel flow.
4. Modulation of the turbulent flow energy
In this section, we show that particles modulate the flow energy in a channel more strongly than in a Couette flow. The statistics are formed in physical and Fourier spaces in order to study the regeneration cycle. In physical space, profiles are obtained by averaging the data over the two homogeneous (streamwise and spanwise) directions. As for the spectral analysis, it is performed either close to the wall or across the whole gap between the walls. In addition, a modal analysis of the flow fluctuating energy is considered, and will be shortly introduced here. The Fourier decomposition of the energy, as introduced by Hamilton et al. (1995) over two periodic directions, streamwise and spanwise, is written as follows:
M (kx= mα, kz= nβ) ≡ { Z Y2 Y1 [| bu0|2(mα, y, nβ)+| bv0 |2(mα, y, nβ)+|cw0|2(mα, y, nβ)]dy}1/2 (4.1) where Y1 and Y2 stand for the integration bounds in wall-normal direction. (α, β)
are the fundamental wavenumbers in streamwise and spanwise directions defined as (2π/Lx, 2π/Lz), and m and n are integers. The intensity of any turbulent strucrure can
be represented by one mode (mα, nβ).
Since flow modulation is partly related to particle spacial distribution, the latter will be first discussed.
4.1. Particle dispersion
Figures 5(a, b) show the average particle distribution over the cross-section plane. The contours of concentration are averaged over 80 time units (h/Ubulk) whereas the
wall-normal concentration profiles were averaged over 500 time units. The maximum concentration is located in the core region of the Couette flow, whereas two peaks can be observed near the walls of the channel flow. The average concentration profiles are the result of a balance between the lift force on the finite-size particles, the hydrodynamic repulsion from the wall and the shear-induced turbulent diffusion. To be more specific, in
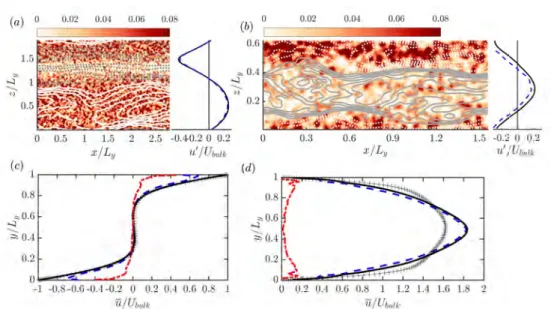
Figure 6. (a) and (b) show particle distribution in a plane parallel to the wall (x − z plane) in Couette C500 − 5 and pressure-driven P 2600 − 5 flows respectively. The concentration contours taken at y/Ly= 0.2 are averaged over 80 time units. The isolines show u0/Ubulk in x − z plane, where dashed lines stand for negative and solid line positive values, the interval being 0.04 in (a) and 0.03 in (b). The spanwise variation of the fluid (black) and particle (dashed blue) fluctuation velocity u0/Ubulk averaged in streamwise direction is also plotted on the right side of (a) and (b), separately. (c) and (d) are the streamwise velocity profiles of fluid phase (black line), particle phase (blue dashed line) and slip (red dashed dotted line) velocities (defined as the fluid velocity subtracted by the particulate phase velocity). The cross symbols indicate the velocity profile for the single phase flow.
laminar plane Couette flow (linear flow), a finite-size neutrally buoyant particle exhibits a (rotational and translational) slip with respect to the local flow field. The pressure is larger on the side of the particle closer to the wall, and thereby the particle is pushed away from the wall (Ho & Leal 1974). When the velocity profile is not linear (quadratic for Poiseuille flow), the particle is experiencing an inertia-induced lift force (Asmolov 1999), resulting from its perturbation (as a rigid body) to the quadratic velocity profile (see a review paper from Matas et al. (2004)). This force is oriented toward the wall. This is known as the Segr´e-Silberberg or pinch-off effect. The particle is also experiencing a hydrodynamic viscous repulsion when it is very close to the wall. The balance between these two opposite forces leads to equilibrium positions (in laminar channel flow) that depends on the particle Reynolds number, and yields segregation of a suspension in channel flow (seeMatas et al. 2004;Loisel et al. 2015).
The instantaneous spatial distribution of particles is shown together with the stream-wise velocity fluctuation contours in the x − z plane (figures 6(a, b)). These figures show a strong correlation between the particle spatial distribution and the flow coherent structures. In Couette flow, particles are pulled away from walls by turbulent ejection and towards the wall by the sweep events. On average, they are more present in the sweep and core regions in Couette flow. In channel flow, the particles are accumulated in the ejection region, near the wall. This can be understood as follows: the inertial lift force drives the particles to be preferentially located near the walls, where high and low speed flow regions are encountered. Sweeps are regions of spanwise divergence near the
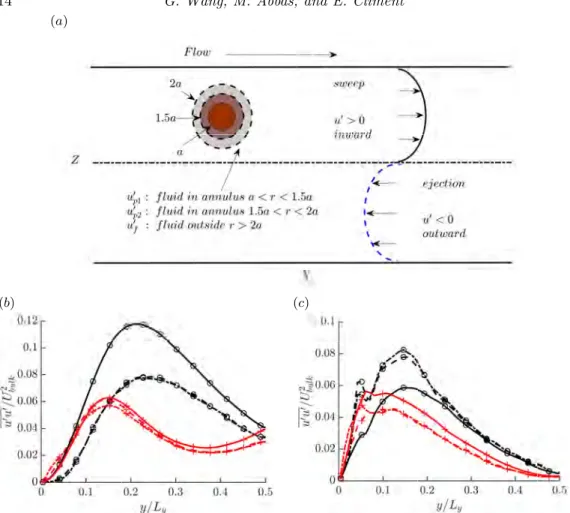
Figure 7. Velocity rms of single and two phase flows in different quadrants. (a − c) are from Couette flow. (d − f ) are from channel flow. The line style denotes the quadrant, Q1, Q2, Q3, Q4. The symbol refers to the flow concentration: open circle for single-phase flow and filled circle for φ = 5%. (a, d), (b, e) and (c, f ) show −u0v0, u0u0 and v0v0, respectively.
wall which drives the particles to leave the high speed (sweep) region towards low speed (ejection) region. When a particle is dragged away from the wall by an ejection event, there is an opposite hydrodynamic contribution that reduces this effect. Lubrication force acting on a particle moving away from a flat wall is attractive to the wall (and decreases as the particle is far from the wall). The resulting particle migration should depend on the particle size and the distance from the wall. Thus the outward wall-normal flow in the ejection region is most probably inefficient to pull the neutrally buoyant particles, leading to particle accumulation in that region.
The profiles of the fluid, particle and slip velocity (fluid velocity minus particulate phase velocity) are shown in figures 6(c, d). Also, the spanwise variation of the slip velocity is shown in this figure. The velocity of the particulate phase is always smaller than the local fluid velocity in both Couette and pressure-driven flow configurations (on average particles are lagging the flow), especially near the walls, in both flow configurations.
4.2. Quadrant analysis of velocity rms
The coherent structures are the major contributions to the Reynolds shear stress. They play an essential role in the active motion of wall turbulence. According to the quadrant analysis, the flow fluctuations can be divided into Q1(u0 > 0, v0 > 0), Q2(u0< 0, v0 > 0), Q3(u0< 0, v0 < 0) and Q4(u0 > 0, v0 < 0). Q2 and Q4 correspond to the ejection and sweep events respectively, Q1 and Q3 contain the outward and inward interactions respectively (see a recent review on quadrant analysis by Wallace(2016)).
(b) (c)
Figure 8. As sketched in (a), the velocity rms of single and two phase flows in Q2 and Q4 are split into contributions near the particle surface (u0
p1u0p1 within a < r < 1.5a using dot-dashed lines and u0
p2u0p2 within 1.5a < r < 2a using dashed lines), and far from the particle surface (u0
fu 0
f within r > 2a using solid lines). The profiles in (b) and (c) are from Couette and channel flow respectively. Here the circle corresponds to the ejection and the plus to the sweep events.
We give details on the impact of particles on the different Reynolds stress components, by considering separately the different contributions according to the quadrant analysis. The rms velocity profiles are displayed in figure7, according to the quadrant analysis, both for single-phase and suspension flow at Φ = 5%. The Reynolds stress components are not significantly influenced when particles are present in Couette flow at 5% (figures 7(a-c)). However in channel flow, profiles of the Reynolds shear stress (figure 7(d)) reveal that the particles enhance significantly the shear stress in the sweep (Q4) part of the logarithmic region, where Q2 and Q4 events are dominant. The streamwise Reynolds stress is decreased by the particles, especially in the ejection regions, whereas the wall-normal Reynolds stress is increased in both sweep and ejection regions. The peak of the profiles are also closer to the wall.
These turbulent stress modifications suggest a more isotropic turbulence in a channel flow compared to a single-phase flow (in agreement with previous numerical results
obtained using the total profiles of the Reynolds stress components (see Loisel et al. 2013; Shao et al. 2012; Picano et al. 2015; Yu et al. 2016; Fornari et al. 2016), the transfer between different directions being promoted by the Reynolds shear stress. A particular attention is drawn here to the reduction of streamwise Reynolds stress component.Fornari et al.(2016) related this observation to the fluid squeezed between the layer of particles near the wall and the wall itself.Shao et al.(2012) associated this with the weakening intensity of the large-scale streamwise vortices which phenomena is not observed in Fourier space as shown later in figure 10(d) and figures 9(e, f). In an attempt to understand why the streamwise Reynolds stress is decreased, we calculated the velocity fluctuations in the fluid far from and close to the particles separately, as sketched in figure 8(a). u0
fu0f is averaged within the fluid region located at r > 2a
relatively to each particle center. u0
p1u0p1 and u0p2u0p2 is averaged in the neighborhood
of the particles a < r < 1.5a and 1.5a < r < 2a, respectively. The profiles of u0fu0f, u0p1u0p1 and u0p2u0p2 are plotted in different quadrants in figures 8(b,c). The profiles in figure 6 indicate only the intensity of the events, and not their contribution to the total suspension flow fluctuations. Thereby they do not give an indication on the flow modulation by the particles, but they allow describing the particle behavior compared to that of the fluid. In the sweep region, the velocity fluctuations near the particles and far from the particles (r¿2a) are almost the same. In the ejection region, the difference in the velocity fluctuations depends on the flow configuration. On the one hand in Couette flow, the particle velocity fluctuations are well below the fluid fluctuations. This should not have an a significant impact on the overall suspension since particles are rarely located in that region. On the other hand in pressure-driven flow, the particles are preferentially accumulated in the ejection region, where their velocity fluctuations are stronger than that of the fluid.
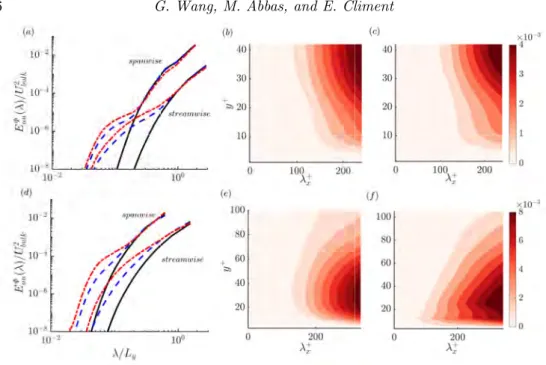
4.3. Energy spectra The average streamwise energy spectrum EΦ
uuis plotted in figures9(a, d) as a function
of both streamwise and spanwise wavelengths, for both suspension and single-phase flows. One advantage of FCM is that particles are represented in the fluid equations by smooth Gaussian envelope forcing, making this method well suited for spatial Fourier analysis of mixture flow.
Figures 9(a, d) display the energy spectra in both flow configurations and for both streamwise and spanwise wavenumbers averaged over the whole domain. Particles strengthen the energy of the flow structures at intermediate scales especially in the streamwise direction of the channel flow. Moreover, particles hardly affect the energy of the large scale structures of wavelength 3h < λx < 5.7h in Couette flow whereas
particles increase the energy contained in h < λx< 3.1h for channel flow. Note that the
energy of fluctuations at small scales in two-dimensions (λx< dp and λz< dp) might be
over-estimated by the numerical method. However, the energy contained in these scales obtained from two-dimensional modal analysis, is 10−7% (resp. 10−4%) of the energy of the largest scales in Couette (resp. channel) flow, and therefore the errors introduced from small scales on the analysis of energy spectra can be neglected.
The energy spectra in the streamwise direction are plotted as a function of the wall-normal position in figures9(b, c, e, f). It is interesting to note in figures9(b, c) that the most energetic large scale motion in Couette flow is found in the range 20 < y+< 40
Figure 9. Top panels: Couette flow; Bottom panels: channel flow. (a) and (d) show the one-dimensional streamwise and spanwise wavenumber energy spectra of the streamwise velocity Euuaveraged in the wall-normal direction. In (a) C500−0; C500−5; C500−10. In (d) P 2600 − 0; P 2600 − 5; P 2600 − 10. Contour figures show the two-dimensional contours of the energy spectra. (b) and (e): single-phase flow with C500 − 0 and P 2600 − 0. (c) and (f ): two-phase flow with C500 − 5 and P 2600 − 5.
slightly shrinked towards the Couette center by the particle presence.
In channel flow the most energetic flow structures (h < λx < 3h) are located at
10 < y+ < 50 as shown in figures9(e, f). Contrary to Couette flow, finite-size particles
in channel flow enhance the strength of moderate streamwise vortices in comparison with single-phase flow. The energy of these streamwise vortical structures subsequently increases the flow velocity gradient near the wall as will be shown in figure 10. The energy modulation near the walls (y+ < 20) is due to the interaction of the particles with the streaks rather than their interaction with the large scale vortices. Two indirect evidences may support this conclusion. First, particles in Couette flow do not generate significant modulation near the walls (y+ < 20) in figure 9(c) when particles are in
large scale vortices. Second, in channel flow we also observe the generation of vortical energetic structures when particles are seeded in the bottom wall only with artificial streaks (as shown in figure4(c)).
5. Modification of the regeneration cycle by particles
The period of the regeneration cycle can be identified from the low frequency evolution of the friction coefficient signal or Reynolds shear stress. First the effect of the particles on the intermittency of the flow will be characterized by considering the fluctuation in time of the friction coefficient and Reynolds shear stress. Second their impact on the successive sub-processes of the regeneration cycle will be qualitatively detailed in the
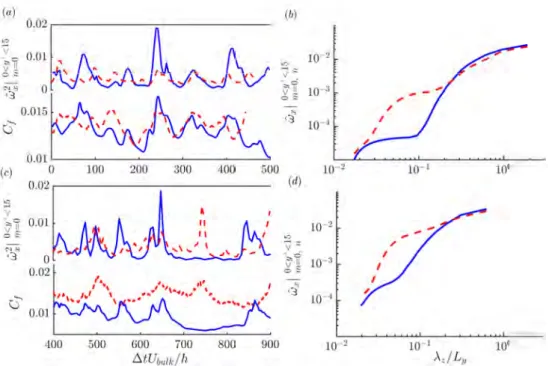
Figure 10. Simultaneous temporal evolution of the friction coefficient Cf and the near wall streamwise vorticity, in Couette flow ((a) and (b)), and channel flow ((c) and (d)). (a) and (c) plot the summation of the amplitude square of x-independent vortices (m = 0) in different spanwise wavenumbers (1 6 n 6 Nz/2) and integrated in the near wall region (y+ < 15). (b) and (d) show x-independent vortices (m = 0) in the near wall region (y+ < 15) as a function of spanwise wavelength (2Lz/Nz 6 λz 6 Lz). The line style indicates single-phase (solid) and two-phase (dashed line) flows. In (a) and (b): C500 − 0; C500 − 5, in (c) and (d):
P 2600 − 0; P 2600 − 5.
following sub-sections, considering (I) the lift-up mechanism yielding streak formation, (II) the modal analysis of flow velocity fluctuations for its indication on the correlation between the x-dependent (m > 0 and n > 0) and x-independent (m = 0 and n > 0) streaks and (III) the vorticity stretching and vortex regeneration.
5.1. Wall friction coefficient and streamwise vorticity
The friction coefficient is a dimensionless measure of the wall shear stress. The temporal evolution of the friction coefficient is displayed in figure 10. For Couette flow, the average friction coefficient and temporal fluctuations are slightly increased by the presence of particles, whereas for channel flow the increase of the average friction coefficient is more significant, and the fluctuation amplitude is slightly reduced. The increase of friction coefficient cannot be exclusively related to the increase of the suspension effective viscosity. Indeed the ratio of the time averaged friction coefficient of the suspension to single-phase flow is around 1.4, whereas the viscosity increase due to the particle presence is around 1.14. Recent work from Costa et al.(2016) provided a theoretical prediction of the total suspension drag. Predicted Reτ is 103 based on
suspension viscosity where Reτ is 109 based on DNS in table1.
Jim´enez & Moin (1991) have explicitly shown that the maximum (in time) of the wall shear stress is synchronous with the maximum near-wall vorticity (0 < y+ < 10).
overline indicates the average over time. R = (Cf) 0· ( ˆ|ω|2 x,wall)0 (Cf)rms· ( ˆ|ω| 2 x,wall)rms (5.1) The cross-correlation gives R = 0.51, 0.49, 0.63 , 0.68 for the respective flow configurations C500 − 0, C500 − 5, P 2600 − 0, P 2600 − 5. Clearly, there is a correlation in time between the instantaneous wall friction coefficient and the near-wall streamwise vorticity in all cases. The spectra of near-wall streamwise vorticity ˆ|ω|2x,wall are shown in figures10(b, d) for both single-phase and suspension flows. The ratio of the vorticity at small scales (λz/Ly < 0.2) to the largest scale streamwise vortices is much smaller in
Couette flow than in channel flow (the ratios are O(0.01) and O(0.1) respectively). In two-phase flows, turbulence becomes more isotropic, because particles inject energy in small scales, which is transferred back to intermediate scales. This is for example the case in the work ofElghobashi & Truesdell(1993), even though the origin of momentum transfer is not the same; there is slip between the phases in their work, whereas in our work the interactions are mainly due to the particle finite-size. The streamwise vorticity is enhanced at low spanwise wavelengths (λz/Ly < 0.2 which corresponds to λz/dp< 4)
in both configurations. The enhancement is of one order of magnitude in Couette flow, and of two orders of magnitude in channel flow.
5.2. Reynolds shear stress
From the investigation of total energy input and dissipation rate, Kawahara & Kida (2001) evidenced the temporal evolution of spatial structures, in a cyclic sequence consistent with the regeneration cycle proposed by Hamilton et al. (1995). A strong ejection event is followed by a gradual decrease of intensity over a certain period of time. The maximum (in time) of the Reynolds stress occurs when the dissipation rate is large along the periodic orbit. The quasi-periodicity of the turbulent events can be represented by the spatial-temporal evolution of the Reynolds stress −u0v0(y, t) across the Couette
gap or channel height, as shown in figure 11. Note that the period of turbulent events is of O(100) time units in both flows. It characterizes the time needed for the velocity fluctuations to become uncorrelated in time. The particle Stokes number which can be based on this time scale is very small compared to the one related to the shear.
For Couette flow, the maximum of the Reynolds stress is located in the center of the gap. The two walls share one buffer layer and a couple of central large scale vortices, with a strong coupling between the streaks near both walls. The low-speed streak near one wall ejects fluid to the other wall acting there as a high-speed streak. It is revealed
Figure 11. Spatiotemporal evolution of the Reynolds shear stress (−u0v0/U2
bulk) averaged in the homogeneous directions (streamwise and spanwise) in (a − d), its average within 5 < y+ < 30 is shown in (e, f ). Left panel is for Couette flow and right panel is for channel flow. (a) and (b) correspond to single-phase flows whereas (c) and (d) correspond to two-phase flows. In (e), C500 − 0 and C500 − 5; In (f ), P 2600 − 0 and P 2600 − 5.
by figures 11(a, c, e) that neutrally buoyant particles have a negligible effect on both the intensity and intermittency of the Reynolds stress in Couette flow configuration (Wang et al. 2017). The channel flow contains log-law region and the central region is ruled by the velocity-defect law. Figure 11(b) shows that the strongest shear stress bursts are located close to the channel walls, and that the frequency of these bursts is of the same order of magnitude as in Couette flow. In the presence of neutrally buoyant particles, the intensity of the Reynolds shear stress is enhanced as shown in figure11(d), and the frequency of these events is decreased as shown in figure11(f). The increase of Reynolds shear stress is closely correlated with the sweep events as indicated in figure 7(d), making the friction coefficient and Reynolds shear stress fluctuations synchronous.
5.3. Streak formation: the lift-up mechanism
The streaks form on both sides of a vortex. Low-speed fluid is lifted-up away from the wall by the vortex into a region of higher-speed fluid, producing a low-speed streak, while on the other side of the vortex, high-speed fluid is pushed towards the wall, creating a high-speed streak.Ellingsen & Palm(1975) have shown, using a linear stability analysis that the x-independent streamwise perturbations grow linearly in time as −v(du/dy)t (the so-called lift-up effect), making any shear flow u(y) unstable to x-independent
Figure 12. Spatiotemporal evolution of the lift-up term (−vdu/dy) scaled by Ubulk2 /h. The green isoline of the Reynolds shear stress (−u0v0/U2
bulk) are added on the top of these figures, the interval in (a) and (c) is 0.003, and the interval in (b) and (d) is 0.005. Left panel is for Couette flow and right panel for channel flow. (a) and (b) stand for single-phase flows. (c) and (d) stand for two-phase flows. Its average within 5 < y+ < 30 is shown in (e, f ). (e), C500 − 0 and C500 − 5; (f ), P 2600 − 0 and P 2600 − 5.
(transverse) perturbations. Consequently in shear flows, the main linear mechanism for transient disturbance growth is the lift-up effect that produces high and low speed streaks in the streamwise velocity. Bech et al.(1995) stated that the inner shear layer is formed through the lift-up of low-speed streaks from the viscous sublayer, then the shear layers are coupled to an instantaneous velocity profile with inflectional character and they have been observed to become unstable and break up into chaotic motion, so called ‘bursting’. The lift-up effect or advection was identified as a robust mechanism for generation of the streaky motions both in transitional and turbulent flows (Ellingsen & Palm 1975; Hamilton et al. 1995;Del ´Alamo & Jimenez 2006).
Klinkenberg et al.(2013) have shown that small pointwise inertial particles do affect the transition to turbulence not by altering the lift-up effect but rather by modifying the dynamics of the oblique waves necessary for the streaks regeneration and breakdown. In order to show whether finite-size particles modify the lift-up term, the contours of −vdu/dy are displayed in figure12together with the isolines of the Reynolds shear stress (from figure11). The lift-up term is important near the walls in both flow configurations. For Couette flow, the contours shown in figures 11(a, c) are not significantly modified by the presence of the particles. Based on figures11(a, c) which plot the averaged value
Figure 13. Modal decomposition as in (4.1): is mode M (0, β); is mode M (α, 0). (a) Couette flow in the whole domain, (b) Channel flow in the whole domain, (c) and (d) stand for channel flow in the upper half domain and bottom half domain. In (a), black is C500 − 0 and red is C500 − 5. In (b), (c) and (d), black circle is P 2600 − 0 and red disc is P 2600 − 5.
within 5 < y+ < 30, we can oberve that the strongest effects are nearly the same with
or without particles whereas the weakest effects are enhanced by the particles. However in channel flow within the buffer layer (5 < y+ < 30), the particles not only enhance
the lift-up significantly, but also let it act continuously (lift up effect is less frequent in suspension flow as shown in figure11(f)).
5.4. Streak breakdown: Modal decomposition of the fluctuating energy
The subsequent process is the instability of x-independent streaks, the so-called streak breakdown. Hamilton et al. (1995) have shown that it is the instability of the streaks (through a non linear process) which causes breakdown. We investigated the temporal evolution of the energy contained in the dominant flow fluctuation modes, since it can give evidences on the dynamics of the streak breakdown process, and on the particle modulation of this process.
The temporal evolution of the most energetic modes is shown in figure 13. In figures 13(a, b), (4.1) is integrated between the two walls (Y1 = 0 and Y2 = Ly), whereas in
figures 13(c, d), the integration is performed in the vicinity of one single wall which is regarded as an individual shear layer (Y1 = 0 → Y2 = Ly/2 near the bottom wall,
and Y1 = Ly/2 → Y2 = Ly near the upper wall). The quasi-periodic fluctuations of
these modes, with period ∼ 100h/Ubulkfor Couette flow, are related to the regeneration
cycle. The strongest mode is M (0, β) which corresponds to x-independent streaks. As a general trend, neutrally buoyant particles decrease the amplitude of the fluctuations of this mode, whereas they do not have significant impact on its period, which is related to the regeneration cycle. However in channel flow, it can be noted that both (0, β) mode and (α, 0) mode are of the same strength and period compared between single with two-phase flow.
particle presence as shown in figure13(a).
For channel flow, figure 13(b) shows higher frequency fluctuations than in Couette flow, and less correlation between (α, 0) and (0, β) modes, when integrated over the whole domain. This is due to two coexisting shear layers (one at each wall) which are relatively independent of each other (turbulent mixing is weak in the core region between the two shear layers at low Reynolds number). When the modal energy is integrated over half of the channel section shown in figures13(c, d), one can notice a stronger correlation between (0, β) mode and (α, 0) mode, like in Couette flow, although it is less pronounced in channel flow. The particles do not have a strong effect on the temporal evolution of these modes, suggesting that particles do not significantly alter the breakdown process.
5.5. Vortex regeneration: Non linear interaction and vortex stretching
During streak breakdown, a complex set of interactions re-enforces the streamwise vortices, leading to the formation of a new set of streaks, and completing the regeneration cycle. Hamilton et al.(1995) proposed that the vortex strengthening is due to interac-tions among the α-modes, that grow during the streak breakdown. Schoppa & Hussain (2002) suggested that the vortex formation is inherently three-dimensional, with a direct stretching (inherent to streak (x, z)-waviness) of the near-wall ωxsheets, leading to the
collapse of streamwise vortices. They provided insights into the dynamics of near-wall vortex formation through the inviscid balance of the streamwise vorticity:
∂ωx ∂t = −u ∂ωx ∂x −v ∂ωx ∂y − w ∂ωx ∂z | {z } advection + ωx ∂u ∂x | {z } stretching +∂v ∂x ∂u ∂z − ∂w ∂x ∂u ∂y | {z } tilting (5.2)
In fully developed turbulence, the greatest contribution, in magnitude, to the temporal evolution of the vorticity ∂ωx/∂t comes from the tilting term. This is confirmed by our
simulations (not shown here). HoweverSchoppa & Hussain(2002) have stated that this term contributes to the thin tail of the near-wall ωx layer, and is not responsible of
the formation of x-independent streamwise vortices ((0, β) mode in miniunit). Instead, the vortex formation is dominated by the stretching of the streamwise vorticity. The local ωxstretching is sustained in time and is mainly responsible for the vortex collapse,
whose location coincides with the +ωx∂u/∂x peak. The streak meandering provides the
generation of ∂u/∂x. Then direct stretching of positive and negative ωxoccurs in regions
where ∂u/∂x is generated across the wavy streak flanks during the streak breakdown process. The stretching term is active only during the peaks of the cycle when local three-dimensionality is induced after streak breakdown (seeJim´enez & Moin 1991).
Figure 14. Evidence of the particle influence on the vorticity stretching in channel flow. Left panels are for single-phase flow P 2600−0, and right panels are for suspension flow P 2600−1. (a) and (b) show the evolution in time of both the circulation and the vorticity stretching | ωx∂u/∂x |. Both are averaged within the region 0.1 < y/Ly < 0.4 where large scale vortices take place as seen in figure5(b). (c − f ) show the streamwise velocity fluctuations in the plane y/Ly= 0.2, using for negative isolines and for positive isolines, with a step equal to 0.04. The contours indicate the stretching term ωx∂u/∂x. The instants corresponding to the different snapshots are marked in figures (a) and (b). (c) and (d) correspond to a trough of the vorticity stretching whereas (e) and (f ) correspond to a peak of the vorticity stretching.
In our previous paper (Wang et al. 2017), we have shown that the streak waviness and vorticity stretching are almost unchanged for Couette flow in the presence of neutrally buoyant particles. However in channel flow, the particles have some impact. Figures 14(a-b) show the temporal evolution of the circulation as well as the vorticity stretching term, both for single- and two-phase channel flows. The vorticity stretching (averaged value is 0.17 (resp 0.11) for P 2600 − 1 (resp P 2600 − 0)), and the circulation (averaged value is 0.025 (resp 0.02) for P 2600 − 1 (resp P 2600 − 0)), are both enhanced near the channel walls due to the presence of particles. The cross-correlation between them was calculated, like in (5.1), giving 0.576 for P 2600 − 0 and 0.624 for P 2600 − 5. This shows that high flow circulation is synchronized with the appearance of x-dependent flow structures. Figures 14(c-f) show instantaneous snapshots containing the contours of the streamwise velocity fluctuations (that illustrate the streak shape), as well as the vorticity stretching. These snapshots are taken at high vorticity stretching (high flow circulation). They show a clear evidence that non-linear processes like streak breakdown, and thereby vortex regeneration, take place in the suspension flow like in the single-phase flow. They also show that the wavy streaks are smaller and more numerous in suspension flow, when compared to the single-phase flow.
6. Concluding remarks
We have studied turbulent suspension flows in plane Couette and pressure-driven (channel) configurations, slightly above the laminar-turbulent transition. The fundamental difference between both flows, for weak turbulence, is due to the shear layers.
of the flow response in Couette and channel configurations, when particles are added, is essentially correlated to the particle spatial distribution. In Couette flow, the streak generation from large scale rolls is a very robust mechanism in single phase flow. For example when the streaks were removed from fully-developed turbulence, the streaks in single phase flow were immediately regenerated (see Hamilton et al. 1995). When particles were added to the flow from which the streaks have been removed (weak turbulence in Couette), the flow could hardly recover the turbulence features in time if the particles were seeded in the large scale rolls. However, the streaks were regenerated if the particles were seeded initially within the streaks and forced (artificially) to stay there. On the contrary in channel flow, the artificial streak we used is known to damp over time if the flow is particle-free (Schoppa & Hussain 2002). Whenever particles were added in that structure (even at low overall concentration), the energy of this artificial streak grew, leading to transition. If the particles were randomly seeded (with the same average concentration), the flow became laminar.
In the turbulent regime, detailed temporal and spatial analysis, in physical and Fourier spaces, were proposed. The statistics on the flows laden with particles were formed at effective Reynolds number 40% to 50% larger than the critical effective Reynolds number for both flows (”effective” means that the additional dissipation due to the presence of the particles is taken into account in the suspension flow viscosity). Particles did not modify significantly the features of plane Couette flow, whereas they had a clear impact on channel flow. The particle spatial distribution was found to be non-uniform over the cross-section. Particles were more present in the core of the large scale rolls (inactive motion) in Couette flow, and in the ejection (active motion) regions in channel flow. This finding is essentially related to wall-normal inertial lift forces (on finite-size particles) that act in opposite directions depending on the flow configuration.
Contrary to Couette flow, the accumulation of particles in the active region of turbulence regeneration for the channel flow configuration yielded clear modifications of the flow statistics and dynamical response. We observed a reduction of streamwise velocity rms and an increase of the wall-normal component. The wall shear stress was also significantly increased because particles had reinforced the activity of larger scale x-independent streamwise vortices near the walls.
The regeneration cycle of wall turbulence has been studied in presence of particles. Despite the universality of wall turbulence, the Couette flow is constituted of a single shear layer whereas channel flow has two shear layers with opposite signs, leading to different flow response to perturbations. The three successive sub-steps of the regeneration cycle were modified by finite-size particles, since they actively contribute to the dynamics of the buffer layer. We observed an enhancement of the lift-up mechanism
together with reinforced Reynolds shear stress (although the frequency of burst events was decreased). Vorticity stretching was increased leading to smaller and more numerous wavy streaks for pressure-driven two-phase flow. Thanks to their preferential presence near the walls, particles triggered small scale vortices that were stretched by the shear flow and survived even at Reynolds numbers below the transition limit of single-phase flow. By studying two distinct turbulent flow configurations laden with neutrally buoyant finite-size particles, we were able to show the specific response of turbulent structures and the modulation of the fundamental mechanisms composing the regeneration cycle of near-wall turbulence.
7. Acknowledgement
This work was granted access to the HPC resources of CALMIP under the allocation 2015 and 2016-P1002 and of GENCI under the allocation x20162b6942. We are grateful to COST Action MP1305 on Flowing Matter. Great help from A. Pedrono for technical support on JADIM is also acknowledged.
REFERENCES
Asmolov, E. S. 1999 The inertial lift on a spherical particle in a plane poiseuille flow at large channel reynolds number. J. Fluid Mech. 381, 63–87.
Bech, K. H., Tillmark, N., Alfredsson, P. H. & Andersson, H. I. 1995 An investigation of turbulent plane couette flow at low reynolds numbers. J. Fluid Mech. 286, 291–326. Bellani, G., Byron, M. L., Collignon, A. G., Meyer, C. R. & Variano, E. A. 2012 Shape
effects on turbulent modulation by large nearly neutrally buoyant particles. J. Fluid Mech. 712, 41–60.
Bradshaw, P. 1967 ’inactive’ motion and pressure fluctuations in turbulent boundary layers. J. Fluid Mech. 30 (02), 241–258.
Climent, E. & Maxey, M. R. 2009 The force coupling method: a flexible approach for the simulation of particulate flows. inserted in ‘Theoretical Methods for Micro Scale Viscous Flows’, Ressign Press, Eds F. Feuillebois and A. Sellier.
Costa, P., Picano, F., Brandt, L. & Breugem, W.-P. 2016 Universal scaling laws for dense particle suspensions in turbulent wall-bounded flows. Phys. Rev. Lett. 117 (13), 134501. Del ´Alamo, J. C. & Jimenez, J. 2006 Linear energy amplification in turbulent channels. J.
Fluid Mech. 559, 205–213.
Elghobashi, S. & Truesdell, G. 1993 On the two-way interaction between homogeneous turbulence and dispersed solid particles. i: Turbulence modification. Phys. Fluids A 5 (7), 1790–1801.
Ellingsen, T. & Palm, E. 1975 Stability of linear flow. Phys. Fluids 18 (4), 487–488. Fornari, W., Formenti, A., Picano, F. & Brandt, L. 2016 The effect of particle density
in turbulent channel flow laden with finite size particles in semi-dilute conditions. Phys. Fluids 28 (3), 033301.
Hamilton, J. M., Kim, J. & Waleffe, F. 1995 Regeneration mechanisms of near-wall turbulence structures. J. Fluid Mech. 287, 317–348.
Ho, B. & Leal, L. 1974 Inertial migration of rigid spheres in two-dimensional unidirectional flows. J. Fluid Mech. 65 (02), 365–400.
Jim´enez, J. 2011 Cascades in wall-bounded turbulence. Annu. Rev. Fluid. Mech. 44 (1), 27. Jim´enez, J. & Moin, P. 1991 The minimal flow unit in near-wall turbulence. J. Fluid Mech.
225, 213–240.
Jim´enez, J. & Pinelli, A. 1999 The autonomous cycle of near-wall turbulence. J. Fluid Mech. 389, 335–359.
Kawahara, G. & Kida, S. 2001 Periodic motion embedded in plane couette turbulence: regeneration cycle and burst. J. Fluid Mech. 449, 291–300.
Majji, M. V., Banerjee, S. & Morris, J. F. 2018 Inertial flow transitions of a suspension in taylor–couette geometry. J. Fluid Mech. 835, 936–969.
Matas, J.-P., Morris, J. F. & Guazzelli, E. 2003 Transition to turbulence in particulate pipe flow. Phys. Rev. Lett. 90, 014501.
Matas, J.-P., Morris, J. F. & Guazzelli, E. 2004 Lateral forces on a sphere. Oil Gas Sci. Technol. 59 (1), 59–70.
Orlandi, P. & Jim´enez, J. 1994 On the generation of turbulent wall friction. Phys. Fluids 6 (2), 634–641.
Panton, R. L. 2001 Overview of the self-sustaining mechanisms of wall turbulence. Prog Aerosp Sci 37 (4), 341–383.
Papavassiliou, D. V. & Hanratty, T. J. 1997 Interpretation of large-scale structures observed in a turbulent plane couette flow. Int. J. Heat Fluid Flow 18 (1), 55–69.
Picano, F., Breugem, W.-P. & Brandt, L. 2015 Turbulent channel flow of dense suspensions of neutrally buoyant spheres. J. Fluid Mech. 764, 463–487.
Qureshi, N. M., Bourgoin, M., Baudet, C., Cartellier, A. & Gagne, Y. 2007 Turbulent transport of material particles: an experimental study of finite size effects. Phys. Rev. Lett. 99 (18), 184502.
Schoppa, W. & Hussain, F. 2002 Coherent structure generation in near-wall turbulence. J. Fluid Mech. 453, 57–108.
Shao, X., Wu, T. & Yu, Z. 2012 Fully resolved numerical simulation of particle-laden turbulent flow in a horizontal channel at a low reynolds number. J. Fluid Mech. 693, 319–344. Stickel, J. J. & Powell, R. L. 2005 Fluid mechanics and rheology of dense suspensions.
Annu. Rev. Fluid. Mech. 37, 129–149.
Subramanian, G., Koch, D. L., Zhang, J. & Yang, C. 2011 The influence of the inertially dominated outer region on the rheology of a dilute dispersion of low-reynolds-number drops or rigid particles. J. Fluid Mech. 674, 307–358.
Townsend, A. A. 1980 The structure of turbulent shear flow . Cambridge university press. Tuerke, F. & Jim´enez, J. 2013 Simulations of turbulent channels with prescribed velocity
profiles. J. Fluid Mech. 723, 587–603.
Waleffe, F. 1997 On a self-sustaining process in shear flows. Phys. Fluids 9 (4), 883–900. Wallace, J. M. 2016 Quadrant analysis in turbulence research: History and evolution. Annu.
Rev. Fluid. Mech. 48, 131–158.
Wang, G., Abbas, M. & Climent, E. 2017 Modulation of large-scale structures by neutrally buoyant and inertial finite-size particles in turbulent couette flow. Phys. Rev. Fluids 2 (8), 084302.
Yu, W., Vinkovic, I. & Buffat, M. 2016 Finite-size particles in turbulent channel flow: quadrant analysis and acceleration statistics. J Turbul 17 (11), 1048–1071.
Yu, Z., Wu, T., Shao, X. & Lin, J. 2013 Numerical studies of the effects of large neutrally buoyant particles on the flow instability and transition to turbulence in pipe flow. Phys. Fluids 25 (4), 043305.