HAL Id: hal-01688413
https://hal.archives-ouvertes.fr/hal-01688413
Submitted on 7 Nov 2018
HAL is a multi-disciplinary open access
archive for the deposit and dissemination of
sci-entific research documents, whether they are
pub-lished or not. The documents may come from
teaching and research institutions in France or
abroad, or from public or private research centers.
L’archive ouverte pluridisciplinaire HAL, est
destinée au dépôt et à la diffusion de documents
scientifiques de niveau recherche, publiés ou non,
émanant des établissements d’enseignement et de
recherche français ou étrangers, des laboratoires
publics ou privés.
Surface properties evolution of attapulgite by IGC
analysis as a function of thermal treatment
Lilya Boudriche, Rachel Calvet, Boualem Hamdi, Henri Balard
To cite this version:
Lilya Boudriche, Rachel Calvet, Boualem Hamdi, Henri Balard. Surface properties evolution of
atta-pulgite by IGC analysis as a function of thermal treatment. Colloids and Surfaces A: Physicochemical
and Engineering Aspects, Elsevier, 2012, 399, pp.1-10. �10.1016/j.colsurfa.2012.02.015�. �hal-01688413�
Surface properties evolution of attapulgite by IGC analysis as a function of
thermal treatment
Lilya Boudriche
a,b,∗, Rachel Calvet
c, Boualem Hamdi
b, Henri Balard
d aCentre de Recherche Scientifique et Technique en Analyses Physico-Chimiques (C.R.A.P.C), BP 248, Alger Rp, 16004 Alger, AlgeriabLab. d’Etude Physico-Chimique des Matériaux et Application à l’Environnement, Fac. de Chimie, USTHB, BP 32 El Alia, Bab Ezzouar, 16111 Alger, Algeria cUniversité de Toulouse, Mines Albi, CNRS, Centre RAPSODEE, Campus Jarlard, F-81013 Albi Cedex 09, France
dLab. Chimie Physique, ENSISA-W, 11, rue Werner, 68093 Mulhouse Cedex, France
Keywords: Attapulgite Palygorskite Thermal treatment Surface properties Analysis techniques Inverse gas chromatography
a b s t r a c t
At low temperatures, thermal treatment of attapulgite clay causes a loss of mass due to the elimination of linked, zeolitic and crystallized water molecules. At high temperatures, there is a junction of particles until total melting of the attapulgite fibers. This transformation reduces significantly the volume of the porous network resulting in the drop in the value of specific surface area and causing important changes in the textural, structural and surface properties of the raw attapulgite. The inverse gas chromatography shows sensitivity of the attapulgite sample to the effect of temperature through the decrease of the dispersive component of the surface energy !d
s. The evolution of the nanomorphological index, a measurement of the surface nanorugosity, follows the appearance of surface roughness on carbonates with the increase of the temperature. The surface heterogeneity, determined by calculating the distribution functions of adsorption energies also underlines the morphology changes and the formation of new phases under the effect of temperature.
1. Introduction
Clays are used in various application areas such as ceramic, paper, paint, adsorbent, catalyst, etc.[1–3]. However, it is know that clay minerals are materials sensitive to thermal stress, and may undergo many changes with a consumption or release of energy with or without loss of mass. In this context, many studies were
made to assess to the thermal transformations of some clays[4–9].
Our study investigates the changes, under temperature effect, of a fibrous clay from Algerian origin, called “attapulgite”. Although the dehydration and dehydroxylation of the attapulgite clays were
studied in detail by thermogravimetric techniques [10–12], but
there is no previous study on the evolution of surface properties of the solid after heat treatment. So, in this study, we focused on studying the evolution of surface properties of attapulgite by imple-menting a well-established analytical technique, the inverse gas
chromatography[13–18]already used after acid treatment of the
same solid[19]. It must be notice that only few studies by inverse
gas chromatography were conducted on heat treated clays. We can
∗ Corresponding author at: Centre de Recherche Scientifique et Technique en Analyses Physico-Chimiques (C.R.A.P.C), BP 248, Alger Rp, 16004 Alger, Algeria. Tel.: +213 696521747; fax: +213 21247406.
E-mail addresses:boud lil@yahoo.fr(L. Boudriche),calvet@mines-albi.fr
(R. Calvet),bhamdi 99@yahoo.fr(B. Hamdi),h.balard@wanadoo.fr(H. Balard).
quote the works of Brendlé[20]who used IGC to follow the
sur-face properties variations that occur when goethite transforms into hematite upon heat treatment.
Another study made by Hamdi[21]on a bentonite allows to note
that the dispersive component of the surface energy (!d
s) slightly
increases for heat treatments less than 300◦C. The increase can
be attributed to the elimination of the physically adsorbed water molecules and molecules present between lamellar sheets of the
montmorillonite which let appear free active sites. Beyond 300◦C,
the values of the !d
s decrease significantly because the lamellar
system of the montmorillonite is completely destroyed. 2. Theoretical part
Inverse gas chromatography (IGC) is an extension of conven-tional analytical gas chromatography. It permits, whatever the nature of the solid examined in the chromatographic column, to obtain information about its surface properties.
Depending on the amount of injected probe, the IGC can be
divided into two modes: infinite dilution (IGC-ID)[22]and finite
concentration (IGC-FC)[23,24].
2.1. Inverse gas chromatography at infinite dilution (IGC-ID) The inverse gas chromatography at infinite dilution (IGC-ID) involves the injection of very small amounts of probe molecules
(at the limit of detector sensitivity) in order to consider only the interactions between the solid-surface and an isolated probe. The IGC-ID gives different information according to the nature of the injected probe.
2.1.1. The dispersive component of the surface energy (!d
s)
This parameter indicates the ability of the solid surface to have non-specific interactions with probe molecules. Experimentally, the plot of the variation of the adsorption free energy versus the number of carbon atoms for an alkanes series leads to a straight line and from its slope is calculated the Gibbs energy adsorption of a methylene group "GCH2
a . The !sdis then calculated from the
Dorris and Gray[25]relation:
!d s =
!
"GCH2 a"
2 4N2a2 CH2!CH2 (1) where !ds the dispersive component of the surface energy (mJ/m2),
Nthe Avogadro’s number, aCH2the molecular area of one methylene
group (0.06 nm2), !
CH2the surface energy of polyethylene (!CH2 =
35.6 + 0.058(293 − T)) (mJ/m2).
2.1.2. The nanomorphological index IM(#t)
Established by injecting branched or cyclic alkanes, this value delivers information about the regularity of the solid surface at the scale of the injected probe. Indeed, accessibility to the sur-face of a solid depends strongly on the probes encumbrances (cyclic and branched probe) and the surface roughness of the analyzed solid can be due to the existence of a porosity in the particles or to a superposition of two crystal planes which reveals structural defects giving to the surface a roughness at the
nanoscale. The nanomorphology index IM(#t)[22]for a branched
or cyclic alkane is obtained by application of the following Eq.(2):
IM(#t) = e−"GM
a/RT (2)
where −"GM
a is the departure of the representative point of the
bulky alkane from the reference n-alkane straight line. 2.1.3. The specific component of the surface energy (Isp)
Specific interactions include all types of interactions except the
dispersive ones; they are obtained by injecting polar probes[22].
The difference between the global free energy of the injected polar probe and the straight line of alkanes probes represents the contri-bution of specific interactions "Gsp
a also noted Isp:
"Ga= "Gda+ "Gasp (3)
It can be noticed that to calculate the IM(#t) and the Isp, the
variation of the adsorption free energy is plot versus a
topo-logical index #t proposed by Brendlé [26]based on the Wiener
index.
A limit of IGC-ID is reached for solids having a heterogeneous surface for which only the high energy sites mainly contribute to the retention times. So, IGC-FC can be carried out to overcome this limitation.
2.2. Inverse gas chromatography at finite concentration (IGC-FC) In inverse gas chromatography at finite concentration (IGC-FC), some microliters of liquid probe are injected into the column con-taining the solid to be analyzed, in order to cover approximately with a probe mono-layer the surface of the solid. Then a strong
asymmetric chromatographic peak is obtained when ideal, non-linear conditions are fully fulfilled. Due to the presence of very energetic sites of adsorption, it is quite generally observed that a non-negligible part of the injected probe is not necessary eluted in time for the return of the signal to the initial base line. In order to assess this irreversibly adsorbed amount, the temperature of the chromatograph oven is increased up to the conditioning tem-perature, leading to appearance of a secondary small peak. Then irreversible part of the adsorption phenomena could be assessed from the ratio of the area of thermodesorption peak onto the total
area of the chromatogram and have defined[13]an irreversibility
index (Iirr) according to Eq.(4): Iirr= SrSth
v+ Sth (4)
where Srvthe surface of the main chromatographic peak and Sththe
surface corresponding to the thermodesorption peak. 2.2.1. The elution characteristic point method
Applying “the elution characteristic point method” (ECP) to the reversible isothermal part of the experimental chromatogram, the desorption isotherm of the molecule probe can be obtained from
a single chromatographic peak[23]. The first isotherm derivative
is directly related to the net retention time of each point of diffuse
front of the chromatogram by Eq.(5):
#
∂N ∂P$
L,tr =Dc(trmRT− t0) (5)where for a given characteristic point, N is the number of adsorbed probe molecules, P is the partial pressure of the probe at the output of the column – directly related to the height of the
sig-nal, tris the retention time and t0the retention time of CH4 – a
molecule not retained by the solid surface, Dcthe corrected flow
rate, m the mass of the solid contained in the column, L the column length.
The integration of Eq.(5)gives access to the desorption isotherm
which allows the determination of the Henry’s and the BET con-stants, and of the specific surface area.
But the surface heterogeneity will influenced shape of the des-orption isotherm. Intuitively, the residence times of the adsorbed molecules will depend of the energy of the adsorption site. Hence, the shape analysis of the isotherm will give access to the distribu-tion funcdistribu-tion of the adsorpdistribu-tion energies.
2.2.2. Distribution function of the adsorption energies (DF)
Estimation of the surface heterogeneity of a solid through the adsorption energy distribution function is generally based on a physical adsorption model which admits that the global isotherm may be considered as a sum of local isotherms of adsorption on isoenergetic domains (patchwork model).
Then, the distribution function of the relative abundance of each type of domain, having the same characteristic energy of interac-tion is given by the following integral Eq.(6):
N(Pm, Tm) = N0
%
εmaxεmin
&(ε, Pm, Tm)#(ε)dε (6)
where N(Pm, Tm) is the number of molecules adsorbed at the pres-sure Pm and temperature Tm of meapres-surement, N0 is the number of molecules needed for the formation of a monolayer, & (ε, Pm,Tm) is the local isotherm, ε is the adsorption energy of a site, and #(ε) is the distribution function (DF) of the sites seen by the probe. The
range of adsorption energies is included between minimal (εmin)
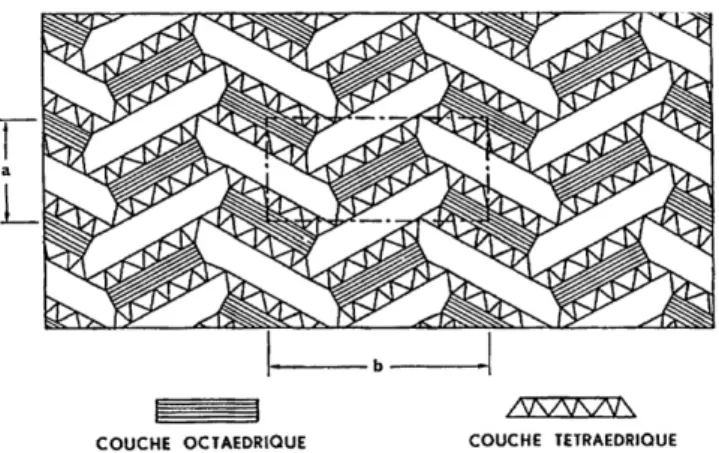
Fig. 1. Polyhedral representation of attapulgite[27].
The resolution of the integral Eq.(6) has been presented by
Balard[24].
3. Materials and methods 3.1. Material
Attapulgite, or palygorskite, is a fibrous Mg–clay, which exhibits
microchannels oriented longitudinally with the fibers (Fig. 1). The
chemical composition of this clay mineral varies within certain
lim-its according to lim-its origin. The main variation is that an A13+cation
can replace Mg2+in the octahedral sheet[12].
The natural attapulgite used in this study was obtained from the Ghoufi’s region, located at the Northeast of Algeria. This clay has a fibrous morphology with presence of cubic inclusions attributed
to carbonates[19]. The raw attapulgite was first coarsely milled
and sieved to obtain a size fraction less than 1 mm allowing easier analysis, measurements, and treatments to be made in laboratory-scale processes.
3.2. Thermal treatment of attapulgite
The heat treatment of the clay was performed by means of a tubular furnace, controlled by a timer-controller type Eurotherm Controls, in a ceramic crucible. The heat treatment was realized in
a temperature range from 100◦C to 1000◦C with a heating rate of
5◦C/min under nitrogen rate flow. After each increase of 100◦C in
temperature, cooling is performed in an inert atmosphere. Only temperatures leading to modifications in the solid proper-ties are commented in this paper.
3.3. Characterization methods
Before IGC analysis, several complementary techniques were used to characterize our samples before and after heat treatment: a. The thermogravimetric analysis (TGA) coupled with differential thermal analysis (DTA) provides information about the mass and enthalpy changes according to a heating rate. The coupling of these two techniques is often used to identify changes in the analyzed material. In our study, the device used was a TG–DTA SETARAM 92-16. Thermal analysis was done with a temperature rise of 5◦C/min from 30◦C to 1000◦C.
b. The dilatometric analysis provides access to dimensional changes of a sample as a function of temperature and time. The analysis was done by means of SETSYS-TMA 18
Setaram dilatometer, from 30◦C to 1000◦C with a ramp of
5◦C/min.
c. The density of the obtained solids was determined by a helium pycnometer (Accupyc 1330-Micrometrics).
d. The specific surface areas, BET constants, meso and micro-pore volumes were determined using nitrogen adsorption at liquid nitrogen temperature (ASAP 2010, Micromeritics) by applying the BET, BJH, and t-plot methods, respectively. The samples were
out gassed at 105◦C for 24 h at a pressure of 6.6 × 10⁻³mbar.
e. The particle morphology was investigated using a scanning elec-tron microscope (Philips XL 30 model ESEM-FEG) operating at 3 kV.
f. For the analysis of silicon, samples were mineralized by alkaline fusion with sodium hydroxide. For the analysis of the following elements: Al, Mg, Ca, Fe, samples were mineralized by wet way in acid media. After mineralization, all the elements were then analyzed by ICP-AES.
g. Phase identification was performed on a Panalytical X’PERT Pro diffractometer (Philips) (CuK! radiation) with a step size of 0.017◦ for 2& angles ranging from 5◦ to 80◦. The 2& values were analyzed with the X’Pert High Score software and com-pared with the ICDD (International Centre for Diffraction Data) database.
h. The IR spectra of activated attapulgite were obtained using a Perkin Elmer 560 Fourier transform infrared (FTIR)
spec-trophotometer with a resolution of 2 cm−1 and a scan number
equal to 64. The spectral study was extended over the range
4000–400 cm−1. The analysis was done on KBr pellets with 1% of
treated sample, using a hydraulic press by applying a pressure of 73.5 kPa.
The IGC measurements were performed with two GC devices (Agilent 7890 A and 6890), fitted with sensitive flame ioniza-tion detectors (FID). Helium was used as the carrier gas with a flow rate of 30 mL/min measured with an electronic flowmeter (Flow500-Agilent). The temperatures of the injector and detector
were respectively 130◦C and 200◦C. The columns were filled with
a mixture of attapulgite powder and glass beads so as to lower the pressure drop (<1 bar) through the columns in order to avoid leaks at fittings.
The IGC-ID study was done with an oven temperature of
130◦C, using stainless steel columns of 20 cm in length, with
6.35 mm in internal diameter. The columns were conditioned
overnight at 150◦C. The probes used were linear alkanes (hexane
C6, heptane C7 and octane C8), a branched alkanes, the 2,3,4-trimethylpentane (2,3,4-TMP) and 2,5-dimethylhexane (2,5-DMH), a cyclic alkane, the cycloctane (cycl8) and polar probes (chloroform and dichloromethane). These probes had a chromatographic grad (>99%) purity.
For IGC-FC, the chromatographic columns were 10 cm in length with 6.35 mm or 3.18 mm in internal diameter. The conditioning
temperature was 130◦C and analysis temperature was depending
on the probe used, according to the Conder criterion[23]which
states that the contribution of probe vapor to the flow of carrier gas does not exceed 5% of the initial flow at the maximum of the chromatographic peak. Three probes were examined in IGC-FC,
the octane (C8) at 53◦C, the isopropanol (IP) at 43◦C and the
1,4-dioxan (DX) at 51◦C. We chosed an apolar probe, octane, to study
the surface morphology and two polar probes to study the sur-face chemistry. These probes had a chromatographic grade (>99%) purity and were placed on a molecular sieve to avoid the water effect. The chromatograms were treated using a home-made soft-ware from the Adscientis Society (Wittelsheim, France).
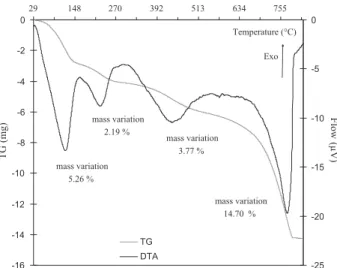
-16 -14 -12 -10 -8 -6 -4 -2 029 148 270 392 513 634 755 Temperature (°C) TG (mg) -25 -20 -15 -10 -5 0 Flow (µV) TG DTA mass variation 5.26 % mass variation 2.19 % mass variation 3.77 % mass variation 14.70 % Exo
Fig. 2. TGA–DTA analysis of attapulgite. 4. Results and discussion
4.1. Thermal analysis 4.1.1. TGA–DTA analysis
TGA–DTA analysis (Fig. 2) indicates that attapulgite undergo
four losses in mass of about 25.93% of the initial mass.
The losses in mass occur respectively in the following ranges:
30–160◦C (5.26%), 160–280◦C (2.19%), 280–550◦C (3.77%) and
650–800◦C (14.70%). The first mass loss is quite quick, and
cor-responds to the removal of bound water (on the surface) and a part of the zeolitic water (located in the channels). The second water loss corresponds to the total elimination of the zeolitic water. Up to
280◦C, the phenomenon is perfectly reversible and the clay behaves
as an excellent absorbent towards water. When the temperature
increases, it causes between 280◦C and 550◦C a slow departure of
crystallized water (coordinated to cations situated along octahe-dral sheets) with an evolution towards a rafter structure. It should be noted that an attapulgite in this state is still able to adsorb
water by capillarity[28]. The fourth water mass loss is produced by
dehydroxylation of Mg–OH groups in attapulgite[10,29]. The
elim-ination of water molecules at these temperatures is accompanied
by a partial destruction of the crystal structure of attapulgite[30].
The release of the carbon hydroxide must be also considered in the
fourth mass loss because beyond 500◦C; the carbonates present in
the attapulgite are thermically unstable and their decomposition releases the CO2[31].
Several authors studied the thermal analysis of this clay [11,32,33]and they observed the mass losses at the same temper-atures.
4.1.2. Dilatometric analysis
Three retractions (volume change) are observed from the dilato-metric analysis (Fig. 3).
The first one occurs between 30◦C and 200◦C, and is due to the
evaporation of bounded and zeolitic water molecules, previously
observed in TGA–DTA analysis (Fig. 2). It is very low, 0.6% of the
initial height (1.75 mm). The second retraction, a little higher than
the first one, 2.8%, happens between 200◦C and 400◦C, it can be
attributed to the evaporation of crystallized water out of the struc-ture of attapulgite. The highest volume change takes place between
750◦C and 900◦C, corresponding in TGA–DTA curve to a mass loss
of 14.7%. In this case, there is a densification of the material and the shrinkage is estimated of about 437.55 "m in the measuring cell, representing 24% of the initial height.
D ila ta tio n ( µm ) -550 -450 -350 -250 -150 -50 1000 800 600 400 200 0 Temperature (°C) Raw attapulgite ΔTMA= -437.55 µm ΔTMA= -49.05 µm ΔTMA= -10.94 µm
Fig. 3. Dilatometric analysis of attapulgite (initial height: 1.75 mm). Table 1
Density values of attapulgite before and after heat treatment, measured by helium pycnometer.
Samples Average density (g/cm3)
Raw attapulgite 2.57
200◦C 2.65
400◦C 2.77
800◦C 2.97
1000◦C 3.04
This consolidation of attapulgite particles under the effect of heating is called sintering[34,35]. The consolidation of a material could be emphasized using a helium pycnometer.
4.2. Textural analysis
4.2.1. Density measurement by helium pycnometer
The values of average densities confirm the sintering of the atta-pulgite under the effect of the increase of the heat temperature (Table 1). The density equal to 2.574 for the raw material increases
gradually to 3.038 after the heating to 1000◦C.
Another characteristic of the material that will certainly be affected by the sintering is the surface morphology in terms of spe-cific surface areas and porosity measured by nitrogen adsorption at 77 K.
4.2.2. Surface analysis by nitrogen adsorption
Table 2contains the specific surface areas, BET constants, meso and micro-porous volumes obtained from nitrogen adsorption isotherms under heat treatment effect.
The texture of attapulgite evolves significantly during the heat treatment. The specific surface area decreases as the temperature
increases up to 2 m2/g at 1000◦C. It is linked to the
disappear-ance of the micropores since 200◦C while the mesopores only
Table 2
Values of specific surface areas (aBET), BET constants (CBET), volumes of micro- and
meso-pores attapulgite samples heat treated at 200◦C, 400◦C, 800◦C and 1000◦C.
aBET
(m2/g) CBET V(cmmeso3/g) V(cmmicro3/g) Raw attapulgite 125.1 436 0.302 0.018
200◦C 88.3 170 0.271 0.007
400◦C 81.5 173 0.340 0.006
800◦C 28.6 176 0.256 –
Fig. 4. Micrographs of attapulgite before and after calcination at 400◦C, 800◦C and 1000◦C.
disappear at 1000◦C. A similar change was obtained for attapulgite from India[36]since its initial surface area decreases from 186 m2/g to 140 m2/g at 200◦C, it decreased further at 350◦C to 123 m2/g,
and at 500◦C it reached 129 m2/g. Sidheswaran[36]attributed the
decrease in surface area at high temperatures to the formation of two crystalline phases: forsterite (MgSiO4) and enstatite (MgSiO3).
Another study[37]on attapulgite from Tunisia, led to different
results. Indeed, the specific surface area of the attapulgite initially
equal to 67.4 m2/g increased successively, to 74.2 m2/g at 350◦C,
then, to 85.9 m2/g at 550◦C, before decreasing to 60.7 m2/g at
750◦C. The increase in the observed surface was attributed to the
elimination of water molecules, leading to the appearance of a new
porosity while the decrease of the surface was interpreted by the coalescence of particles under the effect of temperature.
In this study, the continues decreasing in the surface area, whatever the heat treatment temperature, can be linked to the dis-appearance of the porous volume, more exactly the microporous
volume, caused by the coalescence of particles from 200◦C. It can
be supposed reasonably that the ability to observe the departure of water from the measurement of specific surface area depends on the degassing conditions.
Then, it was interesting to observe by scanning electron microscopy the effect of the heat treatment on the morphology of attapulgite.
Table 3
Chemical composition analysis of raw and heat-treated attapulgite at 400◦C, 800◦C
and 1000◦C.
Element (%) Elemental analysis
Raw attapulgite 400◦C 800◦C 1000◦C Si 16.63 20.21 22.89 25.93 Mg 6.35 7.01 7.98 8.53 Al 4.12 5.05 5.8 6.28 Ca 8.62 4.84 5.74 5.90 Fe 2.33 2.72 3.15 3.40 C 5.03 2.41 0.44 <0.30
4.3. Morphological analysis by SEM
The SEM micrographies (Fig. 4) represent the morphological evolution of attapulgite fibers and carbonates before and after heat treatment at 400◦C, 800◦C and 1000◦C.
At 400◦C, SEM analysis indicates that the fibers and carbonates
are still preserved. From 800◦C, there is an alteration of
carbon-ates which appear roughness, contrary to the initial state. At the same temperature, some attapulgite fibers appear slightly affected because they melt. A total disappearance of the fibrous
morphol-ogy happens at 1000◦C, because of their complete fusion while the
carbonates inclusions have distinctly granular appearance. 4.4. Chemical structure
4.4.1. Determination of chemical composition by elemental analysis
Cations present in the attapulgite sample before and after heat
treatment at 400◦C, 800◦C and 1000◦C were determined by
ele-mental analysis (Table 3).
The decrease in the carbon percentage with the temperature increasing is caused by the release of carbon oxides, indeed, at
500◦C, calcite (CaCO3) and dolomite CaMg(CO3)2 are thermally
unstable and decompose respectively into CaO, CO2 and MgO,
CaCO3, CO2. Similar results were obtained by Hamdi[31]during
cal-cination of a diatomite containing calcite, at the same temperature. In addition to the decomposition of carbonates, the decomposi-tion of organic carbon must be considered in the clay matrix. Other elements ratios increase as the consequence of the carbon ratio decrease. Indeed, it is very difficult to induce dealuminization at
temperatures below 800◦C, so the presence of aluminum, either in
free form (Al2O3) or combined with silica (aluminosilicate),
dis-plays a thermal stability[38,39]. On the other hand, the ferric
species are stable beyond 800◦C.
In order to confirm the decomposition of carbonates, X-ray diffraction analysis was made on samples.
4.4.2. Mineralogical analysis by X-ray diffraction
Fig. 5shows the diffraction patterns of raw and calcined atta-pulgite at 400◦C, 800◦C and 1000◦C.
At 400◦C, the disappearance and the decrease in the intensity
of some peaks reflect a decrease in the solid crystallinity.
How-ever, attapulgite and carbonates, like dolomite CaMg(CO3)2 and
calcite CaCO3seem to be resistant to heating at 400◦C. At 800◦C,
the amorphization is complete, and at this temperature the crystal structure of attapulgite is entirely destroyed with the disappear-ance of attapulgite and carbonates and appeardisappear-ance of iron oxide and quartz.
At 1000◦C, new peaks located at 28(2&), 30(2&), 31(2&), 36(2&), 45(2&), 52(2&) and 57(2&) are related to the formation of new
crystalline phases such as the augite Ca(Fe,Mg)Si2O6 and the
forsterite MgSiO4. These phases are formed following the topotactic transformations. 76 66 56 46 36 26 16 6 (2θ) Counts 400°C 800°C 1000°C Be fo re th er m al treatm en t For For Aug Au g For For For+ Aug iron oxid e D+ Att Att Att+D C+ Att C C C D D + C D D+ C Att + C Att Att C D D D CD D+ D C D + C D+ At t D Att Fo r Au g Fo r+ A ug For Fo r+ A ug For+ Aug For+ Aug For+ Aug iron oxide iro n ox ide iron oxide quartz qua rtz Att
Fig. 5. Attapulgite diffraction patterns before and after heat treatments at 400◦C, 800◦C and 1000◦C (Att = attapulgite, D = dolomite, C = calcite, For = forsterite,
Aug = augite).
A study of different hydration states of sepiolite[28]showed
that the major disorganization in the structure occurs with the
departure of crystallized water (at about 500◦C) and results in a
phase where the elements are rotated as illustrated inFig. 6.
At high temperature, the sepiolite reaches the dehydroxylation
stage and this transformation is achieved at around 850–875◦C,
corresponding to a total reorganization of the cell with the forma-tion of enstatite.
In our study, when the temperature increases, the color of the
raw attapulgite changes from light brown to brick red at 900◦C.
This color change means that isomorphous substitutions by iron
can occurs within the structure (Si4+can be replaced by Fe3+and
Mg2+by Fe2+), which gradually makes the treated surface composed
essentially of iron oxide (Fig. 5). The powder calcined at 1000◦C is gray, this can be attributed to a complete elimination of organic
matter, as was demonstrated for a kaolinite of Brazil[4], calcined
at 550◦C during 8 hours. This removal of organic matter was
accom-panied by a color change from dark brown before treatment to light gray.
In summary, the XRD analysis of heat treated samples indicates that attapulgite is undergoing profound changes, at temperatures
above 400◦C.
The Fourier Transform Infrared Spectroscopy is also of interest to bring information on the evolution of the chemical functionality.
Fig. 6. Schematic structure of anhydrous sepiolite showing the rotation of the ele-ments of the sheets relative to each other[28].
2800 3100 3400 3700 Wavenumber (cm-1) Before thermal treatment 400°C 800°C 1000°C 3544 cm-1 3612 cm-1
Fig. 7. FTIR spectra in absorbance units of attapulgite before and after heat treat-ment at 400◦C, 800◦C and 1000◦C, in the 3800–2900 cm−1region.
4.4.3. Determination of chemical functions by Fourier transform infrared spectroscopy (FTIR)
Fig. 7represents the spectra of FTIR of attapulgite heated at
400◦C, 800◦C and 1000◦C, in the region 3800–2900 cm−1.
FTIR analysis supports the elimination of water molecules. In details:
The hydroxyl vibrational bands at 3612 cm−1 and 3544 cm−1
(Fig. 7) decrease in intensity until it disappears completely at
800◦C, forming a broad band centered at 3450 cm−1. The first one
is attributed to the contribution of stretching vibrations of OH in (Fe, Mg)–OH and (Al, Mg)–OH and the second one to the stretching
vibration of OH associated with Al3+cations in dioctahedral
coor-dination Al2OH and OH stretching vibration of water coordinated
with Mg along the fibers[40]. This evolution confirms the
elimina-tion of water molecules (linked, and zeolitic crystallized) and the dehydroxylation of Mg–OH groups occurring at high temperatures. Fig. 8represents the spectra of FTIR attapulgite heated at 400◦C,
800◦C and 1000◦C, in the region 1500–400 cm−1.
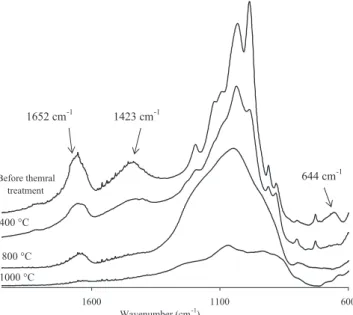
600 1100 1600 Wavenumber (cm-1) 1652 cm-1 Before themral treatment 400 °C 800 °C 1000 °C 1423 cm-1 644 cm-1
Fig. 8. FTIR spectra in absorbance units of attapulgite before and after heat treat-ment at 400◦C, 800◦C and 1000◦C, in the 1500–400 cm−1region.
In the region of low wavenumbers (Fig. 8), the band at 1652 cm−1
corresponding to the bending vibrations of H2O[41]also disappears
when the temperature increases.
The band at 1423 cm−1, characteristic of carbonates[42], also
decreases in intensity as the temperature increases, due to the thermal instability of carbonates.
The bands between 1200 cm−1and 900 cm−1for Si–O vibration
[41,43]decrease in intensity until they disappear at 800◦C
reveal-ing a broad band centered at 1030 cm−1. This variation reflects
the partial destruction of the crystal structure of attapulgite from
800◦C also observed by XRD.
The IR spectrum obtained at 1000◦C reveals no new absorption
peaks.
After reviewing the textural, structural and morphological prop-erties evolution of the attapulgite under heat treatment, we focused on the inverse gas chromatography, a technique to follow the modifications of surface properties. The same samples have been examined by IGC at infinite dilution or finite concentration. 4.5. Determination of surface properties by inverse gas chromatography
4.5.1. Inverse gas chromatography at infinite dilution (IGC-ID) Parameters like the dispersive component of the surface energy, !d
s, the nanomorphological index, IM(#t), and the specific
compo-nent of the surface energy, Isp, obtained by IGC-ID at 130◦C, on
attapulgite samples before and after thermal treatment are gath-ered inTable 4.
The dispersive component of the surface energy decreases when
the temperature increases from 164 mJ/m2 before treatment to
119 mJ/m2at 800◦C. This drop is attributed to the disappearance of
structural defects in which the alkanes probes can establish strong dispersive interactions with the solid surface by insertion.
However, despite the disappearance of the porosity and structural defects measured respectively by nitrogen adsorption (Table 2) and by the !d
s values (Table 4), the nanomorphological
indexes IM(#t) obtained with branched or cyclic probes decrease
with increasing temperature, indicating the appearance of a
rough-ness surface. Then, the evolution of the IM(#t) can be attributed to
the morphology of the carbonates, as observed by SEM analysis (Fig. 4), which becomes gradually roughness at high temperature.
The specific component of surface energy is not affected by thermal treatment meaning that the surface chemistry remains preserved.
4.5.2. Inverse gas chromatography at finite concentration (IGC-FC)
4.5.2.1. Study of desorption isotherms. InTable 5are reported the
values of specific surface areas values measured by nitrogen at 77 K and those obtained by IGC-FC, using: octane, isopropanol and dioxan probes. The irreversibility indexes of the same samples are also reported.
Whatever the probe used, the surface area decreases signifi-cantly under the effect of the temperature reaching values between
20 and 30 m2/g at 800◦C, depending of the injected probe. This is
explained by the coalescence of particles occurring at high temper-atures and which removes the roughness and surface porosity.
Before and after thermal treatment at 400◦C, specific
sur-face area values with nitrogen are higher than those measured with organic probes. It was attributed to the approximation in the calculation of molecular areas of organic probes which are established from adsorption isotherms, generally, on nonporous
solids. At 800◦C, the disappearance of the porosity and surface
roughness under the thermal effect, makes the uncertainty in the calculation of molecular areas weak, because the surfaces are
Table 4
Variations of the !d
s, IM(#t) and Ispvalues of attapulgite samples, before and after thermal treatment at 400◦C and 800◦C, obtained at an oven temperature of 130◦C.
!d
s(mJ/m2) ± 4% IM(#t) ± 5% Isp(kJ/mol) ± 4%
C6, C7, C8 2,3,4-TMP 2,5-DMH Cycl 8 CH2Cl2 CHCl3
Raw attapulgite 164 0.69 0.67 0.22 17 14
After thermal treatment
400◦C 143 0.68 0.61 0.24 16 13
800◦C 119 0.43 0.34 0.18 18 13
Table 5
Values of the specific surface areas (aBET) and irreversibility indexes (Iirr) of raw and thermal treated attapulgite, obtained by nitrogen adsorption and IGC-FC. Adsorption N2 IGC-FC C8 (53◦C) IP (43◦C) DX (51◦C) aBET(m2/g) aBET± 2.8 (m2/g) I irr± 0.2 (%) aBET± 4.5 (m2/g) I irr± 0.6 (%) aBET± 3.6 (m2/g) I irr± 0.1 (%) Raw attapulgite 125.1 114.5 0.6 70.9 8.3 71.0 7.8
After thermal treatment
400◦C 84.4 81.7 1.2 67.1 12.8 61.1 9.3
800◦C 28.6 29.9 5.3 21.8 18.7 25.1 12.8
almost flat, leading to practically identical surface areas whatever the nature of the probe, this tends to prove that it is the positioning of the organic probes on the surface of solid which is the reason of differences observed for the samples treated at 400◦C.
Another explanation for the difference between the surfaces with nitrogen and those measured by IGC-FC, may be the amount of the irreversible adsorption which is not taken into account in IGC-FC for the calculation of specific surfaces areas. The irreversibility indexes were used to quantify the irreversible adsorption, which increases with increasing the temperature of thermal treatment, indicating a greater affinity of these probes to the surface of the heated attapulgite. Taking into account the irreversible adsorption, corrected specific surface areas measured with the organic probes before and after treatment at 400◦C (Table 6) are again lower than with nitrogen. Irreversible adsorption is not the only factor respon-sible of the low values of the specific surface areas measured with organic probes but also the uncertainty on the actual molecular area of the probes.
4.5.2.2. Assessment of the surface energetic heterogeneity. The
het-erogeneity of surface energy of attapulgite samples before and after thermal treatment was estimated by IGC at finite concentration
Table 6
Corrected values of specific surface areas (acorr) attapulgite samples before and after
thermal treatment compared to those measured with nitrogen.
aBET(m2/g) acorr(m2/g)
N2 C8 (53◦C) IP (43◦C) DX (51◦C) Raw attapulgite 125.1 115.2 76.9 76.5 After heat treatment
400◦C 84.4 82.7 75.6 66.7
800◦C 28.6 31.5 26.1 28.2
conditions, choosing three probes with different polarities. The surface heterogeneity was evaluated by determining the adsorp-tion energy distribuadsorp-tion funcadsorp-tions of the three probes according to the method of Rudzinski and Jagiello, by applying the technique of multiple derivations developed by Balard[24].
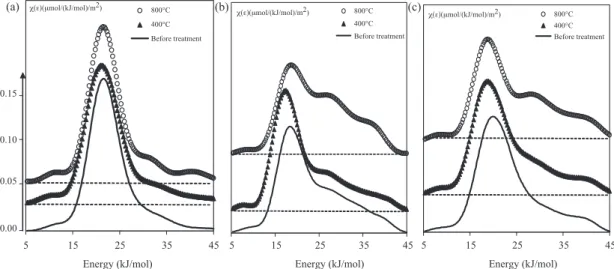
So,Fig. 9shows the adsorption energy distribution functions of n-octane (a) isopropanol (b) and 1,4-dioxan (c) on the surface of
attapulgite before and after thermal treatment at 400◦C and 800◦C.
At 400◦C, the distribution functions with the three probes
remain preserved comparatively to those of the raw attapulgite, on the contrary the distribution function (FD) of the sample treated
at 800◦C show the appearance of two shoulders at high energies,
45 35 25 15 5 Energy (kJ/mol) 800°C 400°C Before treatment 0.05 0.10 0.15 0.00 45 35 25 15 5 Energy (kJ/mol) 800°C 400°C Before treatment χ(ε)(μmol/(kJ/mol)/m2) χ(ε)(μmol/(kJ/mol)/m2) χ(ε)(μmol/(kJ/mol)/m2) 45 35 25 15 5 Energy (kJ/mol) 800°C 400°C Before treatment (a) (b) (c)
Fig. 9. Adsorption energy distribution functions of the n-octane (a) isopropanol (b) and 1,4-dioxan (c) probes of the initial and thermal treated attapulgite at 400◦C and
which are more pronounced with polar probes. The weak shoul-ders observed with the octane, a probe sensitive to the morphology changes, indicate that the attapulgite morphology is affected by the melting of the fibers, while with polar probes, the two shoulders are attributed to the formation of the new phases as confirmed by X-ray diffraction.
5. Conclusion
After submitting attapulgite clay to a thermal treatment in
100–1000◦C interval, two temperature ranges are distinguished
from our study:
Below 500◦C, mass loss is mainly due to a departure of water
molecules (related, zeolitic and crystalized water) and the fibrous morphology is preserved despite a rearrangement of the structure.
Above 500◦C, there is a coalescence of particles (sintering)
reducing the porous volume network and consequently, the spe-cific surface area. At high temperatures, new crystalline phases appear and the fibrous morphology is significantly affected due to the complete melting of the attapulgite fibers.
By IGC-ID, it is observed a decrease of the dispersive component of the surface energy and correlatively a decrease of the nanomor-phological index emphasizing the appearance of a roughness of the carbonates surface.
The specific surface areas measured in IGC-FC reflect the approx-imation in the calculation of molecular areas of organic probes established from adsorption isotherms, generally, on non-porous solids. The differences on specific surface areas measured with nitrogen and organic probes on the raw solid and the solid treated
until 400◦C, disappear on the attapulgite treated at 800◦C which
surface becomes flat.
The distribution functions also evolve with the thermal treatment indicating with octane modifications on the surface mor-phology and with isopropanol or 1,4-dioxan formation of new phases.
This study proves that inverse gas chromatography (IGC) is a convenient and powerful analysis method, in particular for the study of the evolution of physicochemical surface properties of a solid at a molecular scale under a thermal treatment, and it is a very complementary technique to other conventional techniques. Appendix A. Supplementary data
Supplementary data associated with this article can be found, in
the online version, atdoi:10.1016/j.colsurfa.2012.02.015.
References
[1] H.H. Murray, Traditional and new applications for kaolin, smectite, and paly-gorskite: a general overview, Appl. Clay Sci. 17 (2000) 207–221.
[2] H.H. Murray, Applied clay mineralogy today and tomorrow, Clays Clay Miner. 34 (1999) 39–49.
[3] H.H. Murray, Overview – clay mineral applications, Appl. Clay Sci. 5 (1991) 379–395.
[4] J.D.D. Melo, T.C. De Carvalho Costa, A.M. De Medeiros, C.A. Paskocimas, Effects of thermal and chemical treatments on physical properties of kaolinite, Ceram. Int. 36 (2010) 33–38.
[5] A. Michot, D.S. Smith, S. Degot, C. Gault, Thermal conductivity and specific heat of kaolinite: evolution with thermal treatment, J. Eur. Ceram. Soc. 28 (2008) 2639–2644.
[6] D.L. Carroll, T.F. Kemp, T.J. Bastow, M.E. Smith, Solid-state NMR characterisation of the thermal transformation of a Hungarian white illite, Solid State Nucl. Magn. Reson. 28 (2005) 31–43.
[7] W.C. Pingxiao, W. Honghai, L. Rong, The microstructural study of thermal treat-ment montmorillonite from Heping, China, Spectrochim. Acta A 61 (2005) 3020–3025.
[8] Y. Laureiro, A. Jerez, F. Rouquérol, J. Rouquérol, Dehydration kinetics of Wyoming montmorillonite studied by controlled transformation rate thermal analysis, Thermochim. Acta 278 (1996) 165–173.
[9] J. Temuujin, K. Okada, K.J.D. MacKenzie, Ts. Jadambaa, The effect of water vapour atmospheres on the thermal transformation of kaolinite investigated
by XRD, FTIR and solid state MAS NMR, J. Eur. Ceram. Soc. 19 (1999) 105–112.
[10] R.L. Frost, Z. Ding, Controlled rate thermal analysis and differential scanning calorimetry of sepiolites and palygorskites, Thermochim. Acta 397 (2003) 119–128.
[11] F. Gonzalez, C. Pesquera, I. Benito, Thermal investigation of acid-activated attapulgites: influence of isomorphic substitution in the octahedral sheet, Ther-mochim. Acta 194 (1992) 239–246.
[12] F. Gonzalez, C. Pesquera, C. Blanco, I. Benito, S. Mendioroz, J.A. Pajares, Structural and textural evolution under thermal treatment of natural and acid-activated Al-rich and Mg-rich palygorskites, Appl. Clay Sci. 5 (1990) 23–36.
[13] H. Balard, D. Maafa, A. Santini, J.B. Donnet, Study by inverse gas chromatogra-phy of the surface properties of milled graphites, J. Chromatogr. A 1198–1199 (2008) 173–180.
[14] M.P. Comard, R. Calvet, J.A. Dodds, H. Balard, Coupling of inverse gas chro-matography at infinite dilution (IGC-ID) with a controlled modification of a solid surface, J. Chromatogr. A 969 (2002) 93–96.
[15] H. Kellou, B. Hamdi, E. Brendlé, T. Gottschalk-Gaudig, H. Barthel, H. Ridaoui, H. Balard, J.B. Donnet, Surface properties of dimethylsilylated sili-cas, assessed using IGC at finite concentration, Colloids Surf. A 327 (2008) 90–94.
[16] B. Hamdi, Z. Kessaïssia, J.B. Donnet, T.K. Wang, IGC characterization of surface energy and morphology of two natural fillers: kieselguhr and bentonite, Ann. Chim. Sci. Mater. 25 (2000) 481–494.
[17] X. Huang, B. Li, B. Shi, L. Li, Investigation on interfacial interaction of flame retarded and glass fiber reinforced PA66 composites by IGC/DSC/SEM, Polymer 49 (2008) 1049–1055.
[18] A.B. Nastasovic, A.E. Onjia, Determination of glass temperature of polymers by inverse gas chromatography, J. Chromatogr. A 1195 (2008) 1–15.
[19] L. Boudriche, R. Calvet, B. Hamdi, H. Balard, Effect of acid treatment on surface properties evolution of attapulgite clay: an application of inverse gas chro-matography, Colloids Surf. A 392 (2011) 45–54.
[20] E. Brendlé, E. Papirer, Suivi par chromatographie gazeuse inverse de la trans-formation de la goethite en hématite au cours d’un traitement thermique, J. Chim. Phys. 95 (1998) 1020–1051.
[21] B. Hamdi, Z. Kessaïssia, J.B. Donnet, T.K. Wang, Variation de l’énergie superfi-cielle d’une bentonite par traitement chimique et thermique, Ann. Chim. Sci. Mater. 24 (1999) 63–73.
[22] H. Balard, E. Brendlé, E. Papirer, Determination of the acid–base properties of solid surfaces using inverse gas chromatography: advantages and limitations, in: K. Mittal (Ed.), Acid–Base Interactions. Relevance to Adhesion Science and Technology, VSP, Utrecht, The Netherlands, 2000, pp. 299–316.
[23] J.R. Conder, C.L. Young, Physicochemical Measurements by Gas Chromatogra-phy, Wiley Interscience, New York, 1979, pp. 385–390.
[24] H. Balard, Estimation of the surface energetic heterogeneity of a solid by inverse gas chromatography, Langmuir 13 (1997) 1260–1269.
[25] G.M. Dorris, D.G. Gray, Adsorption spreading pressure and London force inter-actions of hydrocarbons on cellulose and wood fiber surfaces, J. Colloid Interface Sci. 71 (1979) 93–104.
[26] E. Brendlé, E. Papirer, A new topological index for molecular probes used in inverse gas chromatography for the surface nanorugosity eval-uation. 1. Method of evaluation, J. Colloid Interface Sci. 194 (1997) 207–216.
[27] D.A. Mckeown, J.E. Post, E.S. Etz, Vibrational analysis of palygorskite and sepi-olite, Clays Clay Miner. 50 (2002) 667–680.
[28] M. Rautureau, A. Mifsud, Etude par microscope électronique des différents états d’hydration de la sépiolite, Clay Miner. 12 (1977) 309–318.
[29] J. Khomari, A. Lemieux, Comparison of attapulgites from different sources using TG/DTG and FTIR, Thermochim. Acta 138 (1989) 97–105.
[30] A. Preisinger, Sepiolite and related compounds: its stability and application, Clays Clay Miner. 10 (1963) 365–371.
[31] B. Hamdi, Etude physico-chimique de la surface des diatomites, PhD thesis, University of Science and Technology Houari Boumediene (USTHB), 1998, pp. 43–64.
[32] W. Kuang, G.A. Facey, C. Detellier, Dehydration and rehydration of palygorskite and the influence of water on the nanopores, Clays Clay Miner. 52 (2004) 635–642.
[33] A. Mifsud, M. Rautureau, V. Fornes, Etude de l’eau dans la palygorskite à l’aide des analyses thermiques, Clay Miner. 13 (1978) 367–374.
[34] K. Traore, T.S. Kabre, P. Blanchart, Sintering of a clay from Burkina Faso by dilatometry influence of the applied load and the pre-sintering heating rate, Ceram. Int. 27 (2001) 875–882.
[35] A. Khalfaoui, S. Kacim, M. Hajjaji, Sintering mechanism and ceramic phases of an illitic–chloritic raw clay, J. Eur. Ceram. Soc. 26 (2006) 161–167.
[36] P. Sidheswaran, Heat-induced structural modifications in palygorskite, Clay Res. 21 (2002) 27–39.
[37] N. Frini-Srasra, E. Srasra, Effect of heating on palygorskite and acid treated palygorskite properties, Surf. Eng. Appl. Electrochem. 44 (2008) 43–49.
[38] K. Kosuge, A. Ogata, Effect of SiO2addition on thermal stability of mesoporous
c-alumina composed of nanocrystallites, Micropor. Mesopor. Mater. 135 (2010) 60–66.
[39] T. Novakovic, N. Radic, B. Grbic, V. Dondur, M. Mitric, D. Randjelovic, D. Stoychev, P. Stefanov, The thermal stability of porous alumina/stainless steel catalyst support obtained by spray pyrolysis, Appl. Surf. Sci. 255 (2008) 3049–3055.
[40] C. Blanco, F. Gonzalez, C. Pesquera, I. Benito, Differences between one aluminic palygorskite and another magnesic by infrared spectroscopy, Spectrosc. Lett. 06 (1989) 659–673.
[41] M. Suárez, E. García-Romero, FTIR spectroscopic study of palygorskite: influ-ence of the composition of the octahedral sheet, Appl. Clay Sci. 31 (2006) 154–163.
[42] E. Garcia-Romero, M. Suarez Barrios, M.A. Bustillo Revuelta, Characteristics of a Mg–palygorskite in Miocene rocks, Madrid basin (Spain), Clays Clay Miner. 52 (2004) 484–494.
[43] E. Mendelovici, Infrared study of attapulgite and HCl treated attapulgite, Clays Clay Miner. 21 (1973) 115–119.
![Fig. 1. Polyhedral representation of attapulgite [27].](https://thumb-eu.123doks.com/thumbv2/123doknet/12177519.314132/4.892.82.425.119.408/fig-polyhedral-representation-of-attapulgite.webp)