HAL Id: hal-03108522
https://hal-imt.archives-ouvertes.fr/hal-03108522
Submitted on 13 Jan 2021
HAL is a multi-disciplinary open access
archive for the deposit and dissemination of
sci-entific research documents, whether they are
pub-lished or not. The documents may come from
teaching and research institutions in France or
abroad, or from public or private research centers.
L’archive ouverte pluridisciplinaire HAL, est
destinée au dépôt et à la diffusion de documents
scientifiques de niveau recherche, publiés ou non,
émanant des établissements d’enseignement et de
recherche français ou étrangers, des laboratoires
publics ou privés.
An Experimental Study of State-of-the-Art Entity
Alignment Approaches
Xiang Zhao, Weixin Zeng, Jiuyang Tang, Wei Wang , Fabian Suchanek
To cite this version:
Xiang Zhao, Weixin Zeng, Jiuyang Tang, Wei Wang , Fabian Suchanek. An Experimental Study of
State-of-the-Art Entity Alignment Approaches. IEEE Transactions on Knowledge and Data
Engi-neering (TKDE), 2020, �10.1109/TKDE.2020.3018741�. �hal-03108522�
An Experimental Study of State-of-the-Art
Entity Alignment Approaches
Xiang Zhao, Weixin Zeng, Jiuyang Tang, Wei Wang, Fabian M. Suchanek
Abstract—Entity alignment (EA) finds equivalent entities that are located in different knowledge graphs (KGs), which is an essential step to enhance the quality of KGs, and hence of significance to downstream applications (e.g., question answering and recommendation). Recent years have witnessed a rapid increase of EA approaches, yet the relative performance of them remains unclear, partly due to
the incomplete empirical evaluations, as well as the fact that comparisons were carried out under different settings (i.e., datasets, information used as input, etc.). In this paper, we fill in the gap by conducting a comprehensive evaluation and detailed analysis of state-of-the-art EA approaches. We first propose a general EA framework that encompasses all the current methods, and then group existing methods into three major categories. Next, we judiciously evaluate these solutions on a wide range of use cases, based on their effectiveness, efficiency and robustness. Finally, we construct a new EA dataset to mirror the real-life challenges of alignment, which were largely overlooked by existing literature. This study strives to provide a clear picture of the strengths and weaknesses of current EA approaches, so as to inspire quality follow-up research.
F
1
I
NTRODUCTIONRecent years have witnessed the proliferation of knowledge graphs (KGs) and their applications. Typical KGs store world knowledge in the form of triples (i.e., <entity, relation, entity>), where entities refer to unique objects in the real world while relations depict relationships connecting these objects. Using entities as anchors, the triples in a KG are intrinsically interlinked, thus constituting a large graph of knowledge. Currently, we have a large number of general KGs (e.g., DBpedia [1], YAGO [52], Google’s Knowledge Vault [14]), and domain-specific KGs (e.g., Medical [48] and Scientific KGs [56]). These KGs have been leveraged to enhance various downstream applications, such as keyword search [64], fact checking [30], question answering [12], [28], etc.
In practice, a KG is usually constructed from one single data source, and hence, it is unlikely to reach full coverage of the domain [46]. To increase its completeness, a prevalent approach is to integrate knowledge from other KGs, which may contain extra or complementary information. For instance, a general KG may only involve basic information about a scientist, whereas more specifics (e.g., biography and publication lists) can be found in scientific domain KGs. In order to consolidate knowledge among KGs, one pivotal step is to align equivalent entities in different KGs, which is termed entity alignment (EA) [7], [25]1.
In general, current EA approaches mainly tackle the problem by assuming that equivalent entities in different KGs possess similar neighboring structure, and employing representation learning methods to embed entities as data points in a low-dimensional feature space. By performing effective (entity) embedding, pair-wise dissimilarity of entities can be easily evaluated as the distance between data points, in order to determine whether two entities match.
While the direction is rapidly progressing (e.g., over twenty papers have been published in the last three years), there is no systematic and comprehensive comparison of these solutions. In 1. In fact, as where we are standing, entity alignment can be deemed as a special case of entity resolution (ER), which recalls a pile of literature (to be discussed in Section 2.2). As some ER methods (with minor adaptation) can be used to handle EA, they are also involved in this experimental study to ensure the comprehensiveness of the comparison.
this article, we provide an empirical evaluation of state-of-the-art EA approaches with the following features:
(1) Fair comparison within and across categories. Almost all recent studies [5], [24], [38], [55], [60], [61], [62], [63], [67] are con-fined to comparing with only a subset of methods. In addition, dif-ferent approaches follow difdif-ferent settings: some merely use the KG structure for alignment, while others also utilize additional information; some align KGs in one pass, while others employ an iterative (re-)training strategy. Although a direct comparison of these methods, as reported in the literature, demonstrates the overall effectiveness of the solutions, a more preferable and fairer practice would be to group these methods into categories and then compare the results both within and across categories.
In this study, we include most state-of-the-art methods for lateral comparison, including those very recent efforts that have not yet been compared with others before. By dividing them into three groups and conducting detailed analysis on both intra-and inter-group evaluations, we are able to better position these approaches and assess their effectiveness.
(2) Comprehensive evaluation on representative datasets.
To evaluate the performance of EA systems, several datasets have been constructed, which can be broadly categorized into cross-lingual benchmarks, represented by DBP15K [53], and mono-lingual benchmarks, represented by DWY100K [54]. A very recent study [24] points out that KGs in previous datasets are much denser than real-life ones, and consequently it creates the SRPRS dataset with entity degrees following normal distribution. Despite of a wide choice of datasets, existing studies merely report their results on one or two specific datasets, making it difficult to assess their effectiveness in a wide range of possible scenarios, e.g., cross-lingual/mono-lingual, dense/normal, and large-scale/medium-scale KGs.
In response, this study conducts a comprehensive experimen-tal evaluation on all the representative datasets (i.e., DBP15K, DWY100K and SRPRS), which comprise nine KG pairs, and ana-lyzes in depth in terms of effectiveness, efficiency and robustness.
(3) New dataset for real-life challenges. Existing EA datasets contain, for each entity in source KG, exactly one corresponding entity in the target KG. This, however, is an unrealistic scenario.
In real life, KGs contain entities that other KGs do not contain. For instance, when aligning YAGO 4 and IMDB, only 1% of entities in YAGO 4 are related to movies, while the other 99% of entities in YAGO 4 necessarily have no match in IMDB. These unmatchable entities would increase the difficulty of EA.
Besides, we observe that the KGs in existing datasets use identical naming systems, and the baseline approach that relies on the string similarity between entity names can achieve 100% accuracy on all mono-lingual datasets. Nevertheless, in real-life KGs, an entity is often identified by an incomprehensible id, and associated with one or several human-readable names. Therefore, different entities might share the same name. This obviously poses a problem for EA, as there is no guarantee that an entity with the name “Paris” in the source KG is the same as an entity with the name “Paris” in the target KG—simply because one might be the city in France and the other one a city in Texas.
We thus consider that the existing datasets for EA are an oversimplification of the real-life challenges, disregarding the fundamental issues of unmatchable entities and ambiguous entity names. As a remedy, we propose a new dataset that mirrors these difficulties.
Contributions. Overall, this article is oriented to both
the scientific community and the practitioners. The main contributions of the article are:
• To the best of our knowledge, this study is amongst the first efforts to systematically and comprehensively evaluate state-of-the-art EA approaches. This is accomplished by: (1) identifying the main components of existing EA approaches and offering a general EA framework; and (2) grouping state-of-the-art approaches into three categories and performing detailed intra- and inter-group evaluations, which better position different EA solutions; and (3) examining these approaches on a broad range of use cases, including cross-/mono-lingual alignment, and alignment on dense/normal, large-/medium-scale data. The empirical results reveal the effectiveness, efficiency and robustness of each solution.
• The experience and insight we gained from the study enable us to discover the shortage of current EA datasets. As a remedy, we construct a new mono-lingual dataset to mirror the real-life challenges of unmatchable entities and ambiguous entity names, which were largely overlooked by current EA literature. We expect this new dataset to serve as a better benchmark for evaluating EA systems.
Organization. Section 2 formalizes the task of EA, and
introduces the scope of this study. Section 3 presents a general EA framework to encompass state-of-the-art EA approaches. The categorization, experimental settings, results and discussions are elaborated in Section 4. Section 5 provides a new dataset and corresponding experiment results, and Section 6 concludes the article.
2
P
RELIMINARIESIn this section, we first formally define the task of EA, then we introduce the scope of this study.
2.1 Task Definition
A KG G=(E,R,T ) is a directed graph comprising a set of entities E, relations R, and triples T ⊆ E × R × E. A triple (h,r,t) ∈ T represents a head entity h that is connected to a tail entity t via a relation r. Given a source KG G1=(E1,R1,T1), a target KG G2=
(E2,R2,T2), and seed entity pairs (training set), i.e., S = {(u,v) |
u ∈ E1,v ∈ E2,u ↔ v}, where ↔ represents equivalence (i.e., u
and v refer to the same real-world object), the task of EA can be defined as discovering the equivalent entity pairs in the test set.
KGEN KGES [Roma(city)] [Alfonso] [Madrid] [Roma(film)] [Spain] [Mexico] [Roma(película)] [España] [Roma(ciudad)] [Madrid] [Alfonso] [Mexico]
[Gravity(film)] [Gravity(película)]
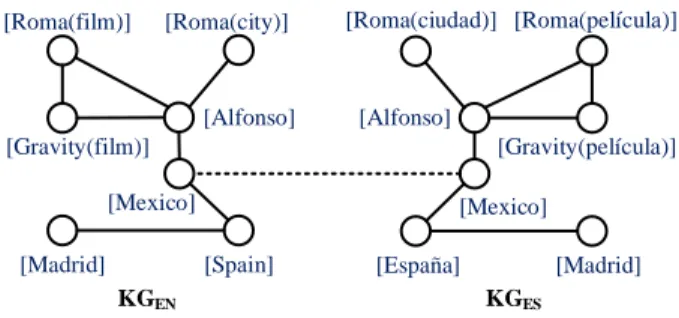
Fig. 1. An example of EA. Relation identifiers and other entities are omitted for clarity; seed entity pairs are connected by dashed lines.
Example 1. Figure 1 shows a partial English KG (KGEN) and a
partial Spanish KG (KGES) concerning the director Alfonso
Cuar´on. Note that each entity in the KG has a unique identifier. For example, the movie “Roma” in the source KG is uniquely identified by Roma(film)2.
Given the seed entity pair (Mexico, Mexico), EA aims to find the equivalent entity pairs in the test set, e.g., returning Roma(ciudad) in KGESas the corresponding target entity
to the source entity Roma(city) in KGEN.
2.2 Scope and Related Work
While the problem of EA was introduced a few years ago, the more generic version of the problem—identifying entity records referring to the same real-world entity from different data sources—has been investigated from various angles by different communities, under the names of entity resolution (ER) [15], [18], [45], entity matching [13], [42], record linkage [8], [34], deduplication [16], instance/ontology matching [20], [35], [49], [50], [51], link discovery [43], [44], entity linking/entity disambiguation [11], [29]. Next, we describe the related work and the scope of this experimental study.
Entity linking. The task of Entity Linking (EL) is also known as Entity Disambiguation. It is concerned with identifying entity mentions in natural language text, and mapping them to the entities of a given reference catalogue (a KG in most cases). For example, the goal is to identify the string “Rome” in a natural language text as an entity mention, and to find out whether it refers to the capital of Italy or to one of the many movies of that name. Existing approaches [21], [22], [29], [36], [68] exploit rich amount of information, including the words that surround the entity mention, the prior probability of certain target entities, the already disambiguated entity mentions, and background knowledge such as Wikipedia, to disambiguate linking targets. However, most of these information is not available in our KG alignment scenarios (e.g., embeddings of the description of entities, or the prior distribution of entity linking given a mention). Additionally, EL concerns the mapping between natural language text and a KG. Our work, in contrast, studies the mapping of entities between two KGs.
2. The identifiers in some KGs are human-readable, such as the ones shown in the figure, while some can be incomprehensible, e.g., mids (/m/012rkqx) in Freebase.
Entity resolution. The task of entity resolution (ER), also known as entity matching, deduplication or record linkage, assumes that the input is relational data, and each data object usually has a large amount of textual information described in multiple attributes. Therefore, a number of known similarity or distance functions (e.g., Jaro-Winkler distance for names and numerical distance between dates) are used to quantify the sim-ilarity between two objects. Based on that, rule-based or machine learning-based methods are capable of solving the problem of classifying two objects as matching or non-matching [9].
More specifically, for mainstream ER solutions, to match entity records, the attributes are firstly aligned either manually or automatically, then the similarities between corresponding attribute values are computed, and finally the similarity scores between aligned attributes are aggregated to derive the similarities between records [32], [45].
Entity resolution on KGs. Some ER approaches are designed
to handle KGs and deal exclusively with binary relationships, i.e., graph-shaped data. These approaches are also frequently referred to as instance/ontology matching methods [49], [50]. The graph-shaped data comes with its own challenges: (1) the textual descriptive information about entities is often less present, or reduced to its bare minimum in the form of an entity name; and (2) KGs operate under the Open World Assumption, in which the attributes of an entity may be absent in the KG although they are present in reality. This distinguishes KGs from classical databases, where all fields of a record are usually assumed to be present; and (3) KGs have additional predefined semantics. In the simplest case, these take the form of a taxonomy of classes. In more complex cases, KGs can be equipped with an ontology of logical axioms.
Over the last two decades, and particularly in the context of the rise of the Semantic Web and the Linked Open Data cloud [26], a number of approaches have been developed specifically for the setting of KGs. These can be classified along several dimensions:
• Scope. Some approaches align the entities of two KGs,
others align the relationship names (also known as the schema), and again other approaches align the class taxonomies of two KGs. Some methods achieve all three tasks at once. In this work, we focus on the first of these tasks, entity alignment.
• Background knowledge.Some approaches use an ontology
(T-box) as background information. This is true in particular for the approaches that participate in the Ontology Align-ment Evaluation Initiative (OAEI)3. In this work, we
concen-trate on approaches that can work without such knowledge.
• Training.Some approaches are unsupervised, which work
directly on the input data, without any need for training data or indeed a training phase. Examples arePARIS[51] and SiGMa [35]. Other approaches, on the other hand, learn the mappings between the entities based on pre-defined mappings. In this work, we focus on the latter class of approaches.
Among the supervised or semi-supervised approaches, most build on the recent advances in deep learning [23]. They mainly rely on graph representation learning technologies to model the KG structure and generate entity embeddings for alignment. We use “entity alignment (EA) approaches” as the general reference to them, and they are also the focus of this study. Nevertheless, we includePARIS[51] in our comparison, as a representative system
3. http://oaei.ontologymatching.org/
of the unsupervised approaches. We also include Agreement-MakerLight (AML) [17] as a representative unsupervised system that uses the background knowledge. For the other systems, we refer the reader to other surveys [9], [33], [41], [43].
In addition, since EA pursues the same goal as ER, it can be deemed a special but non-trivial case of ER. In this light, general ER approaches can be adapted to the problem of EA, and we include representative ER methods for comparison (to be detailed in Section 4).
Existing benchmarks. To evaluate the effectiveness of
EA solutions, several synthetic datasets (e.g., DBP15K and DWY100K) have been constructed by using the existing inter-language and reference links in DBpedia. More detailed statistics of these datasets can be found in Section 4.2.
Notably, the Ontology Alignment Evaluation Initiative (OAEI) promoted the Knowledge Graph track4. In contrast to existing EA benchmarks, where merely instance-level information is provided, KGs in these datasets contain both schema and instance information, which can be unfair for evaluating current EA approaches that do not assume the availability of ontology information. Hence, they are not presented in this article.
3
A G
ENERALEA F
RAMEWORKIn this section, we introduce a general EA framework that is conceived to encompass state-of-the-art EA approaches.
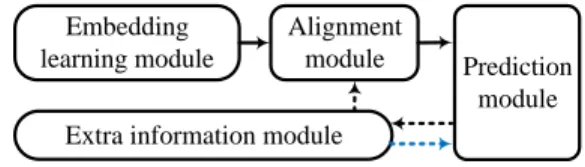
By carefully examining the frameworks of current EA solutions, we identify the following four main components (illustrated in Figure 2):
Embedding learning module
Alignment module
Extra information module
Prediction module
Fig. 2. A general EA framework.
• Embedding learning module. This component aims to
learn embeddings for entities, which can be roughly catego-rized into two groups: KG representation based models, e.g., TransE[4] and graph neural network (GNN) based models, e.g., the graph convolutional network (GCN) [31].
• Alignment module. This component aims to map the
entity embeddings in different KGs (learned from the previous module) into a unified space. Most methods use the margin-based loss to enforce the seed entity embeddings from different KGs to be close. Another frequently used approach is corpus fusion, which aligns KGs on the corpus-level and directly embeds entities in different KGs into the same vector space.
• Prediction module. Given the unified embedding space,
for each source entity in the test set, the most likely target en-tity is predicted. Common strategies include using the cosine similarity, the Manhattan distance, or the Euclidean distance between entity embeddings to delegate the distance (similar-ity) between entities and then selecting the target entity with the lowest distance (highest similarity) as the counterpart. 4. http://oaei.ontologymatching.org/2019/knowledgegraph
• Extra information module. On top of the basic modules, some solutions propose to take advantage of extra informa-tion to enhance EA performance. One common practice is the bootstrapping (or self-learning) strategy, which leverages confident alignment results generated by the prediction module as the training data for the subsequent alignment iterations (black dashed lines in Figure 2). Additionally, others propose to take advantage of multi-type literal information, e.g., attributes, entity descriptions and entity names, to complement the KG structure (blue dashed line).
Example 2. Further to Example 1, we explain these modules. The
embedding learning module generates embeddings for entities in KGENand KGES, respectively. Then the alignment module
projects the entity embeddings into the same vector space, where the entity embeddings in KGENand KGESare directly
comparable. Finally, using the unified embeddings, the predic-tion module aims to predict the equivalent target entity in KGES
for each source entity in KGEN. The extra information module
leverages several techniques to improve the EA performance. Concretely, the bootstrapping strategy aims to include the confident EA pairs detected from a previous round, e.g., (Spain, Espa˜na), into the training set for learning in the next round. Another approach is to use the literal information, e.g., the comprehensible entity identifiers (shown in Figure 1), to complement the entity embeddings for alignment. To provide a module-wise comparison, we organize the state-of-the-art approaches under the introduction to each module (Table 1). In this case, we refer interested readers to Appendix B for a concise but complete view. Next, we introduce how these modules are realized by different state-of-the-art approaches.
3.1 Embedding Learning Module
In this subsection, we introduce in detail the methods used for the embedding learning module, which leverages the KG structure to generate an embedding for each entity.
As can be observed from Table 1,TransE[4] and GCN [31] are the mainstream models. Here we provide a brief description of these basic models.
TransE. TransEinterprets relations as translations operating on the low-dimensional representations of entities. More specifically, given a relational triple (h, r, t), TransE suggests that the embedding of the tail entity t should be close to the embedding of the head entity h plus the embedding of the relationship r, i.e., ~h+~r ≈~t. As thus, the structural information of entities can be preserved and the entities that share similar neighbors will have close representations in the embedding space.
GCN. The graph convolutional network (GCN) is a kind of convolutional networks that directly operates on graph-structured data. It generates node-level embeddings by encoding the information about node neighborhoods. The inputs of the GCN include feature vectors for every node in the KG, and a representative description of the graph structure in matrix form, i.e., an adjacency matrix. The output is a new feature matrix. A GCN model normally comprises multiple stacked GCN layers, hence it can capture a partial KG structure that is several hops away from the entity.
On top of these basic models, some methods make modifications. Regarding the TransE-based models, MTransE removes the negative triples during training,BootEAandNAEA replace the original margin-based loss function with a limit-based
objective function,MuGNNuses the logistic loss to substitute for the margin-based loss, andJAPEdesigns a new loss function.
As for the GCN-based models, noticing that the GCN neglects the relations in KGs,RDGCNadopts the dual-primal graph convolutional neural network (DPGCNN) [40] as a remedy.MuGNN, on the other hand, utilizes an attention-based GNN model to assign different weights to different neighboring nodes.KECGcombines the graph attention network (GAT) [58] andTransEto capture both the inner-graph structure and the inter-graph alignment information.
There are also a few approaches that design new embedding models. InRSNs, it is contended that the triple-level learning cannot capture the long-term relational dependencies of entities and is insufficient for the propagation of semantic information among entities. As thus, it uses recurrent neural networks (RNNs) with residual learning to learn the long-term relational paths between entities. InTransEdge, a new energy function to measure the error of edge translation between entity embeddings is devised for learning KG embeddings, in which edge embeddings are modeled by context compression and projection.
3.2 Alignment Module
In this subsection, we introduce the methods used for the align-ment module, which aims to unify separated KG embeddings.
The most common strategy is adding a margin-based loss function on top of the embedding learning module. The margin-based loss function requires that the distance between the entities in positive pairs should be small, the distance between the entities in negative pairs should be large, and there should exist a margin between the distances of positive and negative pairs. Here positive pairs denote the seed entity pairs, while the negative pairs are constructed by corrupting the positive pairs. In this way, the two separated KG embedding spaces can be pushed into one vector space. Table 1 shows that, most methods built on GNN adopt such a margin-based alignment model to unify two KG embedding spaces, whereas inGM-Align, the alignment process is achieved by a matching framework that maximizes the matching probabilities of seed entity pairs.
Another frequently used approach is corpus fusion, which utilizes the seed entity pairs to bridge the training corpora of two KGs. Given the triples of two KGs, some methods, e.g.,BootEA andNAEA, swap the entities in the seed entity pairs and generate new triples to calibrate the embeddings into a unified space. Other approaches treat the entities in seed entity pairs as the same entity and build an overlay graph connecting two KGs, which is then used for learning entity embeddings.
Some early studies design transition functions to map the embedding vectors in one KG to another, while some use additional information, e.g., the attributes of entities, to shift the entity embeddings into the same vector space.
3.3 Prediction Module
Given the unified embedding space, this module aims to determine the most likely target entity for each source entity.
The most common approach is returning a ranked list of target entities for each source entity according to a specific distance measure between the entity embeddings, among which the top ranked entity is regarded as the match. Frequently used distance measures include the Euclidean distance, the Manhattan distance and the cosine similarity. Note that the similarity score between entities can be easily converted to the distance score
TABLE 1
A summary of the EA approaches involved in this study.
Method Embedding Model Alignment Model Extra information Prediction C-L M-L Group
MTransE[7] TransE? Transition 7 Euclidean distance 3 7 I
RSNs[24] RSNs Corpus fusion 7 Cosine similarity 3 3 I
MuGNN[5] GNN Margin-based 7 Cosine similarity 3 3 I
KECG[38] GAT+TransE Margin-based 7 Euclidean distance 3 3 I
ITransE[69] TransE Transition Bootstrapping Euclidean distance 7 3 II
BootEA[54] TransE? Corpus fusion Bootstrapping Cosine similarity 3 3 II
NAEA[70] TransE? Corpus fusion Bootstrapping Cosine similarity 3 3 II
TransEdge[55] TransEdge Corpus fusion Bootstrapping Cosine similarity 3 3 II
JAPE[53] TransE? Attribute-refined Attribute Cosine similarity 3 7 III
GCN-Align[59] GCN Margin-based Attribute Manhattan distance 3 7 III
AttrE[57] TransE Attribute-refined Attribute Cosine similarity 7 3 III
KDCoE[6] TransE Transition Entity description Euclidean distance 3 7 III
HMAN[63] GCN Margin-based Description, Attribute Euclidean distance 3 7 III
GM-Align[62] GCN Graph matching Entity name Matching probability 3 7 III
RDGCN[60] DPGCNN Margin-based Entity name Manhattan distance 3 7 III
HGCN[61] GCN Margin-based Entity name Manhattan distance 3 7 III
MultiKE[67] TransE? Corpus fusion Entity name, Attribute Cosine similarity 7 3 III
CEA[65] GCN Margin-based Entity name Cosine similarity 3 3 III
1C-Lstands for Cross-lingual Evaluation, M-L stands for Mono-lingual Evaluation. 2TransE?represents variants of the TransE model.
by subtracting the similarity score from 1, and vice versa5. In GM-Align, the target entity with the highest matching probability is aligned to the source entity.
Besides, a very recent approach,CEA, points out that there is often an additional interdependence between different EA decisions, i.e., a target entity is less likely to be matched to a source entity if it is aligned to another source entity with higher confidence. To model such a collective signal, it formulates this process as a stable matching problem built upon the distance mea-sure, which reduces mismatches and leads to higher accuracy.
3.4 Extra Information Module
Although the embedding learning, alignment and prediction modules can already constitute a basic EA framework, there is still room for improvement. In this subsection, we introduce the methods used in the extra information module.
A common method is the bootstrapping strategy (also frequently called the iterative training or self-learning strategy), which iteratively labels likely EA pairs as the training set for the next round and thus progressively improves the alignment results. Several methods have been devised, and the main difference lies in the selection of confident EA pairs.ITransE adopts a threshold-based strategy, while BootEA, NAEA and TransEdge formulate the selection as a maximum likelihood matching process under a 1-to-1 mapping constraint.
Some methods use multi-type literal information to provide a more comprehensive view for alignment. The attributes associated with entities are frequently used. While some merely use the statistical characteristics of the attribute names (e.g., JAPE,GCN-AlignandHMAN), the other methods generate attribute embeddings by encoding the characters of attribute values (e.g., AttrEandMultiKE).
There is a growing tendency towards the use of entity names. GM-Align,RDGCNandHGCNuse entity names as the input features for learning entity embeddings, whileCEAexploits the semantic and string-level aspects of entity names as individual features. 5. In this work, we use the distance between entity embeddings and the similarity between entity embeddings interchangeably.
Besides,KDCoEand the description-enhanced version ofHMAN encode entity descriptions into vector representations, which are considered as new features for alignment.
It is worth noting that multi-type information is not always available. Besides, since EA underlines the use of graph structure for alignment, the majority of existing EA datasets contain very limited textual information, which restrains the applicability of some approaches such asKDCoE,MultiKEandAttrE.
4
E
XPERIMENTS ANDA
NALYSISThis section presents an in-depth empirical study6.
4.1 Categorization
According to the main components, we can broadly categorize current methods into three groups: Group I, which merely utilizes the KG structure for alignment, Group II, which harnesses the it-erative training strategy to improve alignment results, and Group III, which utilizes information in addition to the KG structure. We introduce and compare these three categories using Example 1.
Group I. This category of methods merely harnesses the KG
structure for aligning entities. Consider again Example 1. In KGEN, the entity Alfonso is connected to the entity Mexico
and three other entities, while Spain is connected to Mexico and one more entity. The same structural information can be observed in KGES. Since we already know that Mexico in
KGENis aligned to Mexico in KGES, by using the KG structure,
it is easy to conclude that the equivalent target entity for Spain is Espa˜na, and the equivalent target entity for Alfonso is Alfonso.
Group II. Approaches in this category iteratively label likely EA pairs as the training set for the next round and progressively improve alignment results. They can also be categorized into Group I or III, depending on whether they merely use the KG structure or not. Nevertheless, they are all characterized by the use of the bootstrapping strategy.
6. A link will be provided, and all datasets and program sources will be made available on a Github page.
We still use Example 1 to illustrate the bootstrapping mecha-nism. As depicted in Figure 1, using the KG structure, it is easy to discover that the source entity Spain corresponds to the target entity Espa˜na, and Alfonso to Alfonso. Nevertheless, for the source entity Madrid, its target entity remains unclear, since the target entities Roma(ciudad) and Madrid both have the same structural information with the source entity Madrid— two hops away from the seed entity and with degree 1. To resolve this issue, bootstrapping-based methods conduct several rounds of alignment, where the confident pairs detected from the pre-vious round are regarded as seed entity pairs for the next round. More specifically, they consider the entity pairs detected from the first round, i.e., (Spain, Espa˜na) and (Alfonso, Alfonso), as the seed pairs in the following rounds. Consequently, in the second round, for the source entity Madrid, only the target entity Madrid shares the same structural information with it—two hops away from the seed entity pair (Mexico, Mexico) and one hop away from the seed entity pair (Spain, Espa˜na).
Group III. Although it is intuitive to leverage the KG structure for alignment given graph-formatted input data sources, KGs also contain rich semantics, which can be used to complement struc-tural information. Methods in this category distinguish them-selves by the use of information in addition to the KG structure. Referring to Example 1, after using the KG structure and even the bootstrapping strategy, it is still difficult to determine the tar-get entity for the source entity Gravity(film), as its structural information (connected to the entity Alfonso and with degree 2) is shared by two target entities Gravity(pel´ıcula) and Roma(pel´ıcula). In this case, using entity name information to complement the KG structure can easily distinguish these two entities and return Gravity(pel´ıcula) as the target entity for the source entity Gravity(film).
4.2 Experiment Settings
Datasets. We adopt three frequently utilized and
representative datasets, including nine KG pairs, for evaluation: DBP15K [53]. This dataset consists of three multilingual KG pairs extracted from DBpedia: English to Chinese (DBP15KZH-EN), English to Japanese (DBP15KJA-EN) and English
to French (DBP15KFR-EN). Each KG pair contains 15 thousand
inter-language links as gold standards.
DWY100K[54]. This dataset comprises two mono-lingual KG pairs, DWY100KDBP-WDand DWY100KDBP-YG, which are extracted
from DBpedia, Wikidata and YAGO 3. Each KG pair contains 100,000 entity pairs. The extraction process follows DBP15K, whereas the inter-language links are replaced with the reference links connecting these KGs.
SRPRS. Guo et al. [24] point out that KGs in previous EA datasets, e.g., DBP15K and DWY100K, are too dense and the degree distributions deviate from real-life KGs. Therefore, they establish a new EA benchmark that follows real-life distribution by using the reference links in DBpedia. The final evaluation benchmark consists of cross-lingual (SRPRSEN-FR, SRPRSEN-DE)
and mono-lingual KG pairs (SRPRSDBP-WD, SRPRSDBP-YG), where
EN, FR, DE, DBP, WD, and YG represent DBpedia (English), DBpedia (French), DBpedia (German), DBpedia, Wikidata and YAGO 3, respectively. Each KG pair contains 15,000 entity pairs. A summary of the datasets can be found in Table 2. In each KG pair, there are relational triples, cross-KG entity pairs (gold standards, in which 30% are seed entity pairs and used for training), and attribute triples.
TABLE 2
Statistics of EA benchmarks and our constructed dataset. KG pair #Rel Triples #Relations #Attr Triples DBP15KZH-EN 70,414 1,701 248,035 95,142 1,323 343,218 DBP15KJA-EN 77,214 1,299 248,991 93,484 1,153 320,616 DBP15KFR-EN 105,998 903 273,825 115,722 1,208 351,094 DWY100KDBP-WD 463,294 330 341,770 448,774 220 779,402 DWY100KDBP-YG 428,952 302 383,757 502,563 31 98,028 SRPRSEN-FR 36,508 221 60,800 33,532 177 53,045 SRPRSEN-DE 38,363 222 55,580 37,377 120 73,753 SRPRSDBP-WD 38,421 253 64,021 40,159 144 133,371 SRPRSDBP-YG 33,748 223 58,853 36,569 30 18,241 DBP-FB 96,414 407 127,614 111,974 882 78,740
Degree distribution. To gain insight into the datasets, we
show the degree distributions of entities in these datasets in Figure 3. The degree of an entity is defined as the number of triples an entity is involved in. Higher degree implies richer neighboring structure. In each dataset, since the degree distributions of different KG pairs are very similar, we merely present the distribution of one KG pair in Figure 3 in the interest of space.
The (a) series of sub-figures corresponds to DBP15K. It is evident that the entities with degree of 1 account for the largest share, and with the increase of degree values, the number of entities fluctuates while it generally exhibits a downward trend. Noteworthily, the curve of the coverage approximates a straight line, as the number of entities changes subtly when the degree increases from 2 to 10.
The (b) series of sub-figures corresponds to DWY100K. The structure of the KGs in this dataset is very different from (a), as there are no entities with degree of 1 or 2. Besides, the number of entities peaks at degree of 4, and drops consistently when the entity degree increases.
The (c) series of sub-figures corresponds to SRPRS. Evidently, the degree distribution of entities in this dataset is more realistic, where the entities with lower degrees account for higher percent-ages. This can be attributed to its carefully designed sampling strategy. Note that the (d) series of sub-figures corresponds to our constructed dataset, which will be introduced in Section 5.
Evaluation metrics. Following existing EA solutions, we
utilize Hits@k (k=1, 10) and mean reciprocal rank (MRR) as the evaluation metrics. At the prediction stage, for each source entity, the target entities are ranked according to their distance scores with the source entity in an ascending order. Hits@k reflects the percentage of correctly aligned entities in the top-k closest target entities. In particular, Hits@1 represents the accuracy of alignment results, which is the most important indicator.
MRR denotes the average of the reciprocal ranks of the ground truths. Note that higher Hits@k and MRR indicate better performance. Unless otherwise specified, the results of Hits@k
0% 20% 40% 60% 80% 100% 0 500 1000 1500 2000 2500 3000 3500 1 2 3 4 5 6 7 8 9 10 (a-1) DBP15K-ZH 0% 20% 40% 60% 80% 100% 0 500 1000 1500 2000 2500 3000 1 2 3 4 5 6 7 8 9 10 (a-2) DBP15K-EN 0% 20% 40% 60% 80% 100% 0 1000 2000 3000 4000 5000 6000 7000 1 2 3 4 5 6 7 8 9 10 (d-1) FB 0% 20% 40% 60% 80% 100% 0 2000 4000 6000 8000 10000 12000 1 2 3 4 5 6 7 8 9 10 (d-2) DBP 0% 20% 40% 60% 80% 100% 0 5000 10000 15000 20000 25000 1 2 3 4 5 6 7 8 9 10 (b-1) DWY-100K-DBP 0% 20% 40% 60% 80% 100% 0 5000 10000 15000 20000 25000 1 2 3 4 5 6 7 8 9 10 (b-2) DWY-100K-WD 0% 20% 40% 60% 80% 100% 0 1000 2000 3000 4000 5000 1 2 3 4 5 6 7 8 9 10 (c-1) SRPRS-EN 0% 20% 40% 60% 80% 100% 0 1000 2000 3000 4000 5000 6000 1 2 3 4 5 6 7 8 9 10 (c-2) SRPRS-FR
Fig. 3. Degree distributions on different datasets. The X-axis denotes entity degree. The left Y-axis represents the number of entities (corresponding to bars), while the right Y-axis represents the percentage of entities with a degree lower than a givenxvalue (corresponding to lines).
are represented in percentages.
Methods to compare. We include aforementioned methods
for comparison, except for KDCoE and MultiKE, since the evaluation benchmarks do not contain entity descriptions. We also excludeAttrEas it only works under the mono-lingual setting. Additionally, we report the results of the structure-only variants ofJAPEandGCN-Align, i.e.,JAPE-StruandGCN.
As mentioned in Section 2.2, in order to demonstrate the capability of ER approaches for coping with EA, we also compare with several name-based heuristics, as the typical approaches of these relevant tasks [13], [42], [47] heavily rely on the similarity between object names to discover the equivalence. Concretely, we use: (1)Lev, which aligns entities using Levenshtein distance [37], a string metric for measuring the difference between two sequences; and (2)Embed, which aligns entities according to the cosine similarity between the name embeddings (averaged word embedding) of two entities. Following [65], we use the pre-trained fastText embeddings [2] as word embeddings, and for multilingual KG pairs, we use the MUSE word embeddings [10].
Implementation details. The experiments are conducted on
a personal computer with an Intel Core i7-4790 CPU, an NVIDIA GeForce GTX TITAN X GPU and 128 GB memory. The programs are all implemented in Python.
We directly use the source codes provided by the authors for reproduction, and the results are obtained by executing the models using the set of parameters reported in their original papers7. We use the same set of parameters on the datasets that are not included in the original papers.
On the DBP15K dataset, all of the evaluated methods provide results in their original papers, except forMTransEand ITransE. We compare our implemented results with their reported results. If the difference falls out of a reasonable range, i.e., ±5% of the original results, we mark the methods with∗. Note
that theoretically there should not be a huge difference, since we use the same source codes and the same parameters for implementation. On SRPRS, onlyRSNsreports the results in its original paper [24]. We run all methods on SRPRS and provide the results in Table 4. On DWY100K, we run all approaches, and compare the performance ofBootEA,MuGNN,NAEA,KECG andTransEdgewith the results provided in their original papers. Methods with notable differences are marked with∗.
7. In the interest of space, we put the detailed parameter settings in the appendix.
On each dataset, the best results within each group are denoted in bold. We mark the best Hits@1 performance among all approaches withN, as this metric can best reflect the
effectiveness of EA methods.
4.3 Results and Analyses on DBP15K
The experiment results on the cross-lingual dataset DBP15K are reported in Table 3. The Hits@10 and MRR results ofCEA are missing as it directly generates aligned entity pairs instead of returning a list of ranked entities8. We then compare the performance within each category and across categories.
Group I. Among the approaches merely using the KG
structure,RSNsconsistently achieves the best results in terms of both Hits@1 and MRR, which can be ascribed to the fact that the long-term relational paths it captures provide more structural signals for alignment. The results ofMuGNNandKECGare equally matched, partially due to their shared objective of completing KGs and reconciling the structural differences. WhileMuGNN utilizesAMIE+[19] to induce rules for completion,KECGharnesses TransEto implicitly achieve this aim.
The other three approaches attain relatively inferior results. BothMTransEandJAPE-StruadoptTransEfor capturing the KG structure, whileJAPE-StruoutperformsMTransE, asMTransEmodels the structure of KGs in different vector spaces, and the informa-tion loss happens when translating between vector spaces [53]. GCNobtains relatively better results thanMTransEandJAPE-Stru.
Group II. Within this category,ITransEattains much worse
results than other methods, which can be attributed to the infor-mation loss during the translation between embedding spaces and its simpler bootstrapping strategy (detailed in Section 3.4). BootEA, NAEA and TransEdge utilize the same bootstrapping strategy. The performance ofBootEAis slightly inferior to the reported results, while the results ofNAEAare much worse. The-oretically,NAEAshould achieve better performance thanBootEA as it leverages an attentional mechanism to obtain neighbor-level information. TransEdge employs an edge-centric embedding model to capture structural information, which generates more precise entity embeddings and hence better alignment results.
Group III. BothJAPE andGCN-Alignharness the attributes
to complement entity embeddings, and their results exceed 8. The Hits@10 and MRR results of CEA are also missing in Table 4 and Table 5 because of the same reason.
TABLE 3
Experiment results on DBP15K.
Method
ZH-EN JA-EN FR-EN
Hits@1 Hits@10 MRR Hits@1 Hits@10 MRR Hits@1 Hits@10 MRR
MTransE 20.9 51.2 0.31 25.0 57.2 0.36 24.7 57.7 0.36 JAPE-Stru 37.2 68.9 0.48 32.9 63.8 0.43 29.3 61.7 0.40 GCN 39.8 72.0 0.51 40.0 72.9 0.51 38.9 74.9 0.51 RSNs 58.0 81.1 0.66 57.4 79.9 0.65 61.2 84.1 0.69 MuGNN 47.0 83.5 0.59 48.3 85.6 0.61 49.1 86.7 0.62 KECG 47.7 83.6 0.60 49.2 84.4 0.61 48.5 84.9 0.61 ITransE 33.2 64.5 0.43 29.0 59.5 0.39 24.5 56.8 0.35 BootEA∗ 61.4 84.1 0.69 57.3 82.9 0.66 58.5 84.5 0.68 NAEA∗ 38.5 63.5 0.47 35.3 61.3 0.44 30.8 59.6 0.40 TransEdge 75.3 92.4 0.81 74.6 92.4 0.81 77.0 94.2 0.83 JAPE 41.4 74.1 0.53 36.5 69.5 0.48 31.8 66.8 0.44 GCN-Align 43.4 76.2 0.55 42.7 76.2 0.54 41.1 77.2 0.53 HMAN 56.1 85.9 0.67 55.7 86.0 0.67 55.0 87.6 0.66 GM-Align∗ 59.5 77.9 0.66 63.5 83.0 0.71 79.2 93.6 0.85 RDGCN 69.7 84.2 0.75 76.3 89.7 0.81 87.3 95.0 0.90 HGCN 70.8 84.0 0.76 75.8 88.9 0.81 88.8 95.9 0.91 CEA 78.7N - - 86.3N - - 97.2N - -Embed 57.5 68.6 0.61 65.1 75.4 0.69 81.6 88.9 0.84 Lev 7.0 8.9 0.08 6.6 8.8 0.07 78.1 87.4 0.81 TABLE 4 Experiment results on SRPRS. Method
EN-FR EN-DE DBP-WD DBP-YG
Hits@1 Hits@10 MRR Hits@1 Hits@10 MRR Hits@1 Hits@10 MRR Hits@1 Hits@10 MRR
MTransE 21.3 44.7 0.29 10.7 24.8 0.16 18.8 38.2 0.26 19.6 40.1 0.27 JAPE-Stru 24.1 53.3 0.34 30.2 57.8 0.40 21.0 48.5 0.30 21.5 51.6 0.32 GCN 24.3 52.2 0.34 38.5 60.0 0.46 29.1 55.6 0.38 31.9 58.6 0.41 RSNs 35.0 63.6 0.44 48.4 72.9 0.57 39.1 66.3 0.48 39.3 66.5 0.49 MuGNN 13.1 34.2 0.20 24.5 43.1 0.31 15.1 36.6 0.22 17.5 38.1 0.24 KECG 29.8 61.6 0.40 44.4 70.7 0.54 32.3 64.6 0.43 35.0 65.1 0.45 ITransE 12.4 30.1 0.18 13.5 31.6 0.20 10.1 26.2 0.16 10.3 26.0 0.16 BootEA 36.5 64.9 0.46 50.3 73.2 0.58 38.4 66.7 0.48 38.1 65.1 0.47 NAEA 17.7 41.6 0.26 30.7 53.5 0.39 18.2 42.9 0.26 19.5 45.1 0.28 TransEdge 40.0 67.5 0.49 55.6 75.3 0.63 46.1 73.8 0.56 44.3 69.9 0.53 JAPE 24.1 54.4 0.34 26.8 54.7 0.36 21.2 50.2 0.31 19.3 50.0 0.30 GCN-Align 29.6 59.2 0.40 42.8 66.2 0.51 32.7 61.1 0.42 34.7 64.0 0.45 HMAN 40.0 70.5 0.50 52.8 77.8 0.62 43.3 74.4 0.54 46.1 76.5 0.56 GM-Align 57.4 64.6 0.60 68.1 74.8 0.71 76.2 83.0 0.79 80.4 83.7 0.82 RDGCN 67.2 76.7 0.71 77.9 88.6 0.82 97.4 99.4 0.98 99.0 99.7 0.99 HGCN 67.0 77.0 0.71 76.3 86.3 0.80 98.9 99.9 0.99 99.1 99.7 0.99 CEA 96.2N - - 97.1N - - 100.0N - - 100.0N - -Embed 58.1 66.8 0.61 62.6 77.6 0.68 100.0N 100.0 1.00 100.0N 100.0 1.00 Lev 85.1 90.1 0.87 86.2 92.1 0.88 100.0N 100.0 1.00 100.0N 100.0 1.00
the results of their structure-only counterparts, validating the usefulness of the attribute information. Also utilizing the attributes,HMANoutperformsJAPEandGCN-Align, since it also considers relation types as the model input.
The other four methods exploit entity name information, instead of attributes, for alignment, and achieve better results. Among them, the results of RDGCN and HGCN are close, surpassing GM-Align. This is partially because they employ relations to optimize the learning of entity embeddings, which was largely neglected in previous GNN-based EA models. CEAattains the best performance in this group, as it effectively exploits and fuses available features.
Name-based heuristics. On KG pairs with closely-related
languages, Lev attains promising results, whereas it fails to work on distantly-related language pairs, i.e., DBP15KZH-ENand
DBP15KJA-EN. As forEmbed, it achieves consistent performance
on all KG pairs.
Intra-category comparison. CEA achieves the best Hits@1
performance on all datasets. As for other metrics,TransEdge, RDGCNandHGCNattain the leading results. This verifies the effectiveness of using extra information, i.e., the bootstrapping strategy and textual information.
The performance of the name-based heuristics (i.e.,Embed) is very competitive, exceeding most of the methods that do not use entity name information in terms of Hits@1. This demonstrates that typical ER solutions can still work on the task of EA. Never-theless,Embedis still inferior to most EA methods that incorporate the entity name information, i.e.,RDGCN,HGCNandCEA.
It can also be observed that, methods from the first two groups, e.g., TransEdge, attain consistent results across all
three KG pairs, while the solutions utilizing the entity name information, e.g., HGCN, achieve much better results on the KG pairs with closely-related languages (FR-EN) than those with distantly-related languages (ZH-EN). This reveals that the language barriers can hamper the use of textual information and in turn hurt the overall effectiveness.
4.4 Results and Analyses on SRPRS
The results on SRPRS are reported in Table 4. There are some observations similar to DBP15K, which we will not elaborate. We focus on the differences from DBP15K, as well as the patterns specific to this dataset.
Group I. It is evident that the overall performance on SRPRS is lower than that on DBP15K, which indicates that these methods might not perform well on relatively sparse KGs.RSNs still outperforms the other approaches, which is closely followed byKECG. Notably, in contrast to the decent results on DBP15K, MuGNNattains much worse results on SRPRS, as there are no aligned relations on SRPRS, where the rule transferring fails to work. Also, the number of detected rules is much smaller, due to the sparser KG structure.
Group II. Among these solutions, TransEdge still yields
consistently superior results.
Group III. Compared withGCNandJAPE-Stru, incorporating
the attributes leads to better results forGCN-Align, while it does not contribute to the performance ofJAPE. This is because the number of attributes is relatively smaller in this dataset. In comparison, using entity names enhances the results to a much higher level. Note thatCEAattains ground-truth performance on SRPRSDBP-WDand SRPRSDBP-YG.
Name-based heuristics. LevandEmbedachieve ground-truth
performance on all mono-lingual EA datasets, since the names in the entity identifiers of DBpedia, Wikidata and YAGO are identical.Levalso achieves promising results on cross-lingual KG pairs with closely-related language pairs.
Intra-category comparison. Different from DBP15K, methods
that incorporate entity names (Group III) dominate on SRPRS. This is because: (1) the KG structure is less effective on this dataset (much sparser compared with DBP15K); and (2) the entity name information plays a very significant role on cross-lingual datasets with closely-related language pairs and mono-lingual datasets, where the names of equivalent entities are very similar.
4.5 Results and Analyses on DWY100K
The results on the large-scale mono-lingual dataset, DWY100K, are reported in Table 5. We fail to obtain the results ofRDGCN andNAEAunder our experimental environment, as they require extremely large amount of memory space.
Methods in the first group achieve more promising results on this dataset, which can be ascribed to the relatively richer KG structure (shown in Figure 3). Among them,MuGNNandKECG at-tain over 60% on DWY100KDBP-WDand 70% on DWY100KDBP-YGin
terms of Hits@1, as the rich structure facilitates the process of KG completion, which in turn enhances the overall EA performance. With the aid of the iterative training strategy, approaches in the second group further improve the results, whereas the results of BootEAandTransEdge are slightly lower than their reported values. As for methods in Group III,CEAachieves the ground-truth performance. Similarly, the name-based heuristics LevandEmbedalso attain ground-truth results.
4.6 Efficiency Analysis
For the comprehensiveness of the evaluation, we report the averaged running time on each dataset in Table 6 to compare the efficiency of state-of-the-art solutions, which can also reflect their scalability. We are aware that different parameter settings, e.g., the learning rate and the number of epochs, might influence the eventual time cost. However, here we merely aim to provide a general picture of the efficiency of these methods by adopting the parameters reported in their original papers. Again, we fail to obtain the results ofRDGCNandNAEAon DWY100K under our experimental environment, as they require extremely large amount of memory space.
On DBP15K and SRPRS,GCNis the most efficient method with consistent alignment performance, which is closely followed byJAPE-StruandITransE. For the other methods, most of them have the same magnitude of time costs (1,000-10,000s), except for NAEAandGM-Align, which require extremely higher running time. On the much larger dataset DWY100K, the time costs of all solutions climb dramatically, due to the larger number of parameters and higher computational costs. Among others, MuGNN,KECG,HMANcannot work by using the GPU because of the memory limitation, and we report the time cost by using the CPU as suggested by the authors of these approaches. It is noted that merely three methods can finish the alignment process within 10,000s, and the time costs for most approaches fall between 10,000s and 100,000s.GM-Aligneven requires 5 days to generate the results. This unveils that state-of-the-art EA methods still have low efficiency when dealing with data at very large scale. Some of them, such asNAEA,RDGCN, andGM-Align, have rather poor scalability.
4.7 Comparison with Unsupervised Approaches
As mentioned in Section 2.2, there are many unsupervised approaches designed for the alignment between KGs, which do not utilize representation learning techniques. For the comprehen-siveness of the study, we compare with a representative system, PARIS[51]. Built on the similarity comparison between literals, PARISuses a probabilistic algorithm to jointly align entities in an unsupervised manner. Besides, we also compare with Agree-mentMakerLight (AML) [17], an unsupervised ontology alignment system that leverages the background knowledge of KGs9.
We use the F1 score as the evaluation metric, sincePARISand AMLdo not output a target entity for every source entity so as to deal with entities that do not have a match in the other KG. The F1 score is the harmonic mean between precision (i.e., the number of correctly aligned entity pairs divided by the number of source entities for which an approach returns a target entity) and recall (i.e., the number of source entities for which an approach returns a target entity divided by the total number of source entities).
As depicted in Figure 4, the overall performance ofPARIS andAMLare slightly inferior toCEA. However, althoughCEA has more robust performance, it relies on the training data (seed entity pairs), which might not exist in the real-world KGs. In contrast, unsupervised systems work without requiring any training data, and can still output very promising results. Besides, by comparing the results ofPARISandAML, it shows that the ontology information indeed can improve the alignment results. 9. AML requires ontology information, which does not exist in current EA datasets. Therefore, we mine the ontology information for these KGs. However, we can only successfully run AML on SRPRSEN-FRand SRPRSEN-DE.
TABLE 5
Experiment results on DWY100K and DBP-FB.
Method
DWY100KDBP-WD DWY100KDBP-YG DBP-FB
Hits@1 Hits@10 MRR Hits@1 Hits@10 MRR Hits@1 Hits@10 MRR
MTransE 23.8 50.7 0.33 22.7 41.4 0.29 8.5 23.0 0.14 JAPE-Stru 27.3 52.2 0.36 21.6 45.8 0.30 4.7 16.1 0.09 GCN 49.4 75.6 0.59 59.8 82.9 0.68 17.8 42.3 0.26 RSNs 49.7 77.0 0.59 61.0 85.7 0.69 25.3 49.7 0.34 MuGNN 60.4 89.4 0.70 73.9 93.7 0.81 21.3 51.8 0.31 KECG 63.1 88.8 0.72 71.9 90.4 0.79 23.1 50.8 0.32 ITransE 17.1 36.4 0.24 15.9 36.1 0.23 3.0 10.0 0.06 BootEA∗ 69.9 86.1 0.76 61.1 77.5 0.69 21.2 42.5 0.29 TransEdge∗ 68.4 90.0 0.79 83.4 95.3 0.89 30.4 56.9 0.39 JAPE 33.9 60.9 0.43 21.6 45.7 0.30 6.5 20.4 0.12 GCN-Align 51.3 77.7 0.61 59.6 83.7 0.68 17.8 42.3 0.26 HMAN 65.5 89.7 0.74 77.6 93.8 0.83 25.9 54.2 0.36 GM-Align 86.3 92.2 0.89 78.3 82.3 0.80 72.1 85.5 0.77 RDGCN - - - 67.5 84.1 0.73 HGCN 98.4 99.2 0.99 99.2 99.9 0.99 77.9 92.3 0.83 CEA 100.0N - - 100.0N - - 96.3N - -Embed 100.0N 100.0 1.00 100.0N 100.0 1.00 58.3 79.4 0.65 Lev 100.0N 100.0 1.00 100.0N 100.0 1.00 57.8 78.9 0.64 TABLE 6
Averaged time cost on each dataset (in seconds).
Method DBP15K SRPRS DWY100K DBP-FB MTransE 6,467 3,355 70,085 9,147 JAPE-Stru 298 405 6,636 767 GCN 49 42 1,446 103 RSNs 7,539 2,602 28,516 7,172 MuGNN 3,156 2,215 47,735 9,049 KECG 3,724 1,800 125,386 51,280 ITransE 494 175 9,021 517 BootEA 4,661 2,659 64,471 4,345 NAEA 19,115 11,746 - -TransEdge 3,629 1,210 20,839 3,711 JAPE 5,578 586 21,129 1,201 GCN-Align 103 87 3,212 227 HMAN 5,455 4,424 31,895 8,878 GM-Align 26,328 13,032 459,715 53,332 RDGCN 6,711 886 - 3,627 HGCN 11,275 2,504 60,005 4,983 CEA 128 101 17,412 345 4.8 Module-level Evaluation
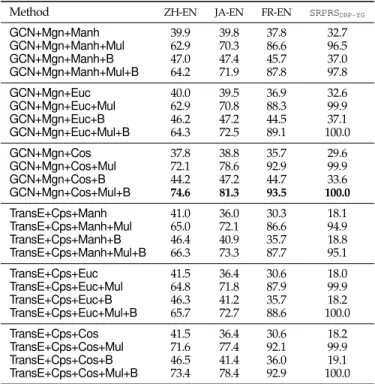
In order to gain insight into the methods used in different modules, we conduct the module-level evaluation and report corresponding experiment results. Specifically, we choose the representative methods from each module, and generate possible combinations. By comparing the performance of different combinations, we can get a clearer view of the effectiveness of different methods in these modules.
Regarding the embedding learning module, we use GCN andTransE. As for the alignment module, we adopt the margin-based loss function (Mgn) and the corpus fusion strategy (Cps). Following current approaches, we combineGCNwithMgn, and TransEwithCps, where the parameters are tuned in accordance toGCN-AlignandJAPE, respectively. In the prediction module, we use the Euclidean distance (Euc), the Manhattan distance (Manh) and the cosine similarity (Cos). With regard to the extra information module, we denote the use of the bootstrapping strategy asBby implementing the iterative method inITransE. The
0.000 0.100 0.200 0.300 0.400 0.500 0.600 0.700 0.800 0.900 1.000
AML PARIS CEA
Fig. 4. F1 scores of PARIS, AML and CEA on EA datasets.
use of multi-type information is represented asMul, and we adopt the semantic and string-level features of entity names as inCEA. The Hits@1 results of 24 combinations are shown in Table 710.
It can be observed that, adding the bootstrapping strategy and/or textual information indeed enhances the overall performance. Regarding the embedding model, theGCN+Mgnmodel appears to have more robust and superior performance thanTransE+Cps. Besides, the distance measures also have influence on the results. Compared withManhandEuc,Cosleads to better performance on TransE-based models, while it brings worse results on GCN-based models. Nevertheless, after incorporating entity name embeddings, usingCosleads to consistently better performance. Notably,GCN+Mgn+Cos+Mul+B(referred asCombEA) achieves the best performance, showcasing that a simple combination of the methods in existing modules can lead to promising alignment performance.
4.9 Summary
Based on the experimental results, we provide the following summaries.
10. The results on other datasets exhibit similar trends, and hence are omitted in the interest of space.
TABLE 7
Hits@1 results of module-level evaluation.
Method ZH-EN JA-EN FR-EN SRPRSDBP-YG
GCN+Mgn+Manh 39.9 39.8 37.8 32.7 GCN+Mgn+Manh+Mul 62.9 70.3 86.6 96.5 GCN+Mgn+Manh+B 47.0 47.4 45.7 37.0 GCN+Mgn+Manh+Mul+B 64.2 71.9 87.8 97.8 GCN+Mgn+Euc 40.0 39.5 36.9 32.6 GCN+Mgn+Euc+Mul 62.9 70.8 88.3 99.9 GCN+Mgn+Euc+B 46.2 47.2 44.5 37.1 GCN+Mgn+Euc+Mul+B 64.3 72.5 89.1 100.0 GCN+Mgn+Cos 37.8 38.8 35.7 29.6 GCN+Mgn+Cos+Mul 72.1 78.6 92.9 99.9 GCN+Mgn+Cos+B 44.2 47.2 44.7 33.6 GCN+Mgn+Cos+Mul+B 74.6 81.3 93.5 100.0 TransE+Cps+Manh 41.0 36.0 30.3 18.1 TransE+Cps+Manh+Mul 65.0 72.1 86.6 94.9 TransE+Cps+Manh+B 46.4 40.9 35.7 18.8 TransE+Cps+Manh+Mul+B 66.3 73.3 87.7 95.1 TransE+Cps+Euc 41.5 36.4 30.6 18.0 TransE+Cps+Euc+Mul 64.8 71.8 87.9 99.9 TransE+Cps+Euc+B 46.3 41.2 35.7 18.2 TransE+Cps+Euc+Mul+B 65.7 72.7 88.6 100.0 TransE+Cps+Cos 41.5 36.4 30.6 18.2 TransE+Cps+Cos+Mul 71.6 77.4 92.1 99.9 TransE+Cps+Cos+B 46.5 41.4 36.0 19.1 TransE+Cps+Cos+Mul+B 73.4 78.4 92.9 100.0
EA vs. ER. EA differs from other relevant tasks as it works
on graph-structured data. Consequently, all existing EA solutions use the KG structure to generate entity embeddings for aligning entities, which can achieve promising results on DBP15K and DWY100K. Nevertheless, solely relying on the KG structure has its limitations, since there exist long-tail entities that possess very limited structural information, or entities that have similar neighboring entities but do not refer to the same real-world object. As a remedy, some recent studies propose to incorporate textual information, and hence achieve better performance. This, however, raises a question about whether ER approaches can handle EA task, since the texts associated with entities are frequently used by typical ER solutions.
We answer this question by involving the name-based heuristics that have been used in most typical ER methods for comparison, and the experimental results reveal that: (1) ER solu-tions can work on EA, whereas the performance heavily depends on the textual similarity between entities; and (2) although ER solutions can outperform most structure-based EA approaches, they are still outperformed by EA methods that use the name informa-tion to complement entity embeddings; and (3) incorporating the main ideas in ER, i.e., relying on the literal similarity to discover the equivalence between entities, into EA methods, is a promising direction worthy of exploration (as demonstrated byCEA).
Influence of datasets. As shown in Figure 5, the performance of EA solutions varies greatly on different datasets. Generally, EA methods achieve relatively better results on dense datasets, i.e., on DBP15K and DWY100K. Besides, the results on mono-lingual KGs are better than those on cross-lingual ones (DWY100K vs. DBP15K). Particularly, on mono-lingual datasets, the most perfor-mant methodCEA, as well as the name-based heuristicsLevand Embed, attain 100% accuracy. This is because these datasets are extracted from DBpedia, Wikidata and YAGO, and the equivalent entities in these KGs possess identical names in the entity identi-fiers. However, these datasets fail to mirror the real-life challenge
of ambiguous entity names. To fill in this gap, we construct a new mono-lingual benchmark, which is to be detailed in Section 5.
D B P15K SPP R S D WY 10 0K
Fig. 5. The box plot of Hits@1 of all methods on different datasets.
4.10 Guidelines and Suggestions
In this section, we provide guidelines and suggestions for potential users of EA approaches.
Guidelines for practitioners. There are many factors that
might influence the choice of EA models. We select four most common factors and give the following suggestions:
• Input information. If the inputs only contain KG structure information, one might have to choose from the methods in Groups I and II. Conversely, if there exist abundant side information, one might want to use methods from Group III to take full advantage of these features and provide more reliable signals for alignment.
• The scale of data. As mentioned in Section 4.6, some
state-of-the-art methods have rather poor scalability. Therefore, the scale of data should be taken into consideration before making alignment decisions. For data of very large scale, one could use some simple but efficient models such as GCN-Alignto reduce the computational overhead.
• The objective of alignment. If one only focuses on the
alignment of entities, one might want to adopt GNN based models since they are usually more robust and scalable. Nevertheless, if there are additional tasks such as alignment of relations, one might want to use the KG representation based methods since they intrinsically learn both entity and relation representations. Besides, several recent studies [55], [60] demonstrate that the relations can help the alignment of entities.
• The trade-off in bootstrapping. The bootstrapping process
is effective, as it can progressively augment the training set and lead to increasingly better alignment results. Nevertheless, it suffers from the error propagation problem, which might introduce wrongly-matched entity pairs and amplify their negative effect on the alignment in the following rounds. Also, it can be time-consuming. Consequently, when deciding whether to use the bootstrapping strategy, one could estimate the difficulty of the datasets. If the datasets are relatively easy, e.g., with rich literal information and dense KG structures, exploiting the bootstrapping strategy might be a better choice. Otherwise, one should be careful when using such a strategy.
Suggestions for future research. We also discuss some open