arXiv:0904.1688v1 [astro-ph.SR] 10 Apr 2009
Astronomy & Astrophysicsmanuscript no. 11854 c ESO 2009
April 10, 2009
Letter to the Editor
The spin-orbit alignment of the Fomalhaut planetary system
probed by optical long baseline interferometry
⋆
J.-B. Le Bouquin
1, O. Absil
2⋆⋆, M. Benisty
3, F. Massi
3, A. M´erand
1, and S. Stefl
11 European Southern Observatory, Casilla 19001, Santiago 19, Chile
2 Institut d’Astrophysique et de G´eophysique, Universit´e de Li`ege, 17 all´ee du Six Aoˆut, B-4000 Sart Tilman, Belgium 3 INAF - Osservatorio Astrofisico di Arcetri, Largo E. Fermi 5, 50125 Firenze, Italy
Received 16/02/2009 ; Accepted 09/04/2009
ABSTRACT
Aims.We discuss the spin-orbit orientation of the Fomalhaut planetary system composed of a central A4V star, a debris disk, and a recently discovered planetary companion.
Methods.We use spectrally resolved, near-IR long baseline interferometry to obtain precise spectro-astrometric measurements across the Br-γ absorption line. The achieved astrometric accuracy of ±3 µas and the spectral resolution R = 1500 from the AMBER/VLTI instrument allow us to spatially and spectrally resolve the rotating photosphere.
Results.We find a position angle PAstar= 65◦±3◦for the stellar rotation axis, perfectly perpendicular with the literature measurement for the disk position angle (PAdisk = 156.◦0 ± 0.◦3). This is the first time such test can be performed for a debris disk, and in a non-eclipsing system. Additionally, our measurements suggest unexpected backward-scattering properties for the circumstellar dust grains. Conclusions.Our observations validate the standard scenario for star and planet formation, in which the angular momentum of the planetary systems are expected to be collinear with the stellar spins.
Key words.Stars: individual: Fomalhaut; Stars: planetary systems; Stars: rotation; Methods: observational; Techniques: high angular resolution; Techniques: interferometric
1. Introduction
At 7.7 pc from the Sun, Fomalhaut is one of the closest main sequence star surrounded by a spatially resolved debris disk. It has been studied at many different wavelengths ranging from the visible to the sub-millimetre regime. At long wavelengths (far-infrared and beyond), the disk shows a pair of intensity maxima interpreted as the ansae of an inclined ring about 140 AU in ra-dius (Holland et al. 2003; Stapelfeldt et al. 2004). This particular geometry was subsequently confirmed with HST/ACS imaging (Kalas et al. 2005), which also provided high accuracy estima-tions of the disk inclination and position angle: idisk = 65.◦9 ± 0.◦4
and PAdisk = 156.◦0 ± 0.◦3, under the assumption that the disc
is intrinsically circular. In the scattered light images, dust parti-cles are confined in a narrow ring about 25 AU in width, with sharp edges that suggest the presence of a planetary body at about 120 AU (Quillen 2006). It was also noted that the centre of the ring is shifted by 15 AU with respect to the central star position, pointing on still poorly understood dynamical effects that should also be related to the presence of planetary-mass or sub-stellar companions. Recently, the presence of a planetary companion at the expected orbital distance (119 AU) was finally confirmed with HST/ACS coronagraphic imaging (Kalas et al.
Send offprint requests to: J.B. Le Bouquin
e-mail: [email protected]
⋆ Based on observations collected at the VLTI (ESO Paranal, Chile), with the 082.C-0376 program from the AMBER Guaranteed Time of the Osservatorio Astrofisico di Arcetri (INAF, Italy).
⋆⋆ FNRS Postdoctoral Researcher
2008), which significantly boosted the general interest in this system.
The circumstellar dust around stars with ages above ∼10 Myr might be partially a remnant from the primordial disc. The disks could also be replenished by the populations of planetesimals that were not used to build up planet (Mann et al. 2006). These leftovers are supposed to produce dust by mutual collisions or cometary activity. The study of those debris disks provides one of the best means to explore the properties (size, density, orien-tation) and evolution of planetary systems.
In standard planet formation scenarios, the disk and the as-sociated planets are expected to be in the equatorial plane of the central star, like our Kuiper Belt which is within 2◦ of the in-variable plane of the Solar system (Brown & Pan 2004). Yet, as far as debris disks (and circumstellar disks in general) are con-cerned, this simple observational prediction has never been put into test. More generally, the common assumption of collinear-ity between planetary orbital axis and stellar spins has only been tested on the Solar system, with a relevant accuracy (∼ 1◦), and on a few transiting extrasolar giant planets with a rather poor accuracy (∼ 10◦, by the mean of the Rossiter-McLaughlin spec-troscopic effect, Rossiter 1924). In at least one case, XO-3b, a large spin-orbit misalignment is suggested by the observations (70◦±15◦, H´ebrard et al. 2008). Additionally, the recent contro-versy about the spin-orbit alignment of HD 17156b illustrates well the difficulty of such a technique, with measured spin-orbit misalignments of 62◦ ±25◦ by Narita et al. (2008) and later 9.◦4 ± 9.◦3 by Cochran et al. (2008). Up to now, this test has never been performed in non-transiting systems, because it is generally
a1 a2 a3 b1 b2 b3 c1 c2 c3 d1 d2 d3 −100 0 100 −100 0 100 <− East (m) North (m) −>
Fig. 1. Projected baselines of the observations. Each observation
(a, b, c and d, draw with different symbols) is composed of 3 baselines (1,2,3) along which the projections of the 2D spectro-astrometric displacements are measured (see Fig. 2).
impossible to recover the orientation of the rotational axis of the central star.
With the advent of spectrally dispersed optical long base-line interferometry, it becomes possible to put this hypothesis into test by spatially and spectrally resolving the stellar photo-spheres, even marginally. Indeed, this technique allows the ori-entation of stellar axes to be quickly (geometrically) recovered by differential astrometry across a photospheric line enlarged by the stellar rotation. The purpose of this Letter is to perform this test in the case of Fomalhaut, which advantageously com-bines a fast projected rotational velocity of 93 km/s (Royer et al. 2007) and a relatively large apparent diameter of Φ = 2.2 mas (Di Folco et al. 2004).
2. Observation and data reduction
Data have been collected at the Very Large Telescope Interferometer (VLTI, Haguenauer et al. 2008) with the AMBER beam combiner (Petrov et al. 2007) recording spec-trally dispersed fringes between 1.92 − 2.28 µm at a spectral resolution of R = 1500. The Auxiliary Telescopes (ATs) were placed at stations D0–H0–G1 and A0–K0–G1. Observations were assisted by the fringe-tracker FINITO, allowing an indi-vidual exposure time of 200 ms in AMBER (Le Bouquin et al. 2008). The seeing ranged 0.8” to 1.2”. FINITO provided good locking ratio and fringe tracking performance. Observations of calibration stars were interleaved with those of the science tar-get. Unlike most classical interferometric observations, the only prerequisite for calibrators is not to show spectro-astrometric features around the Br-γ line. We therefore favour cool giants because they have less pronounced Br-γ lines and smaller rotation velocities. The observation log is given in Table 1. Regarding the magnitudes, Fomalhaut is 1.00 Kmag, γ Scl is
1.72 Kmag, and 88 Aqr is 0.98 Kmag. Because it is fainter, data on
γScl have been obtained with slightly longer integration time. This has no incidence on the differential analysis made in this paper.
Phases of interferometric fringes were computed using the latest version of the amdlib package (version 2.99, Chelli et al., private communication) and the interface provided by the
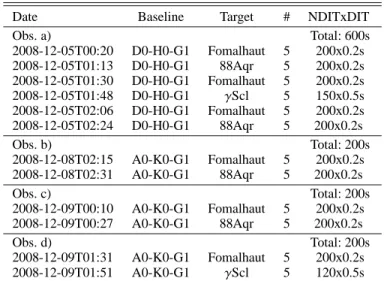
Table 1. Observation log with the number of files (#), the
num-ber of frames per file (NDIT) and the elementary integration time (DIT). Calibration stars are in italic.
Date Baseline Target # NDITxDIT
Obs. a) Total: 600s 2008-12-05T00:20 D0-H0-G1 Fomalhaut 5 200x0.2s 2008-12-05T01:13 D0-H0-G1 88Aqr 5 200x0.2s 2008-12-05T01:30 D0-H0-G1 Fomalhaut 5 200x0.2s 2008-12-05T01:48 D0-H0-G1 γScl 5 150x0.5s 2008-12-05T02:06 D0-H0-G1 Fomalhaut 5 200x0.2s 2008-12-05T02:24 D0-H0-G1 88Aqr 5 200x0.2s Obs. b) Total: 200s 2008-12-08T02:15 A0-K0-G1 Fomalhaut 5 200x0.2s 2008-12-08T02:31 A0-K0-G1 88Aqr 5 200x0.2s Obs. c) Total: 200s 2008-12-09T00:10 A0-K0-G1 Fomalhaut 5 200x0.2s 2008-12-09T00:27 A0-K0-G1 88Aqr 5 200x0.2s Obs. d) Total: 200s 2008-12-09T01:31 A0-K0-G1 Fomalhaut 5 200x0.2s 2008-12-09T01:51 A0-K0-G1 γScl 5 120x0.5s
Jean-Marie Mariotti Center1. Following a standard fringe selec-tion criterion, we have kept the 80% best frames. Consecutive observations of Fomalhaut were grouped into single data points with enhanced signal-to-noise ratio (SNR), referred to as obser-vations a, b, c, and d in Table 1. Accordingly, the obserobser-vations of the calibration stars were also appended into single, high quality measurements of the instrumental phase. Such an average in-troduces baseline smearing. Considering the worst case of 2h, we estimated the smearing of the astrometric signal to be less than 20%. This is a reasonable price to pay to obtain clear de-tections on all dataset. After the calibration of scientific data, we therefore end up with a set of 4 observations of Fomalhaut (see Table 1), each of them composed of the 3 phase spectra from the AMBER spectrograph. While signal was also detected in the visibility, we decided to focus the analysis of this letter on the phase, which contains the astrometric quantity.
The unavoidable atmospheric dispersion appears as a global curvature of the fringe phases over the K band. It cancels per-fectly when computing the sum of the 3 phase spectra, demon-strating that the baselines are consistent to each others in term of sign (so in direction on sky). Subtracting the instrumental phase from the scientific phase removed all fine spectral features down to a level of 0.◦5 (uncertainty level). However, atmospheric dispersion was not perfectly canceled out. It was efficiently re-moved by fitting the spectral range 2.03−2.27 µm with an ad-hoc polynomial law of order 3. As a matter of fact, phase measure-ments are relative to the continuum value which we suppose to have a zero phase. It may not be perfectly true because of the gravity darkening in the fast rotating atmosphere. However, such effect would not bias our measurement.
The calibrated differential phases φ were converted into differential astrometric shifts p using the well-known formula for marginally resolved interferometric observation (Lachaume 2003):
p = − φ 2π·
λ
B (1)
B is the length of the interferometric baseline and λ is the effec-tive wavelength of the spectral channel considered. p represents the projection, on the baseline direction, of the 2D photocenter
0.8 0.9 1.0 a1: G1−D0 a2: D0−H0 a3: H0−G1 b1: K0−G1 b2: G1−A0 b3: A0−K0 c1: K0−G1 c2: G1−A0 c3: A0−K0 d1: K0−G1 d2: G1−A0 d3: A0−K0 −2000 −1000 0 1000 2000 0.2 0.4 0.6 0.8 ∆v (km/s) Spect. φ . λ / (2 π .B) (mas)
Fig. 2. Top: continuum-normalized spectrum obtained with
AMBER for a spectral window centered on the Br-γ line. Bottom: Differential phase measurements converted into spectro-astrometric shifts p(λ) in mas. Colours represent the po-sition within the line, from blue to red. The solid lines link the results, reprojected on the baselines, of the global 2D astrometric solution p(λ) performed independently for each spectral chan-nel. Phase spectra are shifted vertically by 0.08 mas.
in the plane of the sky, hereafter called p. A single astrometric solution (i.e. a single 2D vector p) was fitted to all observations available within a single spectral channel (i.e. the 12 projections p). This global fit is perfectly linear and has the advantage of showing the ultimate astrometric performance. However, the re-sulting astrometric signal p(λ) can be slightly biased (towards reduced amplitude) because of the smearing that may occur in case of different spectral calibration between the observations. This has no impact on the astrophysical interpretation made in the following. The differential astrometric shifts p(λ) are repre-sented by the dots and the error bars in Fig. 2. The result of the global fit by the 2D vector p(λ) is represented, reprojected on the baselines, by the solid lines that connect the fitted values.
Uncertainties were propagated into the astrometric vector p by standard formulae. We did not take into account the uncer-tainty on the baseline length nor on the spectral calibration be-cause they affect all spectral bins in the same way and therefore have negligible effect on our final observable. The astrometric error ellipses were found to be almost circular thanks to the rela-tively uniform u, v plane coverage provided by our observations
(see Fig. 1). Uncertainties are in the range ±2 µas to ±6 µas, with typically ±3 µas across the Br-γ line. It is among the most pre-cise spectro-astrometric measurements ever achieved, if not the best.
When talking about potential bias, our main concern was the presence of a possible artifact on the differential phase φ(λ) due to the particular spectrum of our target (A4V, i.e. strong Br-γ absorption line) in comparison to the calibrator spectrum (K gi-ants, i.e. almost no Br-γ line). However, an instrumental artifact linked to the AMBER spectrograph would rotate on sky between observations a), b), c) and d), following the rotation of the asso-ciated baseline triangles (see table 1 and fig. 1). The good agree-ment between the signal obtained during 3 different nights and on different configurations confirms its astrophysical origin. As an additional test, we observed other fast rotating stars and ob-tained various kinds of spectro-astrometric signals, as well as expected non-detection on small photospheres.
3. The Fomalhaut rotation axis
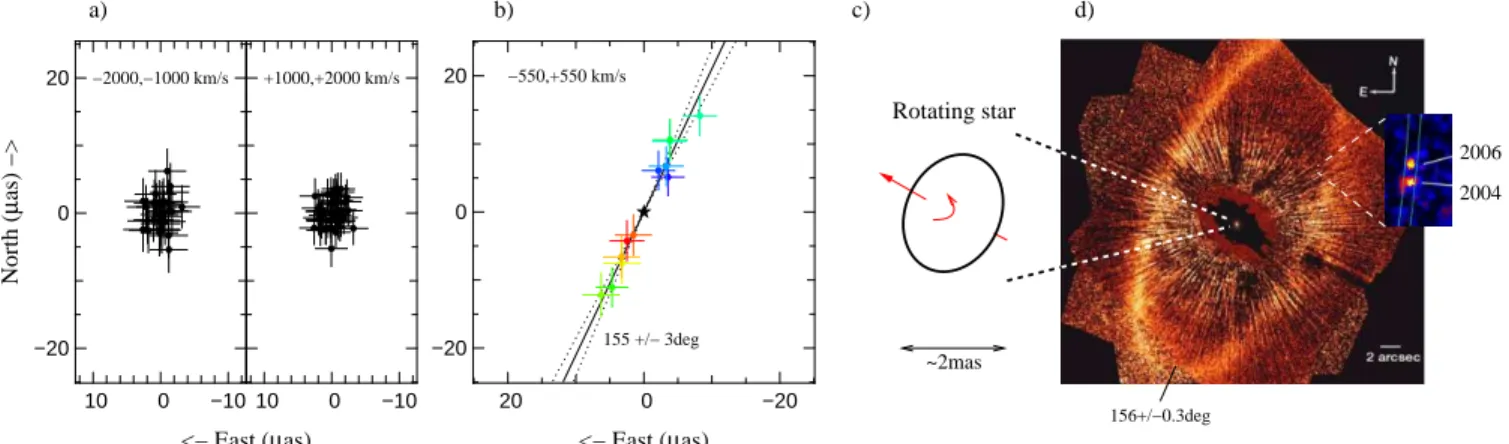
Our observations represent the most precise spectro-astrometric displacements ever measured with the AMBER instrument (±3 µas in the Br-γ line). To extract the scientifically useful in-formation, we plot the spectro-astrometric photocenters onto the plane of the sky. As a first check, we plot the photocenters in two spectral windows of continuum around the Br-γ line (Fig. 3a). The dispersion of the data points as a function of wavelength in the continuum is fully compatible with our estimated uncertain-ties (±3 µas) and shows no systematic behaviour or unexpected features at our precision level.
On the contrary, a significant astrometric displacement is de-tected when plotting the signal across the Br-γ line (Fig. 3b). The photocentre is displaced in one direction on the blue wing of the line, and is identically displaced on the opposite direction on the red wing. The shift is compatible with zero in the centre of the line, and its maximum amplitude in the line wings reaches about 15 µas. This is a clear detection of the effect of rotation on the stellar photosphere, from which the Br-γ absorption line originates. Interpreting such a small astrometric shift does not require deep modelling of the fast rotating atmosphere. In par-ticular, the astrometric displacement is necessarily perpendicular to the position angle of the stellar rotation axis. Fitting our com-plete data set, we find the stellar rotation axis to have position an-gle PAstar= 65◦±3◦. This value is perfectly perpendicular to the
literature measurement for the disk angle PAdisk = 156.◦0 ± 0.◦3
(Fig. 3c and 3d).
Theoretically, an estimation of the inclination angle istar is
also possible from spatially and spectrally resolved interfer-ometric observations by using rapidly rotating stellar photo-spheric models (Domiciano de Souza et al. 2002). However, the limited accuracy and spectral resolution of our data does not allow the stellar inclination to be constrained in a meaning-ful way. We note that Fomalhaut has been observed intensively in broad-band interferometry with the VINCI/VLTI instrument (Di Folco et al. 2004; Le Bouquin et al. 2006), but these obser-vations, even when considered as a whole, did not allow to re-cover the inclination angle, mostly due to the very small ex-pected oblateness ratio of the Fomalhaut photosphere (∼2%, O. Absil et al., in preparation). Weak constraints on the stel-lar inclination can nevertheless be extracted from simple phys-ical assumptions. The maximum permissible break-up veloc-ity for Fomalhaut is close to 390 km/s according to von Zeipel equations with typical values for A5V stars (2 M⊙and 1.7 R⊙). Assuming a projected rotational velocity of 93 km/s (Royer et al.
156+/−0.3deg −2000,−1000 km/s −10 0 10 −20 0 20 +1000,+2000 km/s −10 0 10 −550,+550 km/s 155 +/− 3deg −20 0 20 −20 0 20 <− East (µas) <− East (µas) North ( µ as) −> c) d) Rotating star ~2mas b) a) 2004 2006
Fig. 3. AMBER spectro-astrometric positions p(λ) in the continuum (a) and across the Br-γ absorption line (b). Colors refer to
the wavelength bin, as shown in Fig. 2. The signature of the rotating photosphere (c) is clearly detected and is compared to the debris disk and the planetary companion (d) imaged in the visible by Kalas et al. (2008). For the sake of clarity, the astrometric error ellipses are represented by their projection into the North and East directions.
2007), it gives a lower limit istar>15◦. We conclude that the
cur-rent existing constraints are compatible with the literature value for the disk inclination (idisk = 65.9◦), but does not represent a
significant test. Interferometric observations at higher precision, higher spectral resolution, and ideally with longer baselines may certainly answer this important point.
Besides constraining the orientation of the stellar photo-sphere, spatially and spectrally resolved observations also con-strain the direction of its spin vector. Taking into account that the Br-γ line is in absorption, we conclude that the South-East part of the star is moving towards us. If we assume that the or-bital angular momentum of the planetary companion points to-wards the same direction as the stellar spin, the Western side of the debris disk is located on the observer’s side of the sky plane. Combined with the observed increased brightness in the Eastern part of the disk (Kalas et al. 2005), it suggests that the dust grains are mostly backward-scattering. This finding is in contradiction with the well-known forward-scattering properties of circumstellar dust grains in our Solar system, generally as-sumed to be true in all debris disks (e.g., Weinberger et al. 1999; Kalas et al. 2005). Unfortunately, this question only appeared as a very interesting by-product at the time of the study, and our ob-serving strategy has not been specifically designed to answer it. Especially, no check star is available in the data-set to perfectly secure the sign of the AMBER phase.
We did our best to calibrate the phase sign a-posteriori. First we checked that a positive delay corresponds to a nega-tive phase as measured by the AMBER reduction package we used. Secondly, we converted the phase curvature across the K-band (due to atmospheric refraction) into actual position in sky. We found that the blue part of the band is indeed shifted to-ward the zenith (as it should be). However, even if we are confi-dent, we cannot draw definite conclusions before a real spectro-astrometric reference has been observed.
4. Conclusions
From the technical point of view, these observations are a strong validation of the remarkable potential of the spectro-interferometer AMBER/VLTI, especially in its Medium Resolution mode and associated with the fringe-tracker FINITO. Stacking 17 min of effective integration on a K = 0.94mag star,
we were able to reach a spectro-astrometric accuracy of ±3 µas.
Associated with a spectral resolution R = 1500, this was enough to resolve the rotating photosphere of Fomalhaut, with an appar-ent diameter of 2.2 mas and a rotational velocity of 93 km/s. We believe this to be the first detection of the astrometric displace-ment created by an absorption line in a fast rotating photosphere. Fitting our complete dataset, we find the position angle of Fomalhaut rotation axis to be PAstar = 65◦ ± 3◦, perfectly
perpendicular to the literature measurement for the disk angle PAdisk = 156.◦0 ± 0.◦3. This is the first time such a test could be
performed outside the Solar system for a non-eclipsing system. However, as when using the Rossiter-McLaughlin method, the inclination angle remains unknown. We can only conclude that there is strong evidence, but no definite proof, that the plane-tary system of Fomalhaut is in the equatorial plane of the central star. Additionally, by determining the direction of the stellar spin vector, we demonstrate that the technique is able to constrain the scattering properties of the dust grains surrounding Fomalhaut. Such measurements as presented in this paper are only possible thanks to the remarkable combination of a fast stellar rotation, a large stellar apparent diameter, the presence of a resolved disk, and of a planetary companion with resolved orbital motion.
We plan to continue observing the Fomalhaut system to pro-vide even better constraints on the rotation of the central star, as well as to extend the study to other fast rotating stars hosting resolved debris disks.
Acknowledgements. JBLB warmly thanks the complete VLTI team of the Paranal Observatory. This work has made use of the Smithsonian/NASA Astrophysics Data System (ADS) and of the Centre de Donnees astronomiques de Strasbourg (CDS). Graphics were performed with Yorick2.
References
Brown, M. E. & Pan, M. 2004, AJ, 127, 2418
Cochran, W. D., Redfield, S., Endl, M., & Cochran, A. L. 2008, ApJ, 683, L59 Di Folco, E., Th´evenin, F., Kervella, P., et al. 2004, A&A, 426, 601
Domiciano de Souza, A., Vakili, F., Jankov, S., Janot-Pacheco, E., & Abe, L. 2002, A&A, 393, 345
Haguenauer, P., Abuter, R., Alonso, J., et al. 2008, in SPIE Conf., Vol. 7013 H´ebrard, G., Bouchy, F., Pont, F., et al. 2008, A&A, 488, 763
Holland, W. S., Greaves, J. S., Dent, W. R. F., et al. 2003, ApJ, 582, 1141 Kalas, P., Graham, J. R., Chiang, E., et al. 2008, Science, 322, 1345 Kalas, P., Graham, J. R., & Clampin, M. 2005, Nature, 435, 1067 Lachaume, R. 2003, A&A, 400, 795
Le Bouquin, J.-B., Abuter, R., Bauvir, B., et al. 2008, in SPIE Conf., Vol. 7013
Le Bouquin, J.-B., Labeye, P., Malbet, F., et al. 2006, A&A, 450, 1259 Mann, I., K ¨ohler, M., Kimura, H., Cechowski, A., & Minato, T. 2006, A&A Rev.,
13, 159
Narita, N., Sato, B., Ohshima, O., & Winn, J. N. 2008, PASJ, 60, L1+ Petrov, R. G., Malbet, F., Weigelt, G., et al. 2007, A&A, 464, 1 Quillen, A. C. 2006, MNRAS, 372, L14
Rossiter, R. A. 1924, ApJ, 60, 15
Royer, F., Zorec, J., & G ´omez, A. E. 2007, A&A, 463, 671
Stapelfeldt, K. R., Holmes, E. K., Chen, C., et al. 2004, ApJS, 154, 458 Weinberger, A. J., Becklin, E. E., Schneider, G., et al. 1999, ApJ, 525, L53
List of Objects ‘Fomalhaut’ on page 1 ‘Fomalhaut’ on page 2 ‘Fomalhaut’ on page 2 ‘Fomalhaut’ on page 2 ‘Fomalhaut’ on page 3 ‘Fomalhaut’ on page 3 ‘Fomalhaut’ on page 3 ‘Fomalhaut’ on page 4 ‘Fomalhaut’ on page 4 ‘Fomalhaut’ on page 4 ‘Fomalhaut’ on page 4 ‘Fomalhaut’ on page 4