ORIGINAL
Circulating biomarkers may be unable
to detect infection at the early phase of sepsis
in ICU patients: the CAPTAIN prospective
multicenter cohort study
Marianna Parlato
1, François Philippart
2,3, Alexandra Rouquette
4,5, Virginie Moucadel
6, Virginie Puchois
1,
Sophie Blein
6, Jean‑Pierre Bedos
7, Jean‑Luc Diehl
8,9, Olfa Hamzaoui
10, Djillali Annane
11,12, Didier Journois
5,13,
Myriam Ben Boutieb
4, Laurent Estève
6, Catherine Fitting
1, Jean‑Marc Treluyer
5,14, Alexandre Pachot
6,
Minou Adib‑Conquy
1, Jean‑Marc Cavaillon
1, Benoît Misset
2,15,16*and The Captain Study Group
© 2018 Springer‑Verlag GmbH Germany, part of Springer Nature and ESICMAbstract
Purpose: Sepsis and non‑septic systemic inflammatory response syndrome (SIRS) are the same syndromes, differing by their cause, sepsis being secondary to microbial infection. Microbiological tests are not enough to detect infection early. While more than 50 biomarkers have been proposed to detect infection, none have been repeatedly validated. Aim: To assess the accuracy of circulating biomarkers to discriminate between sepsis and non‑septic SIRS.
Methods: The CAPTAIN study was a prospective observational multicenter cohort of 279 ICU patients with hypo‑ or hyperthermia and criteria of SIRS, included at the time the attending physician considered antimicrobial therapy. Investigators collected blood at inclusion to measure 29 plasma compounds and ten whole blood RNAs, and—for those patients included within working hours—14 leukocyte surface markers. Patients were classified as having sepsis or non‑septic SIRS blindly to the biomarkers results. We used the LASSO method as the technique of multivariate analysis, because of the large number of biomarkers.
Results: During the study period, 363 patients with SIRS were screened, 84 having exclusion criteria. Ninety‑one patients were classified as having non‑septic SIRS and 188 as having sepsis. Eight biomarkers had an area under the receiver operating curve (ROC‑AUC) over 0.6 with a 95% confidence interval over 0.5. LASSO regression identified CRP and HLA‑DRA mRNA as being repeatedly associated with sepsis, and no model performed better than CRP alone (ROC‑AUC 0.76 [0.68–0.84]).
*Correspondence: benoit.misset@chu‑rouen.fr
15 Intensive Care Unit, Service de Réanimation Médicale, Hôpital Charles Nicolle, Hôpitaux de Rouen, 1 rue de Germont, Rouen, France Full author information is available at the end of the article Marianna Parlato and François Philippart are first co‑authors. The members of the CAPTAIN study team are provided in the Acknowledgements section.
Minou Adib‑Conquy: Deceased.
The results of this paper were presented in part at the annual congress of the European Shock Society in September 2017 in Paris, France, and accepted for presentation at the annual congress of the French Society for Intensive Care in January 2018 in Paris, France.
Introduction
The systemic inflammatory response syndrome (SIRS) is a generalized inflammatory response in organs remote to an initial insult. Infection is caused by the invasion of normally sterile tissue, fluid, or body cavity by a poten-tially pathogenic microorganism [1]. When the insult causing SIRS is an infection, it is called sepsis [2]. Sepsis affects about 18 million people a year and its mortality is estimated between 35% and 55% [3].
When infection is due to bacteria or fungi, urgent anti-microbial treatment is required to reduce mortality [4, 5]. Optimization of early antimicrobial agent requires one to confirm infection as soon as patients present clini-cal severity, such as a high quick SOFA score or serum lactate levels [6]. As clinical information alone is rarely sufficient to detect sepsis, many biomarkers have been studied, but few were consistently associated with infec-tion in this context [7]. The most studied biomarkers were procalcitonin (PCT) [8], C-reactive protein (CRP), soluble triggering receptor expressed on myeloid cell-1 (sTREM1), neutrophil expression of the high-affinity immunoglobulin-Fc fragment receptor I (cluster of dif-ferentiation 64, CD64) [9–11], interleukin-6 (IL-6), IL-1 receptor antagonist (IL-1ra), pro-vasopressin (or copep-tin), and pro-adrenomedullin (pro-ADM). CRP and PCT have been shown to help to decrease antibiotic use [8,
12]. To improve the diagnostic accuracy of these bio-markers, several [10, 13, 14] attempted to develop bio-marker combinations but none have been repeatedly validated.
Discrepancies in the results of the published studies may be due to heterogeneity in infection locations, ini-tial severity, pathogens, or populations studied [15]. A biomarker able to distinguish between sepsis and non-septic SIRS would help in reducing use of antibiotics and searching for other causes of the patients’ vital dysfunc-tions [15].
The aim of our study was to assess, in intensive care unit (ICU) patients with SIRS, the accuracy of individ-ual or combined circulating biomarkers to discriminate between sepsis and non-septic SIRS. Our hypothesis was that, by studying a large panel of markers, it would be possible to obtain a predictive model which performs better than those previously published, and specifically procalcitonin [16].
Methods Study design
We set up the CAPTAIN study (Combined Approach for The eArly diagnosis of INfection in sepsis) as an obser-vational multicenter prospective cohort of ICU patients with SIRS criteria [1], as soon as they were considered for antibiotic therapy. We designed and conducted this study according to STROBE (STrengthening the Reporting of OBservational studies in Epidemiology) guidelines [17] (electronic supplementary material (ESM) Table 1). The protocol was approved by the Comité de Protection des Personnes Ile de France XI (#2010-A00908-31-10056) on September 13, 2010 and registered as NCT01378169 on clinicaltrials.gov.
Setting
Patients were recruited in seven ICUs located in five hospitals in the Paris area. They were included from December 2011 to April 2013. Blood samples for bio-markers were collected at inclusion. Blood samples for cell surface biomarkers were collected from those patients included when the research laboratory was open, owing to the necessity to perform extemporane-ous analysis.
Participants
ICU patients with hypothermia (below 36.0 °C) or hyper-thermia (over 38.0 °C) and at least another criterion of SIRS were eligible as soon as the physician considered antibiotic therapy. Other inclusion criteria were age over 18 years, affiliation to the national health insurance sys-tem, no treatment limitation, and no underlying immuno-suppression (AIDS, immunosuppressive therapy, ongoing malignancy, organ or bone marrow transplant, or drug-induced leukopenia). In a preliminary protocol, admission to the ICU was required to be less than 12 h (clinicaltri-als.gov), but this criterion was abandoned before starting the study. Patient consent was collected if he/she was con-scious and able to understand. The consent was waived in other situations.
Conclusions: The circulating biomarkers tested were found to discriminate poorly between sepsis and non‑septic SIRS, and no combination performed better than CRP alone.
Keywords: Sepsis, Cohort, CRP, HLA‑DRA mRNA
Take‑home message
The circulating biomarkers tested were found to discriminate poorly between sepsis and non‑septic SIRS. No combination performed better than CRP alone.
Outcome definition: sepsis and non‑septic SIRS diagnosis
Patients were classified as having sepsis in the presence of bacterial or fungal infection, or non-septic SIRS in other cases [1]. We called infections the diseases for which antibiotics were genuinely found to be useful. These dis-eases are a subgroup of the disdis-eases for which antibiot-ics are recommended (i.e., suspicions of infections) and a larger group than the group of patients with bacteremia. For this reason, we had to refer to infections which are confirmed a posteriori, based on criteria which confirm infection as much as possible, either with or without pos-itive cultures. A so-called gold standard for infection does not exist. In fact, as previously stated, the definition of infection and its causal link with SIRS required medical interpretation [18] and were based on Infectious Diseases Society of America (IDSA) guidelines. They were adjudi-cated blindly to the studied biomarkers, by two investi-gators (FP and BM). They reviewed the patients’ records, including clinical history, results of routine morpho-logic, biological, or microbiological tests, and response to therapies during the days following inclusion. Among the biomarkers studied, CRP and PCT were not collected for routine purpose in two units (17.6% of the patients), were collected occasionally but were not considered as part of the diagnostic of sepsis in four units (71.7%), and were collected in routine and usual part of the sep-sis diagnosep-sis in one unit (10.8%). CRP and PCT were not provided to the two adjudicators. Strains were considered as infecting, colonizing, or contaminants. Infection could be considered as present despite the absence of a positive microbiological sample, e.g., in cases of abscess or pneu-monia. When bacteremia was present, it was linked to the most probable anatomical focus of infection. Viruses were only searched for in case of influenza suspicion and were classified as non-septic SIRS. Disagreements on classification were resolved after discussion between the two adjudicators.
Study biomarkers
Fifty-three biomarkers were selected because they had been proposed in prior publications. Of these, 14 cell sur-face biomarkers were assessed only for samples collected and delivered to the laboratory during open hours. Blood samples were collected in PAXgene®, EDTA and
heparin-ized tubes and transferred to Institut Pasteur’s laboratory within 2 h after collection, in a cool bag. The methods of quantification were ELISA and multiplex analysis for 7 and 22 plasma biomarkers, respectively, real-time poly-merase chain reaction (RT-PCR) for 10 whole blood RNA biomarkers, and flow cytometry for 14 cell surface biomarkers (ESM Table 2). The analytic methods are reported in ESM Section 2.5. The kits used, the limits
of quantification, and the primer and probe designs for mRNAs are reported on ESM Tables 3, 4, and 5.
Clinical and routine biological data
Demographics, reasons for ICU admission, underlying diseases, simplified acute severity score (SAPS 2) [19], physiological data, Sequential Organ Failure Assessment (SOFA) score [20], and length of organ failure supply were collected at admission to the ICU, at inclusion in the study, and over the ICU stay.
Data management and statistics Sample size
The area under the receiver operating characteris-tic curve (ROC-AUC) of PCT for sepsis diagnosis was reported to be 0.78 [95% CI 0.73–0.83] in 2007 [16]. We hypothesized that the ROC-AUC of the best combination tested in our population would reach 0.85. Three hun-dred patients needed to be included (150 in each group, type I error risk = 0.05, power = 0.80, correlation between the two ROC-AUCs = 0.4) to find a significant difference between the biomarker combination ROC-AUC and the ROC-AUC of PCT alone [21] under this hypothesis. As we could not be sure that the ratio of sepsis to non-septic SIRS patients would be 1:1 and as we expected missing data, we decided to screen 360 patients.
Data analysis
A statistical analysis plan (SAP) was prepared prior to data collection in the protocol. It included the selection of biomarkers associated with sepsis in bivariate analy-ses with a p value < 0.2, followed by a multivariate logis-tic regression to identify the biomarkers independently linked with the outcome. This first analytical strategy identified CRP as the only biomarker being significantly linked with sepsis (data not shown). However, miss-ing data were numerous and we decided to use a more powerful analytical strategy to handle the large number of biomarkers (logistic LASSO regression) alongside with missing data (multiple imputations) (ESM 2.7.2.1) [22]. Data were described using median [IQR] and frequency (%). We used three imputation methods for values below the lower limit of quantification (LLoQ), over the upper limit of quantification (ULoQ), and for missing data. Col-linearity among continuous markers was assessed using Spearman correlation coefficient. The ROC-AUC was used to evaluate diagnostic accuracy of each continuous marker in univariate analyses. Rubin’s rules [23] were applied to combine correlations, ROC-AUCs, and their 95% associated confidence intervals over the imputed data sets. A p value of 0.05 was considered significant in all comparisons.
Modeling strategy
LASSO is a modelling method [22, 24] (ESM 2.7.3) used to select a subset of the strongest predictors associated with a given outcome, according to a shrinkage param-eter λ. It includes the construction of multiple predictive train and test models by bootstrap, the determination and application of a λ value giving the best compromise between high ROC-AUC values and low optimism, and the selection of the biomarkers that are the most fre-quently selected in the predictive models. Independ-ent variables are Independ-entered altogether in the model, and a subset of them is selected as output. The number of selected variables depends on λ: the higher λ, the fewer variables selected. Optimism is observed when perfor-mances of a predictive model are estimated for samples that were used to build this model. Model coefficients are optimized to fit as much of the data used to train it as possible. It is expected that the performance of a model applied to new data that were not used to train the model will be lower, but more representative of the performance one can expect in real life. Additional methodological and statistical details can be found in the ESM.
Results Participants
A total of 363 patients were screened and 279 were included. Non-inclusions were due mostly to refusal of consent or to absence of an inclusion criterion (Fig. 1). A total of 188 were classified as sepsis and 91 as non-septic SIRS. The adjudicators similarly classified 239 patients (85.6%), and 40 (14.3%) were classified by consensus after initial disagreement. All patients had exploration of plasma circulating biomarkers and 110 (77 sepsis and 33 non-septic SIRS patients) had exploration of cell surface biomarkers. These patients had a slightly higher severity at inclusion (SOFA score = 11 [9–14] versus 9 [9, 10]). While the number of inclusions was lower than expected in the non-septic SIRS group, we decided to assess the ROC-AUC of PCT, because it was the basis of our sample size calculation. The ROC-AUC of PCT was 0.55 [0.47– 0.62], which was lower than expected [16]. This made our sample size estimate excessive and we decided to stop including patients.
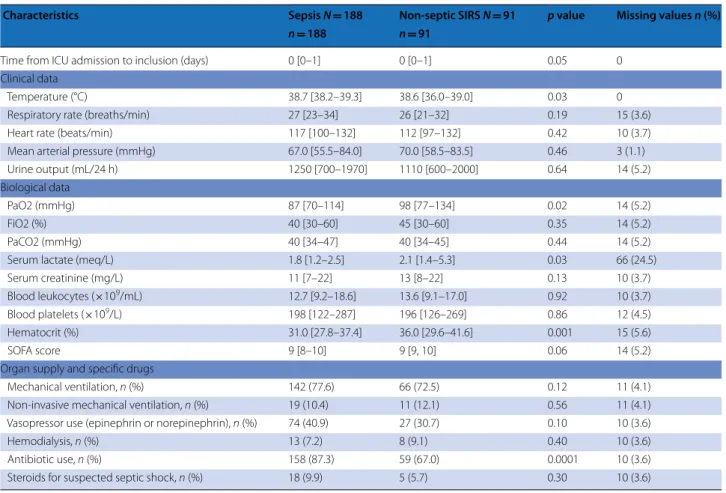
Inclusion occurred 0 [0–1] days after ICU admission. Forty-two patients (15%, 34 sepsis and 8 non-septic SIRS) were included after day 2 (one patient was included on day 248). Patients’ characteristics at ICU admission and at study inclusion are shown in Tables 1 and 2. The SAPS 2 score at ICU admission was 55 [50–61] in both groups. Temperature was higher and PaO2, serum lactate, and hematocrit were lower in sepsis than in non-septic SIRS patients. The causes of non-septic SIRS were mainly circulatory insufficiency or inflammatory states (ESM
Table 7), and the anatomic locations of infection in sepsis patients were mainly lung and abdomen (ESM Table 8). The causal pathogens of these infections are provided in ESM Table 9. A combination of pathogens was found in 46 (24%) and neither bacterium nor fungus was found in 27 (14%) patients with sepsis, among whom 24 had lung and three had abdominal infections. The mortality of the two groups at the end of the hospital stay was similar (63/188 [33%] versus 28/91 [31%], p = 0.54). The ICU stay after inclusion and the hospital stay after ICU discharge were longer in the sepsis than in the non-septic SIRS patients (9 [4–22] versus 4 [2–11] days, p < 0.001, and 24 [9–48] versus 13 [7–24] days, p < 0.001).
Biomarkers Univariate analyses
Missing data ranged from 11% to 16% for the 39 plasma and RNA biomarkers in 279 patients, and from 3% to 54% for the 14 cell surface biomarkers available in 110 patients (ESM Table 10). Most missing data were due to insufficient volume of the blood sample. Thirteen plasma and three RNA biomarkers were significantly different between sepsis and non-septic SIRS patients: CRP, suPAR, PSP, G-CSF, IL-6, IL-8, IP-10, MIP-1α, MIP-1β, MMP8, PCT, and S100A9 were higher, while MIF, RANTES, HLA DR mRNA, and CD74 mRNA were lower. Four cell surface biomarkers were significantly different between sepsis and non-septic SIRS patients: CD64-Neutrophil-MFI, and MFI intraTLR4 in CD56Dim were higher, while HLA-DR on CD14 high and low were lower (ESM Table 2).
Figure 2 describes the ROC-AUC of the 28 biomarkers treated as quantitative data and computed using each of the three imputation methods. The different imputation methods did not impact the results and only eight mark-ers had a ROC-AUC above 0.6 and a 95% confidence lower limit above 0.5. These were CRP (ROC-AUC = 0.73 [0.65–0.81]), HLA-DRA mRNA (0.65 [0.58–0.77]), pan-creatic stone protein (PSP) (0.63 [0.54–0.71]), CD74 mRNA (0.62 [0.53–0.72]), metalloproteinase 8 (MMP8) (0.62 [0.54–0.70]), suPAR (= 0.62 [0.53–0.71]), IL-6 (0.60 [0.51–0.68]), and S100A9 (0.62 [0.50–0.67]).
LASSO statistics
Among the 12,500 predictive models computed, opti-mism between train and test samples was close to 0 for a λ between 0.1 and 0.16 (ESM Fig. 4). ROC-AUCs decreased slightly when λ increased from 0.1 to 0.16 (ESM Fig. 5). We chose a λ = 0.1 because it allowed the best compromise between ROC-AUC and optimism. For λ = 0.1, CRP was selected in the LASSO logistic regres-sion model in 95–99% of the 500 samples and HLA-DRA mRNA was selected in 33–58% of the 500 samples,
depending on the imputation method. None of the other markers were selected in more than 30% of the samples (ESM Fig. 6). The mean train ROC-AUC of the model was 0.76 [0.68–0.84] while mean test ROC-AUC was 0.72 [0.57–0.83], whatever the imputation method. The ROC-AUCs of two previously published combinations [25, 26] are displayed in Table E6, and another one [10] could not be assessed because of an insufficient number of values for one of the parameters (PMN CD64 index).
Discussion
We assessed plasmatic and whole blood RNAs in a pro-spective multicenter cohort of 279 ICU patients with criteria of SIRS, and assessed cell surface biomarkers in 110 of these patients. Two-thirds of the patients were diagnosed as having sepsis and one-third as having non-septic SIRS, blindly to the results of the biomarkers. The ROC-AUC of PCT, which we had used as the reference value to calculate the sample size, was much lower in our series (median 0.55) than in Tang et al’s meta-analysis (mean 0.78) [16]. This discrepancy may be due to dif-ferences in gold- standard in the individual studies [27]
Patients screened (SIRS), n=363
Patients not included, n = 84
- absence of consent: n = 7 - inclusion criterion missing: n = 50
o absence of hypo- or hyperthermia: n= 34 o other: n = 16
- non-inclusion criterion present: o immunosuppression: n= 8 o legal protection: n = 8 o already on antibiotics: n = 8
o already included in the same study: n= 3
Patients included, n= 279
Sepsis, n = 188
Non-septic SIRS, n = 91
With cell surface biomarkers
n = 77
Without cell surface biomarkers
n = 58 Without cell surface
biomarkers n = 111
With cell surface biomarkers
n = 33
and to the populations studied. In fact, as procalcitonin is a marker of severity [28], high ROC-AUC may be due to lower severity [27] or mortality [27, 29] in non-septic SIRS patients from previous series, secondary to differences in inclusion criteria. We did not expect this result, which made our sample size estimate inadequate for this population. Therefore, we decided to stop inclu-sions as initially planned. The biomarker with the highest observed ROC-AUC to discriminate between sepsis and non-septic SIRS was CRP, and no combination of bio-markers was found to improve its diagnostic accuracy.
Sepsis is a life-threatening organ dysfunction caused by a dysregulated host response to infection [2]. In case of infection, early antibiotic therapy is associated with a reduction of mortality [4], while in the absence of infec-tion the search for an alternate diagnosis must be aggres-sive to initiate appropriate therapy [30, 31]. This justifies searching discriminatory biomarkers available in routine
use. Such biomarkers have been studied in prior stud-ies. As a gold standard definition of infection does not exist, the groups may be heterogeneous across studies. We chose to include patients with SIRS, for whom the attending clinician was suspecting infection and consid-ering antibiotic therapy. To initiate early therapy, such an a priori suspicion of sepsis was in accordance with the recommendations of the Surviving Sepsis Campaign [5]. While our study was not designed to evaluate com-pliance with these guidelines, differences in individual practices may have influenced the time of inclusion. We classified patients a posteriori using two blind adjudica-tors, and used conventional definitions [10, 30, 32]. Our series comprises 67% infected patients. Pneumonia was the predominant location of infection and the strains responsible for infections were predominantly Gram-negative bacteria, consistent with epidemiology in ICUs [33, 34]. Unlike prior series [10, 14], as measured with
Table 1 Characteristics of the patients at ICU admission
Sepsis N = 188 Non‑septic SIRS N = 91 p value Missing values n (%)
Age (years) 64.7 [52.5–77.7] 65.5 [51.0–78.8] 0.98 0
Male sex, n (%) 124 (66.0) 55 (60.4) 0.38 0
SAPS 2 score 55 [50–61] 55 [50–61] 0.81 0
Reason for admission to ICU, n (%) 0.31 0
Acute respiratory failure 67 (35.6) 30 (33.0)
Septic shock 25 (13.3) 0 (0.0) Hypovolemic shock 7 (3.7) 3 (3.3) Other shock 8 (4.3) 10 (10.1) Convulsive state 9 (4.8) 8 (8.8) Coma 23 (12.2) 16 (17.6) Surgical abdomen 7 (3.7) 2 (2.2) Other 42 (22.3) 22 (24.2) Location of origin, n (%) 0.43 0 Emergency department 67 (35.6) 29 (31.9) Direct admission 53 (28.2) 37 (70.7) Ward 47 (25.0) 18 (19.8) Operating room 12 (6.4) 4 (4.4) Other ICU 9 (4.8) 3 (3.3) Underlying disease, n (%) 2 (0.7)
Chronic obstructive pulmonary disease 38 (20.2) 12 (13.2) 0.25
Cardiac insufficiency 21 (11.2) 11 (12.1) 0.85
Diabetes 40 (21.3) 17 (18.7) 0.88
Chronic renal insufficiency 15 (8.0) 9 (9.9) 0.38
Cancer 29 (15.4) 8 (8.8) 0.15
Hematological malignancy 2 (1.0) 0 (0.0) 1.00
Chronic liver disease 14 (7.4) 6 (6.6) 0.38
McCabe score, n (%) 0.18 3 (1.1)
1—No fatal disease 143 (76.1) 75 (82.4)
2—Estimated vital prognosis less than 5 years 42 (22.3) 15 (16.5) 3—Estimated vital prognosis less than 1 year 1 (0.5) 0 (0.0)
SAPS 2 score, our two groups had similar severity. This may result from our using the time when the physician was about to initiate antibiotic therapy among the inclu-sion criteria. The ICU mortality of our patients was high (31% and 33%) and consistent with their SAPS 2 scores at ICU admission [19]. Similarly, the SOFA score, which has become part of the sepsis description [2], was high (9 [8–10)] and similar in our two groups, allowing us to discard severity as a confounding factor. We observed differences between the two groups: the high preva-lence of hypoxemia in our sepsis group may be due to the frequency of pneumonia [33]; higher serum lactate— a marker of cellular hypoxia—and lower hematocrit in non-septic SIRS patients may result from the frequency of circulatory dysfunction and is consistent with the role of tissue hypoxia, ischemia, and reperfusion in the patho-physiology of SIRS [35]. Lastly, sepsis patients had longer ICU and hospital stays than non-septic SIRS patients. This may reflect that source control [5] and resolution of infection are slower to achieve than resolution of events such as ischemia–reperfusion syndrome.
An important result of our study is that the circulat-ing biomarkers did not differ substantially whether the
stimulus for clinical inflammation was microbial or not. This may relate to the similarity of the mediator cascade and cell interaction profiles, whether the involved stimuli are pathogen-associated molecular patterns (PAMPs) or danger-associated molecular patterns (DAMPs) [36]. Considering the large amount of literature promoting the use of PCT to guide antibiotic prescription [15], our results were unexpected. This may have been due to the similar level of severity of our two groups and the strong link between PCT and mortality, as reported in a recent large international cohort [28]. The good performance of CRP relative to other markers is consistent with pre-vious studies [9, 11, 13] and with the fact that CRP use was found to successfully decrease the duration of anti-biotic therapy [12]. In two important studies, it was not assessed [10] or was used as part of the criteria of infection [14] precluding its assessment as a diagnostic marker. Also, the fact that we could not improve the diag-nostic accuracy of CRP with a combination of biomarkers is consistent with one prior study [11], while two stud-ies concluding differently either addressed distinction between bacterial and viral infections [13] or were not reproduced [25, 26] (ESM Table 11).
Table 2 Clinical and biological characteristics of the patients at study inclusion
Characteristics Sepsis N = 188 Non‑septic SIRS N = 91 p value Missing values n (%)
n = 188 n = 91
Time from ICU admission to inclusion (days) 0 [0–1] 0 [0–1] 0.05 0
Clinical data
Temperature (°C) 38.7 [38.2–39.3] 38.6 [36.0–39.0] 0.03 0
Respiratory rate (breaths/min) 27 [23–34] 26 [21–32] 0.19 15 (3.6)
Heart rate (beats/min) 117 [100–132] 112 [97–132] 0.42 10 (3.7)
Mean arterial pressure (mmHg) 67.0 [55.5–84.0] 70.0 [58.5–83.5] 0.46 3 (1.1)
Urine output (mL/24 h) 1250 [700–1970] 1110 [600–2000] 0.64 14 (5.2)
Biological data
PaO2 (mmHg) 87 [70–114] 98 [77–134] 0.02 14 (5.2)
FiO2 (%) 40 [30–60] 45 [30–60] 0.35 14 (5.2)
PaCO2 (mmHg) 40 [34–47] 40 [34–45] 0.44 14 (5.2)
Serum lactate (meq/L) 1.8 [1.2–2.5] 2.1 [1.4–5.3] 0.03 66 (24.5)
Serum creatinine (mg/L) 11 [7–22] 13 [8–22] 0.13 10 (3.7)
Blood leukocytes (×109/mL) 12.7 [9.2–18.6] 13.6 [9.1–17.0] 0.92 10 (3.7)
Blood platelets (×109/L) 198 [122–287] 196 [126–269] 0.86 12 (4.5)
Hematocrit (%) 31.0 [27.8–37.4] 36.0 [29.6–41.6] 0.001 15 (5.6)
SOFA score 9 [8–10] 9 [9, 10] 0.06 14 (5.2)
Organ supply and specific drugs
Mechanical ventilation, n (%) 142 (77.6) 66 (72.5) 0.12 11 (4.1)
Non‑invasive mechanical ventilation, n (%) 19 (10.4) 11 (12.1) 0.56 11 (4.1)
Vasopressor use (epinephrin or norepinephrin), n (%) 74 (40.9) 27 (30.7) 0.10 10 (3.6)
Hemodialysis, n (%) 13 (7.2) 8 (9.1) 0.40 10 (3.6)
Antibiotic use, n (%) 158 (87.3) 59 (67.0) 0.0001 10 (3.6)
Our study has several limitations. First, many eligi-ble patients may not have been included, particularly because inclusion outside working hours of the research laboratory was discouraged. This may reduce generali-zation of our results. Second, despite CRP and PCT not being provided to the adjudicators, the interpretations of the physicians in charge of some patients could be based in part on these results and were visible in the patients’ records and may have influenced the decisions of the adjudicators. Third, the dispersion of the ROC-AUC of most markers was large, secondary to the relatively small sample size. This sample size is, however, in the higher range of the studies which established the ROC-AUC of PCT [16] and served as a basis for our sample size calcu-lation. Fourth, we could assess cell surface biomarkers in only 40% of our patients, because the cells require imme-diate treatment in the research laboratory, i.e., during regular working hours. This was due to the fact we had planned to include patients independently of the hours of symptoms occurrence, to favor external validity. Also, we obtained a substantial amount of missing data for these cell surface biomarkers, mainly because of a short-age of blood sample volume. This reduces the validity of our findings regarding these biomarkers. For example, the positive results we observed in our first 28 patients [37] for CD24 on neutrophils were not confirmed in the
present whole cohort. Fifth, we had to adjust our initial statistical plan analysis, from a conventional approach with multivariate regression to the LASSO technique, after we observed the large number of missing values. Last, as the study was only conducted in ICUs in the Paris area, the external validity in other countries or smaller hospitals may be decreased.
Conclusion
In this prospective multicenter cohort, addressing most circulating biomarkers previously tested in the setting of sepsis, and using the LASSO biostatistical method, we found that these biomarkers poorly discriminated sepsis from non-septic SIRS patients and that no one biomarker, alone or in combination, performed better than CRP alone. Because cell surface biomarkers were collected in only 40% of the patients, the validity of our results is weaker for these biomarkers.
Electronic supplementary material
The online version of this article (https ://doi.org/10.1007/s0013 4‑018‑5228‑3) contains supplementary material, which is available to authorized users.
Author details
1 Unit Cytokines and Inflammation, Institut Pasteur, Paris, France. 2 Service de Médecine Intensive et Réanimation, Groupe Hospitalier Paris Saint‑Joseph, Paris, France. 3 Unité Endotoxines Structures et Réponse de L’hôte, Départe‑ ment de Microbiologie, Institut de Biologie Intégrative de La Cellule, Paris
Fig. 2 Univariate performance of the 28 quantitative markers, according to different imputation methods. X‑axis, name of each biomarker; Y‑axis,
ROC‑AUC values of each biomarker ranked between 0 and 1. Each bar corresponds to the 95% confidence interval of the ROC‑AUC. For each bio‑ marker, three bars are provided, corresponding to each of the first, second, and third imputation method for values below LLoQ, over ULoQ, and for missing values (ESM Table 6). *RNA
Saclay, Saclay, France. 4 Unité de Biostatistiques et d’Epidémiologie, Hôpital Hotel‑Dieu, Assistance Publique—Hôpitaux de Paris, Paris, France. 5 Univer‑ sité Paris Descartes, Paris Sorbonne Cité, Paris, France. 6 Medical Diagnostic Discovery Department, BioMérieux SA, Lyon, France. 7 Service de Réanimation, Hôpital André Mignot, Versailles, France. 8 Service de Réanimation Médicale, Hôpital Européen Georges Pompidou, Assistance Publique—Hôpitaux de Paris, Paris, France. 9 INSERM, UMR S1140, Université Paris Descartes, Paris Sorbonne Cité, Paris, France. 10 Service de Réanimation, Hôpital Antoine Béclère, Assistance Publique—Hôpitaux de Paris, Clamart, France. 11 Service de Réanimation, Hôpital Raymond Poincaré, Assistance Publique—Hôpitaux de Paris, Garches, France. 12 Université Versailles Saint‑Quentin, Versailles, France. 13 Service de Réanimation Chirurgicale, Hôpital Européen Georges Pompidou, Assistance Publique—Hôpitaux de Paris, Paris, France. 14 Unité de Recherche Clinique, Hôpital Cochin, Assistance Publique—Hôpitaux de Paris, Paris, France. 15 Intensive Care Unit, Service de Réanimation Médicale, Hôpital Charles Nicolle, Hôpitaux de Rouen, 1 rue de Germont, Rouen, France. 16 Groupe de Recherche sur l’Adaptation Microbienne, Université de Rouen Normandie, Rouen, EA 2656, France.
Acknowledgements
The authors thank URC‑CIC Paris Descartes Necker/Cochin (Laurence Lecomte‑Raclet and Elsa Bournaud) for implementation, monitoring, and data management of the study.
Members of the Combined Approach for The eArly diagnosis of INfection in sepsis (CAPTAIN) study group: Sébastien Jacqmin, Didier Journois, Alix Lagrange, Gabrielle de Pinot de Villechenon (Hôpital Européen Georges Pom‑ pidou, AP‑HP—Université Paris Descartes, Service d’Anesthésie‑Réanimation), Nadia Aissaoui, Jean‑Luc Diehl, Emmanuel Guerot, Marion Venot (Hôpital Euro‑ péen Georges Pompidou, AP‑HP—Université Paris Descartes, Service de Réani‑ mation Médicale), Olfa Hamzaoui, Dominique Prat, Benjamin Sztrymf (Hôpital Antoine Béclère, AP‑HP—Université Paris Sud, Clamart), Djillali Annane, Virginie Maxime, Andrea Polito (Hôpital Raymond Poincaré, AP‑HP—Université Paris Ile de France Ouest, Service de Réanimation Médico‑chirurgicale), Belaïd Bouhe‑ mad, Cédric Bruel, Frédéric Ethuin, Julien Fournier, Maïté Garrouste‑Orgeas, Charles Gregoire, Nicolas Lau, Benoît Misset, François Philippart (Groupe Hos‑ pitalier Paris Saint Joseph, Service de Réanimation), Jean‑Pierre Bedos, Pierrick Crosnier, Virginie Laurent, Sybille Merceron (Hôpital André Mignot, Versailles, Service de Réanimation médico‑chirurgicale), Elsa Bournaud, Laurence Le‑ comte, Jean‑Marc Treluyer, (Hôpital Cochin, AP‑HP—Université Paris Descartes, Unité de Recherche Clinique), Alexandre Pachot, Javier Yugueros‑Marcos, Laurent Esteve, Sophie Blein, Virginie Moucadel (bioMérieux, Lyon & Grenoble), Myriam Ben Boutieb, Alexandra Rouquette, Joël Coste (Hôpital Hotel‑Dieu, AP‑HP—Université Paris Descartes, Unité de Biostatistique et d’Epidémiologie), Minou Adib‑Conguy, Jean‑Marc Cavaillon, Catherine Fitting, Marianna Parlato, Virginie Puchois, Fernando Souza‑Fonseca‑Guimaraes (Institut Pasteur, Paris, Unit Cytokines & Inflammation).
Author contributions
AR, LE, SB, VM, JMC, and BM had full access to all the data in the study and take responsibility for the integrity of the data and the accuracy of the data analysis. Study concept and design: FP, AR, AP, JMC, and BM. Acquisition of data: MP, FP, CF, VP, VM, JPB, DJ, OH, DA, JLD, LL, JMT. Access to data, analysis, and interpretation: MP, FP, AR, LE, SB, VM, MBB, AP, MAC, JMC, and BM. Drafting of the manuscript: FP, MP, AR, SB, VM, JMC, and BM. Critical revision of the manuscript for important intellectual content: MP, FP, AR, SB, VM, DA, JMC, and BM. Statistical analysis: AR, MBB, LE, and SB. Obtained funding: AP, JMC, and BM. Administrative, technical, or material support: CF and JMT.
Funding
Grant from the Programme Hospitalier de Recherche Clinique of the French Ministry of Health (PHRC AOM 09143) and from the Institut Mérieux‑Institut Pasteur collaborative research partnership. The study was sponsored by the Département de la Recherche Clinique et du Développement de l’Assistance Publique‑Hôpitaux de Paris. This project was part of Advanced Diagnostics for New Therapeutic Approaches, a program dedicated to personalized medicine, coordinated by Mérieux Alliance and supported by the French public agency, OSEO.
Compliance with ethical standards Conflicts of interest
Moucadel, Estève, and Pachot are employed by bioMérieux SA, a private com‑ pany specializing in in vitro diagnostics. The authors declare no other potential conflicts of interest in relation to the subject of the present manuscript.
Received: 22 February 2018 Accepted: 11 May 2018 Published online: 30 June 2018
References
1. Levy MM, Fink MP, Marshall JC et al (2003) 2001 SCCM/ESICM/ACCP/ATS/ SIS international sepsis definitions conference. Crit Care Med 31:1250– 1256. https ://doi.org/10.1097/01.CCM.00000 50454 .01978 .3B
2. Singer M, Deutschman CS, Seymour CW et al (2016) The third interna‑ tional consensus definitions for sepsis and septic shock (Sepsis‑3). JAMA 315:801–810. https ://doi.org/10.1001/jama.2016.0287
3. Liu V, Escobar GJ, Greene JD et al (2014) Hospital deaths in patients with sepsis from 2 independent cohorts. JAMA 312:90–92. https ://doi. org/10.1001/jama.2014.5804
4. Kumar A, Ellis P, Arabi Y et al (2009) Initiation of inappropriate antimicro‑ bial therapy results in a fivefold reduction of survival in human septic shock. Chest 136:1237–1248. https ://doi.org/10.1378/chest .09‑0087
5. Rhodes A, Evans LE, Alhazzani W et al (2017) Surviving Sepsis Campaign: international guidelines for management of sepsis and septic shock: 2016. Intensive Care Med 43:304–377. https ://doi.org/10.1007/s0013 4‑017‑4683‑6
6. Seymour CW, Liu VX, Iwashyna TJ et al (2016) Assessment of clinical cri‑ teria for sepsis: for the third international consensus definitions for sepsis and septic shock (Sepsis‑3). JAMA 315:762–774. https ://doi.org/10.1001/ jama.2016.0288
7. Parlato M, Cavaillon J‑M (2015) Host response biomarkers in the diagnosis of sepsis: a general overview. Methods Mol Biol 1237:149–211. https :// doi.org/10.1007/978‑1‑4939‑1776‑1_15
8. Andriolo BN, Andriolo RB, Salomão R, Atallah ÁN (2017) Effectiveness and safety of procalcitonin evaluation for reducing mortality in adults with sepsis, severe sepsis or septic shock. Cochrane Datab Syst Rev 1:CD010959. https ://doi.org/10.1002/14651 858.cd010 959.pub2
9. Gros A, Roussel M, Sauvadet E et al (2012) The sensitivity of neutrophil CD64 expression as a biomarker of bacterial infection is low in critically ill patients. Intensive Care Med 38:445–452. https ://doi.org/10.1007/s0013 4‑012‑2483‑6
10. Gibot S, Béné MC, Noel R et al (2012) Combination biomarkers to diagnose sepsis in the critically ill patient. Am J Respir Crit Care Med 186:65–71. https ://doi.org/10.1164/rccm.20120 1‑0037O C
11. ten Oever J, Tromp M, Bleeker‑Rovers CP et al (2012) Combination of biomarkers for the discrimination between bacterial and viral lower respiratory tract infections. J Infect 65:490–495. https ://doi.org/10.1016/j. jinf.2012.08.004
12. Oliveira CF, Botoni FA, Oliveira CRA et al (2013) Procalcitonin versus C‑reactive protein for guiding antibiotic therapy in sepsis: a randomized trial. Crit Care Med 41:2336–2343. https ://doi.org/10.1097/CCM.0b013 e3182 8e969 f
13. Oved K, Cohen A, Boico O et al (2015) A novel host‑proteome signature for distinguishing between acute bacterial and viral infections. PLoS One 10:e0120012. https ://doi.org/10.1371/journ al.pone.01200 12
14. McHugh L, Seldon TA, Brandon RA et al (2015) A molecular host response assay to discriminate between sepsis and infection‑negative systemic inflammation in critically ill patients: discovery and validation in inde‑ pendent cohorts. PLoS Med 12:e1001916. https ://doi.org/10.1371/journ al.pmed.10019 16
15. Quenot J‑P, Luyt C‑E, Roche N et al (2013) Role of biomarkers in the management of antibiotic therapy: an expert panel review II: clinical use of biomarkers for initiation or discontinuation of antibiotic therapy. Ann Intensive Care 3:21. https ://doi.org/10.1186/2110‑5820‑3‑21
16. Tang BMP, Eslick GD, Craig JC, McLean AS (2007) Accuracy of procalci‑ tonin for sepsis diagnosis in critically ill patients: systematic review and meta‑analysis. Lancet Infect Dis 7:210–217. https ://doi.org/10.1016/S1473 ‑3099(07)70052 ‑X
17. von Elm E, Altman DG, Egger M et al (2007) The Strengthening the Reporting of Observational Studies in Epidemiology (STROBE) state‑ ment: guidelines for reporting observational studies. Ann Intern Med 147:573–577
18. Cohen J, Vincent J‑L, Adhikari NKJ et al (2015) Sepsis: a roadmap for future research. Lancet Infect Dis 15:581–614. https ://doi.org/10.1016/S1473 ‑3099(15)70112 ‑X
19. Le Gall JR, Lemeshow S, Saulnier F (1993) A new simplified acute physiol‑ ogy score (SAPS II) based on a European/North American multicenter study. JAMA 270:2957–2963
20. Vincent JL, de Mendonça A, Cantraine F et al (1998) Use of the SOFA score to assess the incidence of organ dysfunction/failure in intensive care units: results of a multicenter, prospective study. Working group on “sepsis‑related problems” of the European Society of Intensive Care Medicine. Crit Care Med 26:1793–1800
21. Hanley JA, McNeil BJ (1983) A method of comparing the areas under receiver operating characteristic curves derived from the same cases. Radiology 148:839–843. https ://doi.org/10.1148/radio logy.148.3.68787 08
22. Tibshirani R (1996) Regression shrinkage and selection via the lasso. J R Stat Soc Ser B Methodol 58:267–288
23. Rubin DB (2004) Multiple imputation for nonresponse in surveys. Wiley, Chichester
24. Musoro JZ, Zwinderman AH, Puhan MA et al (2014) Validation of predic‑ tion models based on lasso regression with multiply imputed data. BMC Med Res Methodol 14:116. https ://doi.org/10.1186/1471‑2288‑14‑116
25. Messer J, Eyer D, Donato L et al (1996) Evaluation of interleukin‑6 and soluble receptors of tumor necrosis factor for early diagnosis of neonatal infection. J Pediatr 129:574–580
26. Kofoed K, Andersen O, Kronborg G et al (2007) Use of plasma C‑reactive protein, procalcitonin, neutrophils, macrophage migration inhibitory factor, soluble urokinase‑type plasminogen activator receptor, and soluble triggering receptor expressed on myeloid cells‑1 in combination to diagnose infections: a prospective study. Crit Care 11:R38. https ://doi. org/10.1186/cc572 3
27. Harbarth S, Holeckova K, Froidevaux C et al (2001) Diagnostic value of procalcitonin, interleukin‑6, and interleukin‑8 in critically ill patients admitted with suspected sepsis. Am J Respir Crit Care Med 164:396–402.
https ://doi.org/10.1164/ajrcc m.164.3.20090 52
28. Sager R, Wirz Y, Amin D et al (2017) Are admission procalcitonin levels universal mortality predictors across different medical emergency patient
populations? Results from the multi‑national, prospective, observa‑ tional TRIAGE study. Clin Chem Lab Med 55:1873–1880. https ://doi. org/10.1515/cclm‑2017‑0144
29. Ruokonen E, Ilkka L, Niskanen M, Takala J (2002) Procalcitonin and neop‑ terin as indicators of infection in critically ill patients. Acta Anaesthesiol Scand 46:398–404
30. Heffner AC, Horton JM, Marchick MR, Jones AE (2010) Etiology of illness in patients with severe sepsis admitted to the hospital from the emergency department. Clin Infect Dis 50:814–820. https ://doi.org/10.1086/65058 0
31. Hranjec T, Rosenberger LH, Swenson B et al (2012) Aggressive versus conservative initiation of antimicrobial treatment in critically ill surgical patients with suspected intensive‑care‑unit‑acquired infection: a quasi‑ experimental, before and after observational cohort study. Lancet Infect Dis 12:774–780. https ://doi.org/10.1016/S1473 ‑3099(12)70151 ‑2
32. Contou D, Roux D, Jochmans S et al (2016) Septic shock with no diagno‑ sis at 24 h: a pragmatic multicenter prospective cohort study. Crit Care 20:360. https ://doi.org/10.1186/s1305 4‑016‑1537‑5
33. Alberti C, Brun‑Buisson C, Burchardi H et al (2002) Epidemiology of sepsis and infection in ICU patients from an international multicentre cohort study. Intensive Care Med 28:108–121. https ://doi.org/10.1007/s0013 4‑001‑1143‑z
34. Tabah A, Koulenti D, Laupland K et al (2012) Characteristics and deter‑ minants of outcome of hospital‑acquired bloodstream infections in intensive care units: the EUROBACT International Cohort Study. Intensive Care Med 38:1930–1945. https ://doi.org/10.1007/s0013 4‑012‑2695‑9
35. Timmermans K, Kox M, Vaneker M et al (2016) Plasma levels of danger‑ associated molecular patterns are associated with immune suppres‑ sion in trauma patients. Intensive Care Med 42:551–561. https ://doi. org/10.1007/s0013 4‑015‑4205‑3
36. Horvath GL, Schrum JE, De Nardo CM, Latz E (2011) Intracellular sensing of microbes and danger signals by the inflammasomes. Immunol Rev 243:119–135. https ://doi.org/10.1111/j.1600‑065X.2011.01050 .x
37. Parlato M, Souza‑Fonseca‑Guimaraes F, Philippart F et al (2014) CD24‑ triggered caspase‑dependent apoptosis via mitochondrial membrane depolarization and reactive oxygen species production of human neutrophils is impaired in sepsis. J Immunol 1950 192:2449–2459. https :// doi.org/10.4049/jimmu nol.13010 55