Sleep Stabilizes Visuomotor Adaptation Memory: a functional
Magnetic Resonance Imaging Study
G E N E V I E V E A L B O U Y
1 , 2* , G I L L E S V A N D E W A L L E
1, V I R G I N I E S T E R P E N I C H
1,
G E R A L D I N E R A U C H S
1, M A R T I N D E S S E I L L E S
1,
E V E L Y N E B A L T E A U
1, C H R I S T I A N D E G U E L D R E
1, C H R I S T O P H E P H I L L I P S
1,
A N D R E L U X E N
1and P I E R R E M A Q U E T
11Cyclotron Research Centre, University of Liège, Liège, Belgium,2University of Lyon, Lyon, France
Keywords
consolidation, functional magnetic resonance imaging, sleep, visuomotor adaptation Correspondence
Pierre Maquet, Cyclotron Research Centre, University of Liège, B30, Sart Tilman, B-4000 Liège, Belgium.
Tel: +32-4-3662687; fax: +32-4-3662946; e-mail: [email protected]
*Present address: Functional Neuroimaging Unit, Centre de recherche, Institut universitaire de gériatrie de Montréal (CRIUGM), University of Montreal, Montreal, QC, Canada
Accepted in revised form 27 August 2012; received 27 April 2012
DOI: 10.1111/j.1365-2869.2012.01059.x
SUMMARY
The beneficial effect of sleep on motor memory consolidation is well known for motor sequence memory, but remains unsettled for visuomotor adaptation in humans. The aim of this study was to characterize more clearly the influence of sleep on consolidation of visuomotor adaptation using a between-subjects functional magnetic resonance imaging (fMRI) design contrasting sleep to total sleep deprivation. Our behavioural results, based on seven different parameters, show that sleep stabilizes performance whereas sleep deprivation deteriorates it. During training, while a set of cerebellar, striatal and cortical areas is activated in proportion to performance improvement, the recruitment of the hippocampus and frontal cortex protects motor memory against the detrimental effects of sleep deprivation. During retest after sleep loss a cerebello–cortical network, usually involved in the earliest stage of learning, was recruited to perform the task. In contrast, no changes in cerebral activity were observed after sleep, suggesting that it may only support the stabilization of the visuomotor adaptation memory trace.
I N T R O D U C T I O N
Humans use a wide variety of motor skills which they have to acquire through practice. Motor learning has been studied using two main paradigms exploring the acquisition of well-mastered sequences of movements (motor sequence learning) and the ability to execute a movement while compensating for external changes (motor adaptation) (Doyon et al., 2003). The neural correlates of motor sequence memory and visuomotor adaptation memory con-solidation have been described to rely on striato–cortical and cerebello–cortical networks, respectively (Doyon and Benali, 2005; Doyon et al., 2003).
Some evidence suggests that, during motor sequence learning, sleep favours the occurrence of offline gains in performance, i.e. behavioural improvements occurring between training sessions without any interleaved practice (Albouy et al., 2008; Doyon et al., 2009; Fischer et al., 2005; Korman et al., 2003; Walker, 2005). By contrast, the influ-ence of sleep on visuomotor adaptation has been character-ized less frequently and remains controversial. Sleep effects
were reported either in terms of offline performance gains (Doyon et al., 2009; Hill et al., 2008; Huber et al., 2004) or savings in performance (Debas et al., 2010; Huang et al., 2011; Krakauer, 2009; Krakauer et al., 2005). The latter consists in the change in learning rate or average perfor-mance between the first trials of delayed testing relative to initial training. Offline performance gains were not observed systematically after sleep (but see Doyon et al., 2009; Huber et al., 2004), whereas performance savings were reported consistently at delayed retests (Brashers-Krug et al., 1996; Debas et al., 2010; Donchin et al., 2002; Krakauer et al., 2005; Shadmehr and Brashers-Krug, 1997) but seem to be independent of sleep (Debas et al., 2010; Donchin et al., 2002).
The aim of the present study was to determine whether sleep influences the consolidation of visuomotor adaptation skills, using functional magnetic resonance imaging (fMRI) and contrasting sleep-deprived individuals with volunteers who slept after training. We assessed comprehensively both offline changes and savings in performance using a panel of seven behavioural parameters.
M A T E R I A L S A N D M E T H O D S Ethics statement
All the participants gave their written informed consent to take part to the study, which was approved by the Ethics Committee of the Faculty of Medicine of the University of Liège.
Participants and experimental design
Thirty-three young (mean age: 24 ± 3 years, 16 females), right-handed (Oldfield, 1971), healthy volunteers were recruited by advertisement. They had no history of medical, neurological or psychiatric disease and none of them was on medication. The quality of subjects’ sleep was normal as assessed by the Pittsburgh Sleep Quality Index question-naire (PSQI) (Buysse et al., 1989). All the subjects followed a 3-day constant sleep schedule before thefirst visit and kept to the same schedule for three more days, until their second visit. Compliance to the schedule was assessed using both sleep diaries and wrist actigraphy (Cambridge Neuroscience, Cambridge, UK).
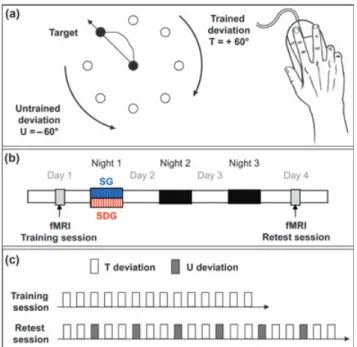
Subjects were scanned during two separate sessions, referred to as the training and retest sessions (Fig. 1b), while they performed a motor adaptation task (Fig. 1a) coded in Cogent2000 (http://www.vislab.ucl.ac.uk/cogent.php) imple-mented inMATLAB(Mathworks Inc., Sherbom, MA, USA). The
task required subjects to reach for visual targets using a mouse with their (right) dominant hand while adapting to
systematic rotation imposed on the perceived dot trajectory (Fig. 1a). Participants had to move a dot, displayed on the screen, corresponding to the position of the mouse, starting from the centre of the screen to a target position that would appear randomly at 10 cm in one of eight radial directions (0, 45, 90, 135, 180, 225, 270, 315°). All eight potential target positions were displayed constantly on the screen. A trial began when one of the targets was highlighted randomly. The participants had the instruction to reach the target as fast as possible using the shortest possible trajectory. In this rotation adaptation task, the dot position displayed on the screen was rotated clockwise [trained deviation (T), +60°] or anticlockwise [untrained deviation (U), 60°] relative to the mouse position. When the target was reached, the dot automatically returned to the starting central position, where the subjects had to wait 500 ms before the next target appeared.
The task was performed in 14 successive practice blocks of the trained deviation separated by 15-s rest periods (Fig. 1c). Each target had to be reached twice during each practice block (16 reaching movements per block). After training, subjects were assigned randomly to one of two groups according to whether they would be allowed to sleep [sleep group (SG)] or be totally sleep deprived [sleep-deprived group (SDG)] during the first post-training night (Fig. 1b). In the SG, subjects went home after the training session and slept regularly, as imposed by their constant sleep schedule, during the three post-training nights. In the SDG, subjects stayed awake in the laboratory during thefirst post-training night (from 23:00–07:00 h), under the constant supervision of experimenters. During the following day, subjects were instructed not to sleep and to continue their usual activities. They slept at home during the two remaining nights.
The retest session took place 72 h after training for subjects of both groups (SG and SDG), allowing two recovery nights for the SDG (Fig. 1b). Training and retest sessions were conducted from 08:00 to 19:00 h across participants and were performed at the same time of day for each subject in order to account for possible circadian fluctuations in performance within subjects. The retest session consisted of 20 blocks, with 14 blocks of trained and six blocks of untrained deviations (Fig. 1c).
Motor skill performance was measured with several parameters usually explored in the motor adaptation litera-ture. We first computed measures of speed with (i) block duration, representing the speed to perform the task by block, (ii) mean date of the peak velocity by block and (iii) mean time to reach the target by block. We also computed measures of accuracy with (i) mean trajectory length by block, (ii) mean area enclosed by the mouse trajectory relative to the theoretical trajectory (straight line), (iii) mean distance to the target at t = 650 ms and (iv) mean directional error at peak velocity, representing the angle between the position of the dot at peak velocity and the target to reach.
Figure 1. Experimental protocol. SG: sleep group; SDG: sleep-deprived group; U: untrained deviation; T: trained deviation. (a) Adaptation task; (b) experimental protocol; (c) experimental functional magnetic resonance imaging (fMRI) design.
As usually conducted in motor sequence learning experiments, offline changes in performance were calcu-lated as the difference between the average performance of the two last blocks of training versus the average of the twofirst blocks of retest. In order to fit the literature on the motor adaptation task, savings in performance were com-puted as the difference between the average performance of the twofirst blocks of training versus the two first blocks of retest.
fMRI data acquisition and analysis
Multi-slice T2*-weighted fMRI images were obtained with a gradient echo-planar sequence using axial slice orientation (TR = 2130 ms, TE = 40 ms, FA = 90°, 32 transverse slices, 3 mm slice thickness, 30% interslice gap, FoV = 2209 220 mm², matrix size = 64 9 64 9 32, voxel size = 3.49 3.4 9 3.0 mm³). A structural T1-weighted 3D MP-RAGE sequence (TR = 1960 ms, TE = 4.43 ms, TI = 1100 ms, FA = 8°, 176 slices, FoV = 2309 173 mm², matrix size = 2569 192 9 176, voxel size = 0.9 9 0.9 9 0.9 mm³) was also acquired in all subjects. The analyses were performed in SPM2 (http://www.fil.ion.ucl.ac.uk/spm/software/
spm2/; Wellcome Department of Imaging Neuroscience, London, UK). Pre-processing included the realignment of functional time–series, the coregistration of functional and anatomical data, a spatial normalization to an EPI template conforming to the Montreal Neurological Institute space, and a spatial smoothing [Gaussian kernel, 8 mm full-width at half-maximum (FWHM)]. The analysis of fMRI data, based on a mixed-effects model, was conducted in two serial steps accounting, respectively, for fixed and random effects. For each subject, changes in brain regional responses were estimated by a general linear model, including the responses to the trained and untrained deviations and their linear modulations by mean performance (mean time to reach the target in ms). These regressors consisted of box cars convolved with the canonical haemodynamic response func-tion. Movement parameters derived from realignment of the functional volumes were also included as covariates of no interest. High-pass filtering was implemented in the design matrix using a cut-off period of 128 s to remove slow drifts from the time–series. Serial correlations in fMRI signal were estimated using an autoregressive (order 1) plus white noise model and a restricted maximum likelihood (ReML) algorithm. The linear contrasts generated statistical parametric maps [SPM(T)]. These summary statistics images were then further spatially smoothed (Gaussian kernel 6 mm FWHM) and entered into a second-level analysis, corresponding to a random-effects model, accounting for intersubject variance that consisted mainly of one- or two-sample t-tests. The resulting set of voxel values for each contrast constituted a map of the t-statistic [SPM(T)], thresholded at P < 0.001 (uncorrected for multiple compar-isons). Statistical inferences were performed at a threshold of P < 0.05 after correction for multiple comparisons over
either the entire brain volume or over small spherical volumes (10-mm radius) located in structures of interest, as reported in the literature.
R E S U L T S
Population and demographic data
One subject in the SDG was excluded from the analyses because of large movements during fMRI data acquisition and another was excluded because he did not respect a regular sleep schedule after the deprivation night. Thirty-one subjects were included eventually in the analyses, 16 in the SG (mean age = 23 ± 2.7 years, 11 females) and 15 in the SDG (mean age = 25.3 ± 3.5 years, three females, unpaired t-test on age, t29= 1.96, P = 0.058).
The groups did not differ either by the mean sleep duration (SG, 8 h 10 ± 57 min; SDG, 7 h 42 ± 1 h 05 min; unpaired t-test, t27= 1.24, P = 0.22) or by the median PSQI score (SG, 3; SDG, 3; unpaired t-test, t27= 0.19, P = 0.84) during the month preceding the recordings. Subjective sleep duration and quality did not differ between groups either during the night preceding the training session (duration: SG, 8 h 09 min ± 49 min; SDG, 7 h 51 min ± 48 min; unpaired t-test t29= 0.99, P = 0.32; quality: SG, 4; SDG, 4; unpaired t-test t29 = 0.24, P = 0.80) or during the night preceding the retest session (duration: SG, 7 h 52 min ± 1 h 20 min; SDG, 8 h 04 min ± 1 h; unpaired t-test t28= 0.44, P = 0.65; quality: SG, 4; SDG, 4; unpaired t-test t28= 0.81, P = 0.42).
Actigraphic data on the six nights showed significant main effects of group (F1,28 = 27.27, P < 0.001) and night (F5,140= 69.07, P < 0.001), as well as a group9 night interaction (F5,140= 74.96, P < 0.001). The activity during the three first nights did not differ between groups (all Ps > 0.2). As expected, the activity was larger in the SDG
than in the SG during the deprivation night
(SG = 29.73 ± 13.87 units, SDG = 285.00 ± 110.35 units, F1,28 = 84.51, P < 0.001). During the first recovery night, activity in the SDG tended to be lower than in the SG, suggesting a rebound of sleep after sleep deprivation (SG = 33.49 ± 24.19 units, SDG = 19.70 ± 12.29 units, F1,28 = 3.69, P = 0.06). This effect was no longer present on the second recovery night, which preceded the retest session (SG = 36.50 ± 24.51 units, SDG = 34.45 ± 18.70 units, F1,28= 0.06, P = 0.8), suggesting that two nights were sufficient to recover from the effects of sleep deprivation.
Actigraphic data during daytime showed no significant main effects of group (F1,28 = 1.59, P = 0.21) and day (F4,112= 0.45, P = 0.77), as well as no group9 day inter-action (F4,112= 1.46, P = 0.21). The activity during the day following the sleep deprivation did not differ between groups (SG = 380.75 ± 106.56 units, SDG = 369.39 ± 160.99 units, F1,28= 0.05, P = 0.81), suggesting that sleep-deprived subjects maintained the same activity as sleepers the day after sleep deprivation.
Behavioural results
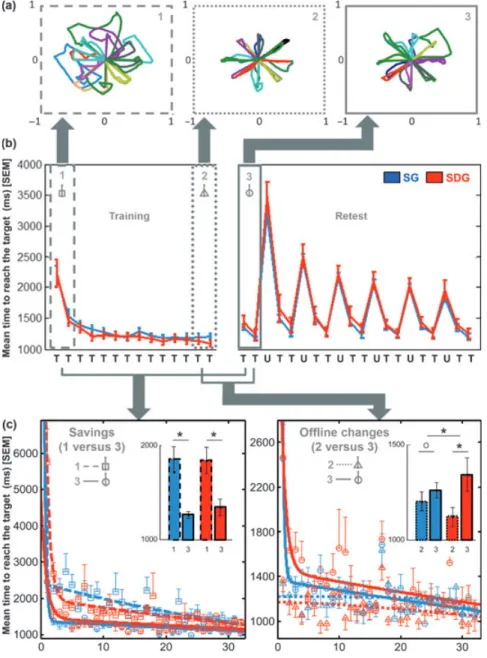
Behavioral results are presented in Figure 2 where raw performance (Fig. 2a), mean time to reach the target (Fig. 2b), offline gains and savings in performance (Fig. 2c) are illustrated.
Training session
For the training session, repeated-measures analyses of variance (ANOVAs) on performance (each of the parameters
described in the methods) with block repetition of the trained deviation and group as factors showed a main effect of repetition for all the parameters. In contrast, there was no significant group effect or repetition 9 group interaction for any of the parameters, indicating that performance improved similarly with practice in both groups (Table 1a, Fig. 2b, left panel, training).
Retest session
A repeated-measures ANOVA on performance of the retest
session (for all the parameters) with block repetition and condition (trained versus untrained) as within-subject factors and group as between-subjects factor was performed. For each parameter, the ANOVA showed a significant effect of
condition (all F1,29> 64.47, all Ps < 0.001), performance being faster on the trained than on the untrained deviation, but no significant group (all F1,29< 1.02, all Ps > 0.32) or group9 condition interaction (all F1,29 < 3.83, all Ps > 0.05), suggesting that the learning effect tested at retest was not modulated by the sleep condition of the first post-training night (Fig. 2b, right panel, retest).
Further analyses were performed to explore the possible interference effect of the untrained deviation on performance of the trained deviation during retest. Planned comparisons showed that, for each parameter, performance on the trained
Figure 2. Behavioural results. Whiskers represent standard error of the mean (SEM). SG: sleep group; SDG: sleep-deprived group; U: untrained deviation; T: trained deviation. (a) Raw performance on the adaptation task (display of the dot trajectory) during thefirst block of training (1), the last block of training (2) and thefirst block of retest (3) for one representative subject of the SG (arbitrary units). (b) Performance [mean time to reach the target (ms)] during training (left panel) and retest (right panel) for both the trained and untrained deviations. (c) Trial by trial performance [mean time to reach the target (ms)] on the twofirst blocks of training (1, dashed line) versus the two first blocks of retest (3, full line) illustrating savings in performance (left panel); and on the two last blocks of training (2, dotted line) versus the twofirst blocks of retest (3, full line) illustrating offline changes in performance (right panel). Circles, squares and triangles points, representing the group average with SEM for each trial, arefitted by a double-exponential function (Krakauer et al., 2005). For savings and offline changes, the insets represent average performance within the two blocks encircled in each group. (*) P < 0.05, (o) P > 0.05.
Table 1 Behavioural results. In the planned comparison analyses, mean ± SD of the mean offline gains and savings in performance are presented for each parameter in each group
(a)ANOVAtesting the repetition9 group effect during training
Performance Repetition Group Interaction
Block duration F13,377= 47.69,P < 0.001 F1,29= 0.26, P = 0.61 F = 0.32, P = 0.98
Time at peak velocity F13,377= 39.21,P < 0.001 F1,29= 0.002, P = 0.96 F = 1.61, P = 0.07
Time to reach the target F13,377= 47.38,P < 0.001 F1,29= 0.85, P = 0.36 F = 0.20, P = 0.99
Trajectory length F13,364= 25.28,P < 0.001 F1,28= 0.02, P = 0.78 F = 0.12, P = 0.99
Area F13,377= 29.84,P < 0.001 F1,29= 0.54, P = 0.46 F = 0.28, P = 0.99
Distance at 650 ms F13,377= 48.10,P < 0.001 F1,29= 0.29, P = 0.59 F = 1.33, P = 0.18
Directional error F13,377= 23.82,P < 0.001 F1,29= 0.93, P = 0.34 F = 0.92, P = 0.52
(b)ANOVAtesting the session (offline changes) 9 group effect
Performance Session Group Interaction
Block duration F1,29= 12.77,P = 0.001 F1,29< 0.01, P = 0.99 F = 4.34, P = 0.04
Date of peak velocity F1,29= 15.04,P < 0.001 F1,29= 0.02, P = 0.88 F = 6.69, P = 0.01
Time to reach the target F1,29= 11.91,P = 0.001 F1,29= 0.10, P = 0.74 F = 4.61, P = 0.04
Trajectory length F1,28= 11.50,P = 0.002 F1,28= 1.24, P = 0.27 F = 3.21, P = 0.08
Area F1,29= 13.53,P < 0.001 F1,29< 0.01, P = 0.92 F = 3.15, P = 0.08
Distance at 650 ms F1,29= 20.81,P < 0.001 F1,29= 0.40, P = 0.53 F = 7.20, P = 0.01
Directional error F1,29= 7.31,P = 0.01 F1,29= 2.60, P = 0.11 F = 0.76, P = 0.38
(c) Planned comparison on between-session effect (offline changes) within groups
Performance SG SDG
Block duration ( ) 932.09 ± 625 ms, P = 0.29 ( ) 3540.32 ± 1107 ms,P < 0.001
Date of peak velocity ( ) 26.43 ± 20 ms, P = 0.36 ( ) 132.36 ± 35 ms,P < 0.001
Time to reach the target ( ) 58.29 ± 39 ms, P = 0.37 ( ) 221.25 ± 69 ms,P < 0.001
Trajectory length ( ) 1.49 ± 0.38 cm, P = 0.26 ( ) 4.86 ± 1.83 cm,P = 0.001
Area ( ) 36.43 ± 17 cm, P = 0.18 ( ) 104.57 ± 34 cm,P < 0.001
Distance at 650 ms ( ) 0.28 ± 0.18 cm, P = 0.20 ( ) 1.20 ± 0.24 cm,P < 0.001
Directional error ( ) 2.05 ± 1.48°, P = 0.19 ( ) 4.01 ± 1.68°,P = 0.01
(d)ANOVAtesting the session (savings)9 group effects
Performance Session Group Interaction
Block duration F1,29= 41.68,P < 0.001 F1,29= 0.07, P = 0.79 F = 0.30, P = 0.58
Date of peak velocity F1,29= 55.94,P < 0.001 F1,29= 0.89, P = 0.35 F = 0.20, P = 0.65
Time to reach the target F1,29= 42.87,P < 0.001 F1,29< 0.01, P = 0.92 F = 0.72, P = 0.40
Trajectory length F1,28= 14.62,P < 0.001 F1,28= 0.67, P = 0.41 F = 0.75, P = 0.39
Area F1,29= 24.70,P < 0.001 F1,29< 0.01, P = 0.99 F = 0.44, P = 0.51
Distance at 650 ms F1,29= 96.52,P < 0.001 F1,29< 0.01, P = 0.99 F = 0.55, P = 0.46
Directional error F1,29= 63.97,P < 0.001 F1,29< 0.01, P = 0.98 F = 9.00, P = 0.005
(e) Planned comparison on between-session effect (savings) within groups
Performance SG SDG
Block duration (+) 9.52 ± 1.92 ms,P < 0.001 (+) 8.02 ± 1.91 ms,P < 0.001
Date of peak velocity (+) 200.45 ± 44 ms,P < 0.001 (+) 226.49 ± 35 ms,P < 0.001 Time to reach the target (+) 594.62 ± 120 ms,P < 0.001 (+) 501.41 ± 119 ms,P < 0.001
Trajectory length (+) 6.99 ± 1.75 cm,P = 0.002 (+) 4.40 ± 1.36 cm,P = 0.04
Area (+) 312.71 ± 73 cm,P < 0.001 (+) 239.04 ± 84 cm,P = 0.005
Distance at 650 ms (+) 2.25 ± 1.90 cm,P < 0.001 (+) 1.90 ± 0.22 cm,P < 0.001
Directional error (+) 12.11 ± 1.83°,P < 0.001 (+) 5.50 ± 1.16°,P = 0.001
ANOVA: analysis of variance; SG: sleep group; SDG: sleep-deprived group. (+) Represents an improvement in performance and ( ) represents a deterioration in performance between sessions. Results presented in bold are significant (P < 0.05).
deviations were faster on blocks preceding (blocks 2, 5, 8, 11, 14, 17) compared to blocks following (blocks 4, 7, 10, 13, 16, 19), blocks of untrained deviation (all F1,29 > 32.40, all Ps < 0.001) and that this effect did not differ between groups (all F1,29 < 1.09, all Ps > 0.30). Taken together, these results suggest that practice on the untrained deviation interfered with performance on the following blocks of trained deviation during retest, but that these effects did not depend on the sleep condition during the first post-training night. Impor-tantly, these interfering effects did not influence the compu-tation of offline changes and savings in performance that were both performed on blocks of trained deviation occurring before any exposition to the untrained deviation (blocks 1 and 2 of the retest session).
Offline changes in performance
Between-session changes in performance, i.e. the offline changes in performance between the end of training and the beginning of retest, were tested with an ANOVA on blocks
(average performance of the two last blocks of training versus average of the twofirst blocks of retest) and group as factors. For all the parameters, theANOVArevealed a significant main
effect of session but no significant group effect. The group9 session interaction was significant for four of seven parameters, whereas it showed a tendency towards signifi-cance for only two other parameters (trajectory length and area) and did not reach significance for one parameter (directional error, Table 1b). Planned comparison showed a stabilization of performance for all the parameters in the SG (but no significant offline improvement). In contrast, a significant between-session deterioration of performance was observed in the SDG (Table 1c, Fig. 2c, right panel) for all parameters.
Savings in performance
Savings in performance were tested with anANOVAon blocks
(average performance of the two first blocks of training versus average of the twofirst blocks of retest) and group as factors. For all parameters, the analysis revealed a significant main effect of session but no group effect. The group9 ses-sion interaction was not significant for all parameters except for directional error, for which savings differed between groups (Table 1d). Planned comparisons showed significant savings for all parameters in both groups (except for trajectory length that showed a tendency towards significant increase only in the SDG, Table 1e). These results indicate that significant savings appear irrespective of the sleep condition of the first post-training night, for all parameters (Fig. 2c, left panel), but preferentially after sleep for direc-tional error only.
Brain imaging results
The main effect of practice of the learned deviation during training and retest sessions recruited a large cerebello–
cortical network (Table 2a). For the training session, a contrast tested the main effect of practice of the trained deviation on subjects of both groups and its linear modulation by the changes in mean performance (mean time to reach the target). This analysis revealed that responses increased linearly with performance improvement over the training session bilaterally in the occipital cortex, ventral and dorsal putamen, motor cortex, intraparietal sulcus, in the right cerebellum, the right hippocampus and the left medial prefrontal cortex (Table 2b, Fig. 3a). In contrast, no brain responses were observed to decrease as mean performance improved over the training session.
A regression analysis assessed the relationship between brain areas recruited during training and subsequent changes in performance on the trained deviation observed between sessions in both groups. This analysis revealed that activity in the hippocampus, cerebellum and superior frontal cortex observed during initial training is correlated with subsequent offline changes in performance in the SDG, and more so than in the SG (Table 2c, Fig. 3b; note that the regression is still significant when excluding the outlier). This result suggests that the more the subjects activated this set of brain areas during training, the less was the detrimental effect shown by sleep deprivation on performance. After sleep, this relation no longer predicts subsequent changes in performance.
As sleep was not observed to influence performance savings, a regression analysis assessed the relationship between brain areas recruited during training and the subsequent savings in performance on the trained deviation overall subjects, irrespective of the sleep condition. This analysis revealed that a set of cortical areas including parietal and motor regions, as well as the cerebellar hemispheres (Table 2d), was activated during training in proportion to the subsequent savings in performance irrespective of the sleep condition.
During the retest session, the linear contrasts testing for the main effect of learning (trained–untrained) did not show any significant difference in learning-related brain activity between groups.
Finally, a linear contrast tested the main effect of session on the practice of the trained deviation (retest–training). This analysis did not reveal any change in brain responses between training and retest sessions in the SG compared to the SDG, suggesting stabilization of the cerebral network used during training to perform the task during retest. In contrast, in the SDG compared to the SG, responses increased at retest compared to training in a cerebello– cortical network, including the left cerebellar hemisphere, the right intraparietal sulcus, the right sensorimotor cortex and the right anterior cingulate cortex (Table 2e, Fig. 3c).
D I S C U S S I O N
The presentfindings indicate that the influence of sleep on visuomotor adaptation skills depends on the metrics used to assess performance and behavioural consolidation. Based
Table 2 Brain imaging results
Area x mm y mm z mm Z Psvc
(a) Main effect of practice of the trained deviation during both training and retest sessions
Right cerebellar hemisphere 26 46 28 Inf 0.000*
6 66 14 Inf 0.000*
Left cerebellar hemisphere 38 82 18 Inf 0.000*
Right occipital cortex 46 70 4 Inf 0.000*
Left occiptal cortex 44 72 2 Inf 0.000*
Left motor cortex 35 20 56 Inf 0.000*
Right intraparietal sulcus 32 48 56 Inf 0.000*
Left intraparietal sulcus 25 48 54 Inf 0.000*
Cingulate motor area 2 4 58 Inf 0.000*
(b) Cerebral areas where responses increase with improvement of performance on the trained deviation during training
Right occipital cortex 18 86 4 4.96 0.016*
Left occipital cortex 8 90 0 4.93 0.017*
Right ventral putamen 14 8 8 4.20 0.001
Left ventral putamen 20 14 4 3.98 0.003
Right dorsal putamen 24 10 18 3.94 0.003
Left dorsal putamen 22 2 16 3.27 0.025
Right sensorimotor cortex 32 8 46 3.47 0.014
Left sensorimotor cortex 26 28 54 3.27 0.025
Right intraparietal sulcus 14 58 60 3.11 0.038
Left intraparietal sulcus 24 54 62 3.34 0.021
Right anterior hippocampus 34 14 24 3.64 0.008
Left medial prefrontal cortex 12 62 0 3.20 0.030
Left cerebellar lobule IX 12 46 46 3.26 0.026
(c) Regression analysis between cerebral activity during practice of the trained deviation during training and the subsequent offline changes in performance
SG
No significant responses SDG
Right anterior hippocampus 24 18 20 3.48 0.013
Left anterior hippocampus 26 14 18 3.67 0.007
Right parahippocampal cortex 30 26 26 3.73 0.006
Right posterior hippocampus 40 32 16 3.18 0.030
32 40 2 3.45 0.014
Right cerebellar lobule IX 14 46 50 3.41 0.016
SG–SDG
No significant responses
SDG–SG
Left crus II 22 76 44 3.72 0.006
Left cerebellar lobule IX 14 44 50 3.70 0.007
Right superior frontal cortex 12 40 60 3.70 0.007
Left superior frontal cortex 8 26 64 3.28 0.023
Right parahippocampal cortex 34 26 30 3.04 0.042
Right anterior hippocampus 26 24 16 3.01 0.045
30 20 14 2.95 0.053
Right posterior hippocampus 22 30 12 2.92 0.057
(d) Regression analysis between cerebral activity during practice of the trained deviation during training and the subsequent savings in performance in both groups
SG + SDG
Left precuneus 14 64 56 6.11 0.000*
Right precuneus 14 58 55 5.32 0.003*
Left intraparietal sulcus 28 54 50 5.76 0.000*
22 76 42 4.84 0.024*
Right intraparietal sulcus 24 48 44 5.33 0.003*
30 74 38 5.24 0.004*
Left supramarginal gyrus 48 30 34 5.60 0.001*
on a number of performance measures, our data speak for the absence of sleep-dependent delayed gains in perfor-mance after motor adaptation learning, but rather for a sleep-dependent stabilization of performance. In contrast, sleep deprivation had a detrimental effect on performance. Con-versely, savings in performance occurred after both sleep and sleep deprivation, suggesting that this process is not sleep-dependent. At the cerebral level, activity in a cerebello– striato–cortical network increases in proportion to perfor-mance improvement during initial training. In parallel, recruit-ment of the hippocampus and frontal areas during training seems to protect the memory trace against the deleterious effect of sleep deprivation. In contrast, activity in the usual cerebello–cortical network during training seemed to predict the subsequent sleep-independent savings in performance. Finally, learning-related cerebral responses did not change significantly between training and retest in the SG, suggest-ing that sleep may participate in stabilization of the memory trace. By contrast, after sleep deprivation, brain areas usually involved in the earliest stages of learning were recruited during retest, when performance was deteriorated compared to training.
Behaviour
While the time–course of performance after a single practice of motor sequence is well known, this process is less well established for motor adaptation. Most studies on motor adaptation report that the average performance over all the sessions (Brashers-Krug et al., 1996; Shadmehr and Bras-hers-Krug, 1997; Trempe and Proteau, 2010) or average performance at the beginning of a session (Debas et al., 2010; Donchin et al., 2002; Krakauer et al., 2005) improves from initial training to testing 24 h later. Our results show that significant savings occurred irrespective of the sleep condi-tion during the first post-training night. These observations are concordant with studies showing significant savings overnight (Krakauer et al., 2005), but also during the day (Debas et al., 2010) or even after sleep deprivation (Donchin et al., 2002), suggesting that the emergence of savings is not a sleep-dependent process.
However, previous studies did not usually report whether or not performance changes from the end of training to the beginning of testing, and it seems that no delayed gain is observed overnight (Brashers-Krug et al., 1996; Debas et al., Table 2 Continued
Area x mm y mm z mm Z Psvc
Left precentral cortex 56 44 44 4.74 0.036*
Left inferior temporal gyrus 52 72 2 4.92 0.017*
36 70 0 4.78 0.031*
Right inferior temporal gyrus 56 60 20 4.79 0.029*
44 68 2 4.70 0.042*
Left superior frontal gyrus 26 2 72 4.84 0.020*
36 6 58 4.67 0.048*
Left postcentral gyrus 54 24 44 4.74 0.035*
Right cerebellar lobule V 14 56 16 4.71 0.040*
12 78 22 4.65 0.051*
Left cerebellar lobule V 18 74 24 4.65 0.052*
(e) Main effect of session on the trained deviation (retest–training) SG
Left superior temporal sulcus 48 0 34 3.43 0.021
SDG
Right putamen 26 2 6 3.86 0.006
Left putamen 26 6 4 3.40 0.022
Posterior cingulate cortex 12 48 36 3.68 0.011
Right cingulate motor area 14 4 48 3.61 0.013
Right inferior frontal gyrus 8 56 10 3.16 0.042
Left caudate nucleus 16 0 16 3.25 0.033
SG–SDG
No significant responses
SDG–SG
Anterior cingulate cortex 14 14 52 3.29 0.022
Right intraparietal sulcus 30 48 50 3.42 0.015
Left cerebellar lobule VI 28 54 20 3.37 0.018
Left cerebellar lobule V 28 34 34 3.29 0.022
Right sensorimotor cortex 34 12 72 3.28 0.022
SG, sleep group; SDG, sleep-deprived group.
Statistical inferences were performed at a threshold of P < 0.05 after correction for multiple comparisons over either the entire brain volume (*) or over small spherical volumes (svc).
2010; Donchin et al., 2002; Krakauer et al., 2005; Shadmehr and Brashers-Krug, 1997; Trempe and Proteau, 2010). Nevertheless, other authors reported delayed gains in per-formance on a visuomotor adaptation task that would (Hill et al., 2008; Huber et al., 2004) or would not (Doyon et al., 2009) be sleep-dependent. Various factors might account for these discrepancies: the kinematic features of the task, awareness of the deviation or the parameters used for assessing performance. The present findings, based on a number of performance measures, speak for the absence of delayed gains after motor adaptation learning, the perfor-mance levels achieved during late training being simply maintained at retest. In contrast, sleep deprivation had a detrimental effect on motor adaptation performance. The latter effect is not likely to be due to larger fatigue effect during the retest session in sleep-deprived subjects com-pared to sleepers, as it has been shown that following a single night of total sleep deprivation, individual performance on several tasks and subjective sleepiness are restored
completely after two nights of recovery sleep (Bonnet, 2000). One should, however, note that our results could be influenced by the menstrual cycle in females, not recorded in our study, which is known to modulate motor memory consolidation (Genzel et al., 2012).
Early recruitment of cerebellum, hippocampus and frontal cortex protects against the detrimental effects of subsequent sleep loss
During the initial practice of motor adaptation task, responses in the striatum, the cerebellar hemispheres, the sensorimotor cortex, the intraparietal sulci, the pre-frontal cortex and the hippocampus increased in proportion to the speeding of performance. Activity in these areas has already been described in early sensorimotor adaptation learning (Graydon et al., 2005; Seidler et al., 2006). Interestingly, at the same time, recruitment of the cerebel-lar hemisphere, the hippocampus and frontal areas is
(a)
(b)
(c)
Figure 3. Functional imaging results. Functional results are displayed at Puncorrected< 0.001 over the mean structural image of all subjects. In
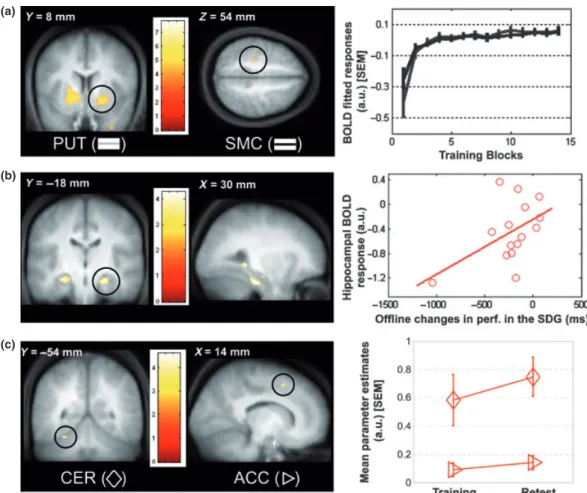
the insets, whiskers represent standard error of the mean; a.u.: arbitrary units. (a) Linear modulation of brain responses by mean performance. The plot illustrates the time–course of the fitted BOLD response modulated by mean performance across training blocks in the putamen (PUT) and the sensorimotor cortex (SMC). (b) Regression analysis between cerebral activity during training and subsequent offline changes in performance in the sleep-deprived group (SDG). The regression plot represents the BOLD responses in the right anterior hippocampus during training against the offline changes in performance on the learned deviation observed in the SDG. Each data point represents a single subject of the SDG. Note that the regression is still significant when excluding the outlier. (c) Main effect of session on the learned deviation on the SDG (retest–training). The plot represents the mean parameter estimates on the trained deviation during training and retest sessions for the cerebellum (CER) and the anterior cingulate cortex (ACC).
correlated with greater maintenance in performance after sleep deprivation. The interaction between the hippocam-pus and the frontal cortex has already been described during the early phases of motor sequence monitoring (Albouy et al., 2012) and for higher-order complex tasks (Darsaud et al., 2011), and is thought to support novice performance under control processes (Chein and Schnei-der, 2005). Our data suggest that subjects presenting high levels of hippocampal, frontal and cerebellar activity would monitor their performance closely during training, allowing the memory trace to become more resistant to the detrimental effect of subsequent sleep deprivation. Our findings also indicate that recruitment of this network could be considered as a distinct process, paralleling the usual cerebello–cortical activations shown to predict subsequent sleep-independent savings in performance. Interestingly, a recent paper proposes that visuomotor adaptation learning is attributable to separate processes acting in parallel to the cerebellar-dependent error-based network allowing adaptation (Huang et al., 2011). Our data suggest that the hippocampus and frontal cortex could participate in the monitoring of learning and even condition resistance of the memory trace to subsequent sleep deprivation.
Impact of sleep and sleep deprivation on offline cerebral response changes
Our data suggest that the maintenance in performance levels observed in sleepers was accompanied by stabiliza-tion of cerebral responses which did not change signifi-cantly between training and retest sessions. These results suggest that sleep after visuomotor adaptation may not participate in the reorganization of the memory trace, but simply in its stabilization. In contrast, the deterioration of performance in sleep-deprived subjects was contempora-neous with an increase in responses, from training to retest, in a cerebello–cortical network. Responses in cerebellar hemispheres have been described during early learning (Doyon et al., 2003; Flament et al., 1996; Floyer-Lea and Matthews, 2004; Nezafat et al., 2001), suggesting that this part of the cerebellum would participate in the detection and correction of errors when performance is inaccurate and in the building of an internal model of the task in the early stages of learning (Graydon et al., 2005; Imamizu et al., 2000). Our results suggest that sleep deprivation after motor adaptation learning hinders memory trace stabiliza-tion. During retest, cerebellar hemispheres, usually involved in the earliest stage of learning, and cortical areas are recruited to perform the task when performance is non-optimal.
A C K N O W L E D G E M E N T S
This study was supported by the Belgian FNRS, the Fondation Médicale Reine Elisabeth, the Research Fund of ULg and PAI/IAP Interuniversity Pole of Attraction. G.A. was
supported by a PhD grant from the French Ministère de la Recherche, V.S., G.V., M.D., M.B., T.D.V., E.B. and P.M. were supported by FNRS. G.R. was supported by the Fondation Fyssen. The authors thank Damien Fournet for his help with drawing Fig. 1.
R E F E R E N C E S
Albouy, G., Sterpenich, V., Balteau, E. et al. Both the hippocampus and striatum are involved in consolidation of motor sequence memory. Neuron, 2008, 58: 261–272.
Albouy, G., Sterpenich, V., Vandewalle, G. et al. Neural correlates of performance variability during motor sequence acquisition. Neuro-image, 2012, 60: 324–331.
Bonnet, M. Sleep deprivation. In: M. H. Kryger, T. Roth and W. C. Dement (Eds), Principles and Practice of Sleep Medicine. W.B. Saunders Company, Philadelphia, 2000: 53–71.
Brashers-Krug, T., Shadmehr, R. and Bizzi, E. Consolidation in human motor memory. Nature, 1996, 382: 252–255.
Buysse, D. J., Reynolds, C. F. III, Monk, T. H., Berman, S. R. and Kupfer, D. J. The Pittsburgh Sleep Quality Index: a new instrument for psychiatric practice and research. Psychiatry Res., 1989, 28: 193–213.
Chein, J. M. and Schneider, W. Neuroimaging studies of practice-related change: fMRI and meta-analytic evidence of a domain-general control network for learning. Brain Res. Cogn. Brain Res., 2005, 25: 607–623.
Darsaud, A., Wagner, U., Balteau, E. et al. Neural precursors of delayed insight. J. Cogn. Neurosci., 2011, 23: 1900–1910. Debas, K., Carrier, J., Orban, P. et al. Brain plasticity related to the
consolidation of motor sequence learning and motor adaptation. Proc. Natl Acad. Sci. USA, 2010, 107: 17839–17844.
Donchin, O., Sawaki, L., Madupu, G., Cohen, L. G. and Shadmehr, R. Mechanisms influencing acquisition and recall of motor mem-ories. J. Neurophysiol., 2002, 88: 2114–2123.
Doyon, J. and Benali, H. Reorganization and plasticity in the adult brain during learning of motor skills. Curr. Opin. Neurobiol., 2005, 15: 161–167.
Doyon, J., Penhune, V. and Ungerleider, L. G. Distinct contribution of the cortico–striatal and cortico–cerebellar systems to motor skill learning. Neuropsychologia, 2003, 41: 252–262.
Doyon, J., Korman, M., Morin, A. et al. Contribution of night and day sleep vs. simple passage of time to the consolidation of motor sequence and visuomotor adaptation learning. Exp. Brain Res., 2009, 195: 15–16.
Fischer, S., Nitschke, M. F., Melchert, U. H., Erdmann, C. and Born, J. Motor memory consolidation in sleep shapes more effective neuronal representations. J. Neurosci., 2005, 25: 11248 –11255.
Flament, D., Ellermann, J. M., Kim, S.-G., Ugurbil, K. and Ebner, T. J. Functional magnetic resonance imagning of cerebellar activation during the learning of a visuomotor dissociation task. Hum. Brain Mapp., 1996, 4: 210–226.
Floyer-Lea, A. and Matthews, P. M. Changing brain networks for visuomotor control with increased movement automaticity. J. Neurophysiol., 2004, 92: 2405–2412.
Genzel, L., Kiefer, T., Renner, L. et al. Sex and modulatory menstrual cycle effects on sleep related memory consolidation. Psychoneu-roendocrinology, 2012, 37: 987–998.
Graydon, F. X., Friston, K. J., Thomas, C. G., Brooks, V. B. and Menon, R. S. Learning-related fMRI activation associated with a rotational visuo-motor transformation. Brain Res. Cogn. Brain Res., 2005, 22: 373–383.
Hill, S., Tononi, G. and Ghilardi, M. F. Sleep improves the variability of motor performance. Brain Res. Bull., 2008, 76: 605–611.
Huang, V. S., Haith, A., Mazzoni, P. and Krakauer, J. W. Rethinking motor learning and savings in adaptation paradigms: model-free memory for successful actions combines with internal models. Neuron, 2011, 70: 787–801.
Huber, R., Ghilardi, M. F., Massimini, M. and Tononi, G. Local sleep and learning. Nature, 2004, 430: 78–81.
Imamizu, H., Miyauchi, S., Tamada, T. et al. Human cerebellar activity reflecting an acquired internal model of a new tool. Nature, 2000, 403: 192–195.
Korman, M., Raz, N., Flash, T. and Karni, A. Multiple shifts in the representation of a motor sequence during the acquisition of skilled performance. Proc. Natl Acad. Sci. USA, 2003, 100: 12492–12497.
Krakauer, J. W. Motor learning and consolidation: the case of visuomotor rotation. Adv. Exp. Med. Biol., 2009, 629: 405–421. Krakauer, J. W., Ghez, C. and Ghilardi, M. F. Adaptation to
visuomotor transformations: consolidation, interference, and for-getting. J. Neurosci., 2005, 25: 473–478.
Nezafat, R., Shadmehr, R. and Holcomb, H. H. Long-term adaptation to dynamics of reaching movements: a PET study. Exp. Brain Res., 2001, 140: 66–76.
Oldfield, R. C. The assessment and analysis of handedness: the Edinburgh inventory. Neuropsychologia, 1971, 9: 97–113. Seidler, R. D., Noll, D. C. and Chintalapati, P. Bilateral basal ganglia
activation associated with sensorimotor adaptation. Exp. Brain Res., 2006, 175: 544–555.
Shadmehr, R. and Brashers-Krug, T. Functional stages in the formation of human long-term motor memory. J. Neurosci., 1997, 17: 409–419.
Trempe, M. and Proteau, L. Distinct consolidation outcomes in a visuomotor adaptation task: off-line leaning and persistent after-effect. Brain Cogn., 2010, 73: 135–145.
Walker, M. P. A refined model of sleep and the time course of memory formation. Behav. Brain Sci., 2005, 28: 51–64; discussion 64–104.