O
pen
A
rchive
T
OULOUSE
A
rchive
O
uverte (
OATAO
)
OATAO is an open access repository that collects the work of Toulouse researchers and
makes it freely available over the web where possible.
This is an author-deposited version published in :
http://oatao.univ-toulouse.fr/
Eprints ID : 3159
To link to this article : DOI :10.1105/tpc.108.060830
URL :
http://dx.doi.org/
10.1105/tpc.108.060830
To cite this version :
Wang, Hua and Schauer, Nicolas and Usadel, Bjoern and Frasse,
Pierre and Zouine, Mohamed and Hernould, Michel and Latché,
Alain and Pech, Jean-Claude and Fernie, Alisdair R. and Bouzayen,
Mondher ( 2009) Regulatory Features Underlying
Pollination-Dependent and -Independent Tomato Fruit Set Revealed by
Transcript and Primary Metabolite Profiling. The Plant Cell, vol.21 .
pp. 1428-1452. ISSN 1040-4651
Any correspondance concerning this service should be sent to the repository
administrator: [email protected]
.
Regulatory Features Underlying Pollination-Dependent
and -Independent Tomato Fruit Set Revealed by Transcript
and Primary Metabolite Profiling
Hua Wang,
a,bNicolas Schauer,
cBjoern Usadel,
cPierre Frasse,
a,bMohamed Zouine,
a,bMichel Hernould,
dAlain Latche´,
a,bJean-Claude Pech,
a,bAlisdair R. Fernie,
cand Mondher Bouzayen
a,b,1aUniversite´ de Toulouse, Institut National Polytechnique - Ecole Nationale Superieure Agronomique Toulouse, Ge´nomique et
Biotechnologie des Fruits, Castanet-Tolosan F-31326, France
bInstitut National de la Recherche Agronomique, Ge´nomique et Biotechnologie des Fruits, Chemin de Borde Rouge,
Castanet-Tolosan, F-31326, France
cMax-Planck-Institut fu¨r Molekulare Pflanzenphysiologie, 14476 Potsdam-Golm, Germany
dUnite´ Mixte de Recherche 619 Biologie du Fruit, Institut National de la Recherche Agronomique, Universite´ de Bordeaux,
Institut de Biologie Ve´ge´tale Mole´culaire, 33883 Villenave d’Ornon, France
Indole Acetic Acid 9 (IAA9) is a negative auxin response regulator belonging to the Aux/IAA transcription factor gene family whose downregulation triggers fruit set before pollination, thus giving rise to parthenocarpy. In situ hybridization experiments revealed that a tissue-specific gradient of IAA9 expression is established during flower development, the release of which upon pollination triggers the initiation of fruit development. Comparative transcriptome and targeted metabolome analysis uncovered important features of the molecular events underlying pollination-induced and pollination-independent fruit set. Comprehensive transcriptomic profiling identified a high number of genes common to both types of fruit set, among which only a small subset are dependent on IAA9 regulation. The fine-tuning of Aux/IAA and ARF genes and the downregulation of TAG1 and TAGL6 MADS box genes are instrumental in triggering the fruit set program. Auxin and ethylene emerged as the most active signaling hormones involved in the flower-to-fruit transition. However, while these hormones affected only a small number of transcriptional events, dramatic shifts were observed at the metabolic and developmental levels. The activation of photosynthesis and sucrose metabolism-related genes is an integral regulatory component of fruit set process. The combined results allow a far greater comprehension of the regulatory and metabolic events controlling early fruit development both in the presence and absence of pollination/fertilization.
INTRODUCTION
Fruit development is a genetically programmed process, unique to flowering plants, which provides a suitable environment for seed maturation and seed dispersal. Given the fundamental nature of both the dietary and biological significance of fruit, it is unsurprising that the molecular dissection of fruit development has recently received considerable interest (Giovannoni, 2001; Pandolfini et al., 2007; Serrani et al., 2008). The fruit is the result of the development of the ovary, and fruit organogenesis originates from a flower primordial. The mature flower can either be fertilized and develop into a fruit or, in the absence of successful pollination, can enter the abscission process. The onset of the development of an ovary into fruit, the so-called fruit set, thus constitutes an essential mechanism for fruit production. Despite the importance of the fruit set process, most research effort to
date has been dedicated to the processes of fruit maturation (Alba et al., 2005) and fruit growth (Carrari et al., 2006), while the molecular mechanisms underlying the onset of ovary develop-ment itself remain relatively poorly defined.
In normal fruit development, the initiation of fruit set depends on the successful completion of pollination and fertilization; this suggests that both pollination and seed-derived signals are required for fruit initiation and subsequent development. Fruit growth and shape are known to be modified by differences in seed genotype and seed number (Sedgley and Griffin, 1989). However, the signals that trigger fruit growth after fertilization remain unknown. Unfavorable conditions, such as extreme tem-peratures, may prevent pollination and hence also fruit set. Mild temperature stress, leading to loss of pollen viability, can result in the production of underfertilized puffy fruits of poor quality, while severe temperature stress can completely abolish fruit set. In tomato (Solanum lycopersicum) and many other species, a major limiting factor for fruit set is the extreme sensitivity of microspo-rogenesis and pollination to moderate fluctuations in tempera-ture and humidity (Picken, 1984). Hence, parthenocarpy, the growth of the ovary into a seedless fruit in the absence of pollination and fertilization, has long been recognized as an important trait that circumvents the problems of low fruit set in 1Address correspondence to [email protected].
WOnline
www.p T Plant
harsh environmental conditions (Gorguet et al., 2005). Fertilization-independent fruit set can occur either naturally (genetic parthe-nocarpy) or by induction via exogenous application of phytohormones, such as auxin and gibberellins (GAs), to the flower (Gustafson, 1936; Coombe, 1960). The presence of both germinated pollen and developing seeds appears to be essential for fruit growth and development, since they probably serve as sources of phytohormones that are, most likely, continuously required throughout seed and fruit formation (Nitsch, 1970; Talon et al., 1992; Ozga et al., 2002). In keeping with this hypothesis, elevated endogenous phytohormone levels have been observed during parthenocarpic fruit set (George et al., 1984; Talon et al., 1992). Accordingly, parthenocarpy can be induced in diverse agricul-tural species not only by the exogenous application of auxins, cytokinins, or GAs (Gillaspy et al., 1993; Vivian-Smith and Koltunow, 1999; Serrani et al., 2007) but also by increasing either auxin levels or auxin response in ovaries and ovules (Carmi et al., 2003; Rotino et al., 2005) or by increasing the GA response (Potts et al., 1985). Recent molecular analyses of fertilization-indepen-dent fruit formation in both tomato and Arabidopsis thaliana have, however, identified auxin signaling as one of the early events in the fruit initiation cascade. Furthermore, components of the auxin signaling pathway are also involved in repressing fruit initiation until the fertilization cue (Vivian-Smith et al., 2001; Wang et al., 2005; Goetz et al., 2006). When considered together, these data demonstrate that hormones, such as auxin, play an impor-tant role in fruit initiation. However, the exact mechanism by which auxin promotes fruit initiation and the nature of the genes that control fruit set remain an open question.
We previously reported that downregulation of IAA9, a mem-ber of the Aux/IAA transcription factor gene family encoding a negative auxin response regulator, in tomato resulted in pollination-independent fruit set giving rise to parthenocarpy (Wang et al., 2005). In this study, taking advantage of this unique biological tool, we sought to uncover the molecular events underlying the process of fruit set via a combined transcriptomic and metab-olomic approach. Our study reveals that IAA9 closely regulates the initiation of fruit set by establishing a spatial expression gradient whose release triggers the flower-to-fruit transition. The comparative analysis at the transcriptomic and metabolic levels of pollination-induced natural fruit set and fertilization-indepen-dent fruit set ifertilization-indepen-dentifies auxin and ethylene signaling, as well as photosynthesis and sugar metabolism, as major events of the fruit set program and potential components of the regulatory mechanism underlying this developmental process. These data are discussed in comparison to current models of fruit set as well as within the context of the development of future strategies for the biotechnological exploitation of parthenocarpy.
RESULTS
Fertilization-Independent Fruit Set in AS-IAA9
MicroTom tomato lines downregulated in the expression of the IAA9 gene (AS-IAA9) exhibit precocious fruit set prior to anthesis, resulting in parallel fruit and flower development (Figure 1A) and uncoupling fruit set from pollination, leading to parthenocarpy
Figure 1. Comparison of Wild-Type and AS-IAA9 Ovary/Fruit Development during Fruit Set.
(A) AS-IAA9 lines exhibit precocious fruit set prior to anthesis, resulting in abnormal parallel development of fruit and flower at anthesis stage. (B) Impact of pollination on fruit size at 8 DPA. +P, pollinated; !P, nonpollinated. Bar = 8 mm.
(C) Percentage of fruit set (the transition from flower to fruit and subsequent fruit development) from emasculated and pollinated flowers in wild-type and
AS-IAA9 lines.
(D) Ovary/fruit diameter in wild-type and AS-IAA9 lines at anthesis (An) and 8 d postemasculation (DPE). (E) Accelerated ovary-fruit enlargement in AS-IAA9 (AS) compared with the wild type.
(Wang et al., 2005). The rate of successful fruit set of emascu-lated AS-IAA9 lines (75%) was similar to that observed in the wild type (68%) under natural pollination conditions (Figure 1C). At 8 d postanthesis (DPA), unpollinated AS-IAA9 young fruits and nat-urally pollinated wild type had similar size (Figure 1B). Manual pollination stimulated the development of AS-IAA9 fruit, leading to a fruit size at 8 DPA that were on average 76% bigger than AS-IAA9 emasculated fruit or wild-type naturally pollinated ones (Figures 1D and 1E). Moreover, Figure 1D indicates that from bud stage onward, AS-IAA9 displayed accelerated ovary fruit en-largement compared with the wild type. Taken together, these data indicated that pollination of AS-IAA9 has no significant impact on the rate of fruit set, whereas it substantially promotes fruit enlargement.
Downregulation of IAA9 Affects Flower/Ovary Development Given that fruit organogenesis is initiated from the floral primor-dia, light microscopy analysis was performed to investigate early fruit organogenesis in the wild type and AS-IAA9. Figures 2A and 2B reveal that the floral meristem is larger in AS-IAA9 compared with the wild type, and comparison of 2-mm-long flower buds (Figures 2C and 2D) revealed that the wild type exhibits fused carpels while, at the same size, carpels are still growing toward fusion in AS-IAA9. When flower buds are 4 mm long, the nucellus in the wild type is completely embedded in the integument, while, in AS-IAA9, the integument is still in the process of surrounding the nucellus (Figures 2E and 2F). These observations indicate that the AS-IAA9 flower organ corresponds to a more juvenile stage than the wild type and that organ differentiation is not more advanced in the IAA9-downregulated lines but rather that the organ exhibits larger growth. Mature AS-IAA9 flowers (anthesis stage) contained a higher proportion of aborted pollen grains (Figure 2H) than the wild type (Figure 2G), while those not aborted were significantly larger and more intensely colored than in the wild type. However, the latter observation is largely in keeping with our previous observation that AS-IAA9 pollen retains the capacity to fertilize emasculated wild-type flowers (Wang et al., 2005).
Spatial and Temporal Regulation of IAA9 Expression during Natural Fruit Set
In situ hybridization during wild-type flower/ovary development and fruit set revealed that IAA9 mRNA distribution was detect-able in the whole floral meristem but was more abundant in emerging organs, such as stamen and carpel (Figure 3B). In the emerging petals, the signal intensity was higher on the adaxial sides. A control hybridization using the sense probe showed no signal (Figure 3A). Though unevenly distributed, the IAA9 mRNA signal was detected across all flower tissues but exhibited a steady increase throughout flower development peaking at anthesis (Figures 3C to 3G). At these stages, accumulation of the IAA9 transcript formed a gradient wherein the signal is strongest in ovule, sporogenous tissue, tapetum, petals, vascu-lar bundles, developing style, placenta, and funiculus, but, by contrast, the signal was weak in sepals, ovary wall, and the
columella. Successful pollination and fertilization triggered the dissipation of the IAA9 transcript gradient, which tended to spread across the developing fruit leading to a net decrease in transcript abundance in the placenta, funiculus, and inner integ-ument of embryonic sac (Figures 3H to 3K). Conversely, in the absence of pollination, emasculated flowers retained the original transcript gradient associated with arrest of fruit development (Figures 3L to 3O). A close examination of the ovule confirmed
Figure 2. Histological Analysis of Organ Differentiation Program in Wild-Type and AS-IAA9 Flowers.
(A) and (B) Floral meristem is larger in AS-IAA9 line (AS) than in the wild type as indicated by white bars.
(C) and (D) In 2-mm-long flower buds, wild-type lines exhibit fully fused carpels, whereas at the same size, carpels are still growing toward fusion (arrows) in AS-IAA9.
(E) and (F) In 4-mm-long flower buds, the nucellus is already completely enveloped by the integuments in the wild type, whereas it is still not fully covered by the integuments in AS-IAA9 lines (insets).
(G) and (H) In mature flowers (anthesis stage), a high proportion of pollen grains are aborted in antisense lines compared with the wild type. Nonaborted pollens are significantly bigger and intensely colored in antisense lines compared with the wild type. Bars = 100 mm.
that after flower emasculation, unfertilized ovules displayed a strong gradient in IAA9 transcript abundance, which maintains a high level of IAA9 transcripts in cell layers of inner integuments and funiculus tissues (Figure 3O). Successful fertilization re-leased this gradient, leading to a spreading of the IAA9 transcript across the developing ovule at 3 DPA (Figure 3K).
Experimental Design for Combined Transcriptomic and Metabolomic Analysis of Fruit Set
In an attempt to identify important regulatory genes and meta-bolic pathways involved in tomato fruit set, we used transcrip-tomic and metabolomic approaches as well as real-time PCR analyses of target genes. The complete experimental design
Figure 3. In Situ Hybridization Reveals That Pollination Triggers the Release of the IAA9 Transcript Gradient. (A) Low background signal detected in control hybridization experiment performed with IAA9 sense probe.
(B) IAA9 mRNAs are distributed all over the floral meristem, with higher accumulation in emerging organs, such as petals, stamen, and carpel. Signal intensity is higher in the adaxial sides of the emerging stamen.
(C) to (G) IAA9 mRNA signal increases throughout flower development with uneven distribution leading to the formation of a gradient peaking at anthesis stage. Flowers from all the stages analyzed were put in the same slide and were therefore developed for the same amount of time. (H) to (J) Pollinated ovaries at 1, 3, and 5 d after pollination (DPP). Pollination results in a rapid release of the IAA9 gradient leading to a net decrease in
IAA9 mRNA accumulation in the placenta, funiculus, and inner integument of embryonic sac.
(K) Close-up examination of fertilized ovule. Successful fertilization releases the IAA9 mRNA gradient, resulting in a spreading of the IAA9 signal all over the developing ovule.
(L) to (N) Emasculated ovaries at 1, 3, and 5 DPE. In the absence of pollination, emasculated flowers retain the IAA9 expression gradient and display an arrest of ovary development.
(O) Close-up examination of unfertilized ovule shows that 3 d after emasculation, a strong IAA9 mRNA gradient is maintained with a high signal detected in cell layers of inner integuments and funiculus tissues.
Magnification is35 in (C) to (J) and (L) to (N) and 340 in (A), (B), (K), and (O). Bars = 100 mm. sp, sepal; sm, stamen; cap, carpels; sl, style; spg, sporogenous tissue; tap, tapetum; c, columella; ow, ovary wall; pl, placenta; f, funiculus; v, vascular bundles; es, embryo sac.
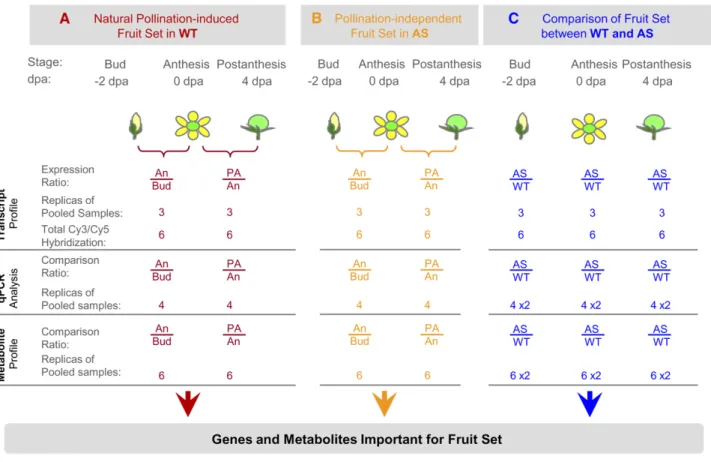
included three parallel experiments (Figure 4). The first experi-ment aimed at defining the genes whose expression is associ-ated with the transitions from bud through anthesis to the postanthesis stages and the corresponding metabolic shifts during natural fertilization-induced fruit set. The second exper-iment was designed to define the genes differentially expressed during pollination-independent fruit set in AS-IAA9 plants. The third experiment aimed at identifying IAA9 regulated genes (directly or indirectly regulated) during fruit set in ovary/fruit tissues. For this purpose, we conducted comprehensive analysis of gene expression in AS-IAA9 and the wild type at three developmental stages during fruit set: flower bud, anthesis, and postanthesis. For each experiment, metabolomic changes associated with both types of fruit set were examined in wild-type and two independent AS-IAA9 lines (Figure 4).
Oligonucleotide microarrays (EU-TOM1) containing 11,860 tomato unigenes were used to compare transcript profiles corresponding to preanthesis flower buds (22 DPA), anthesis
mature flower (0 DPA), and postanthesis fertilized flower (4 DPA) in the wild type and AS-IAA9. For each point, six Cy-labeled cDNAs corresponding to three independent biological samples with a dye-swap were hybridized to six independent array slides. The statistical analysis of the data was performed with R/MAANOVA package (see Methods).
General Feature of Fruit Set Expression Profiles
To identify new candidate genes that are essential for the fruit set process, we performed a comprehensive analysis of gene expression associated with the flower-to-fruit transition in wild-type dependent fruit set and in AS-IAA9 pollination-independent fruit set. We compared the sets of differentially expressed genes between the two genotypes (Figure 5) and found, notably, that the overwhelming majority of the differen-tially expressed genes were common to both processes of fruit set (see Supplemental Table 4 online). In a further step, putative
Figure 4. Experimental Design for Analyzing Transcriptomic and Metabolomic Changes Associated with Fruit Set in the Wild Type and AS-IAA9. Combined transcriptomic and metabolomic approaches were used to investigate the molecular events associated with pollination-induced natural fruit set in the wild type (A), pollination-independent fruit set in AS-IAA9 (AS) (B), and to identify differentially expressed genes or altered metabolites in antisense (AS) fertilization-free fruit set versus pollination-dependent fruit set in the wild type (C). Bud (equivalent to 2 d before anthesis, !2 DPA), anthesis (An), and postanthesis (PA; 4 DPA) stages were considered. For transcriptome analyses, a direct comparison of AS-IAA9 lines to their wild-type counterpart was employed. At each of the three developmental stages, Cy-labeled cDNAs were hybridized to six independent 12k-oligomicroarrays (EU-TOM1) using a triple dye-swap design. The abundance of a broad range of metabolites was quantified using GC-MS. Fruit/ovary tissues were pooled from wild-type (cv MicroTom) and AS-IAA9 homozygous lines, and the samples were split into two parts, one to be used in microarray hybridization and the other in metabolite quantification. Cy3, cyanine3 fluor; Cy5, cyanine5 fluor; AS, IAA9 antisense lines; qPCR, quantitative real-time PCR.
correlations between the genes that are differentially expressed during the transition from bud through anthesis to postanthesis in the wild type and AS-IAA9 and those differentially expressed between the two genotypes were identified. In total, this study identified 870 genes (751 + 119) that are differentially expressed in both pollination-independent and pollination-dependent fruit set, among which only 119 display IAA9-dependent regulation (Figure 5; see Supplemental Table 5 online). Moreover, among
the genes exhibiting differential expression during pollination-dependent fruit set (1931), the vast majority of genes were independent of IAA9 regulation. Similarly, among the genes that are common to both types of fruit set, the majority were inde-pendent of IAA9 regulation. This reflects the fact that only a small proportion of fruit set–associated genes is dependent on normal IAA9 regulation.
Transcriptome Analysis of Pollination-Induced Fruit Set in the Wild Type
Statistical analysis indicated that among 1931 differentially ex-pressed genes in the wild type, 1455 genes exhibited differential expression during the transition from bud to anthesis stages and 1650 genes between anthesis and postanthesis stages (Figure 6; see Supplemental Table 1 online). The high number of genes displaying altered expression during fruit set is indicative of dynamic regulatory mechanisms underlying this developmental process. Functional categorization of the differentially expressed genes revealed that the major groups affected belong to gene categories encoding components of signal transduction, proteins involved in metabolic pathways, or proteins associated with cell division (Table 1). These results suggest that the fruit set process in tomato requires complex regulatory control and intensive cell division as well as reconfiguration of metabolic processes.
Surprisingly, the number of differentially regulated genes be-tween bud and postanthesis was lower than during the transi-tions from bud to anthesis and from anthesis to postanthesis, consistent with a mechanism wherein a large number of genes undergo a transient up- or downregulation at the anthesis stage. Moreover, the majority of differentially expressed genes are downregulated during the transition from flower bud to anthesis, while the reverse occurs during the transition from anthesis to postanthesis (Figure 6A), indicating that there is no continuum of ovary development from bud to postanthesis.
Figure 5. Venn Diagram of Fruit Set–Associated Genes.
Venn diagram showing genes differentially expressed during the three stages of flower-to-fruit transition in the wild type (red circle) and
AS-IAA9 (AS; yellow circle) tomato and differentially expressed between
pollination-dependent and -independent fruit set (AS versus WT, blue circle). Overlap between each set of genes is indicated by different colors. Total numbers of differentially expressed genes are indicated in white boxes; the number of genes in each subset is indicated within the appropriate colored domain.
Figure 6. Global Gene Expression Pattern in Pollination-Dependent and -Independent Fruit Set.
(A) and (B) Differentially expressed genes (either up- or downregulated) during the transition from flower bud to anthesis and from anthesis to postanthesis in natural pollination-induced fruit set of wild-type plants (A) and pollination-free fruit set in antisense (AS) lines (B).
(C) Differentially expressed genes between AS and the wild type during fruit set at three developmental stages: bud (B), anthesis (An), and postanthesis (PA). Upregulated (Up), downregulated (Down), and total altered genes (total) refer to changes in transcript accumulation displaying log2(ratio) higher
Transcriptome Analysis of Fertilization-Independent Fruit Set in AS-IAA9
Statistical analysis of the global gene expression associated with pollination-independent fruit set in AS-IAA9 indicated that 947 genes exhibited differential expression during the transition from bud to anthesis (Figure 6B; see Supplemental Table 2 online) and 909 from anthesis to postanthesis (Figure 6B). In contrast with pollination-induced fruit set where the highest transition occurs between anthesis and postanthesis, the major shift in terms of change in transcript accumulation in AS-IAA9 occurs at the transition from bud to anthesis.
Functional categorization of the differentially expressed genes (Table 2) revealed that the major groups affected during the process of fruit set in antisense lines belong to gene categories encoding components of signal transduction, metabolic path-ways, and cell division. Of particular note, the percentage of cell division–associated genes changing on the developmental tran-sition is considerably lower in AS-IAA9 compared with that found in the wild type.
Comparative Transcriptome Analysis of Wild-Type and AS-IAA9 Fruit Set
We next sought to identify genes that are differentially expressed between the two genotypes during fruit set. When all three developmental stages are considered, a total of 480 genes showed differential expression between wild-type and AS-IAA9 lines (Figure 5), and the difference between the two lines was greatest at anthesis (Figure 6C). Functional classification of these differentially expressed genes (Table 3) revealed that the major discriminating factors between the two lines are dependent on the developmental stage. That is, at flower bud stage, the major groups of differential genes belong to the category of signal transduction, whereas at anthesis stage, the most prevalent groups encode proteins involved in cell division and metabolism.
At postanthesis stage, the most discriminating groups are those associated with photosynthesis (35%) and metabolism. Func-tional classification of these genes (Table 3) also indicates that among the differentially expressed genes, those exhibiting po-tential regulatory function (such as those involved in hormone response or signal transduction) decrease steadily from bud to postanthesis stage, while those associated with potential exec-utor function (such as those involved in photosynthesis, cell division, and metabolism), increase from bud to postanthesis. Validation of Microarray Expression Data by
Quantitative RT-PCR
Quantitative real-time-PCR (qRT-PCR) was used to validate the microarray analysis data and to further define the expression pattern of selected genes, relating to our biological focus, during fruit set. Representatives from 11 functional groups of differen-tially expressed genes between AS-IAA9 and the wild type (Table 1) were selected for qRT-PCR. In total, 25 genes were analyzed and the resultant qRT-PCR profiles were compared with micro-array expression profiles and scored as matching if they agreed in the expression pattern. By this criterion, 90% of the values have the same pattern of expression in the microarray experi-ment as in the qRT-PCR experiexperi-ment, whereas for the remaining 10%, only one or two biological repetition out of four showed the same pattern of expression in the microarray experiment (see Supplemental Table 7 online).
Downregulation of IAA9 Strongly Promotes Photosynthesis-Related Genes at Fruit Set
During pollination-induced fruit set, photosynthesis-related genes were downregulated during the transition from bud to anthesis, whereas they were generally upregulated from anthesis to postanthesis (see Supplemental Table 1 online). By contrast, photosynthesis-related genes were strongly activated in AS-IAA9 throughout fruit set (Table 3), and, notably, all these genes without exception (43 in total) were upregulated in the AS-IAA9
Table 1. Functional Classification of Differentially Expressed Genes during Natural Pollinated Wild-Type Fruit Set
An/B (Wild Type) PA/An (Wild Type) PA/B (Wild Type) Assignment No. of Genes % No. of Genes % No. of Genes % Hormone responses 67 5 75 5 61 5 Signal transductiona 349 24 365 22 295 23 Metabolism 286 20 357 22 269 21 Cell division 116 8 161 10 136 10 Photosynthesis 52 4 54 3 37 3 Cell wall 39 3 45 3 36 3 Cell structure 24 2 29 2 16 1 Stress/defense responses 97 7 100 6 85 7 Transporter 72 5 92 6 73 6 Others 38 3 44 3 43 3 Unknown 315 22 328 20 247 19 Total 1455 100 1650 100 1298 100
aIncluding transcription factor.
Table 2. Functional Classification of Differentially Expressed Genes during Pollinated-Independent Fruit Set in AS-IAA9 Lines
An/B (AS) PA/An (AS) PA/B (AS)
Assignment No. of Genes % No. of Genes % No. of Genes % Hormone responses 50 5 48 5 39 5 Signal transductiona 242 26 212 23 170 24 Metabolism 180 19 190 21 135 19 Cell division 54 6 50 6 42 6 Photosynthesis 26 3 28 3 25 4 Cell wall 23 2 24 3 20 3 Cell structure 18 2 17 2 14 2 Stress/defense responses 66 7 59 6 55 8 Transporter 53 6 55 6 42 6 Others 22 2 24 3 22 3 Unknown 213 22 202 22 147 21 Total 947 100 909 100 711 100
lines compared with the wild type (see Supplemental Table 3 online). qRT-PCR analysis (Figures 7A and 7B) further confirmed the expression profile revealed by microarray for two photosyn-thesis-associated genes encoding chlorophyll a/b binding pro-tein 4 (CAB4) and chlorophyll a/b binding propro-tein 1D (CAB-1D). The two genes were upregulated at postanthesis stages in the wild type, and their upregulation continued during subsequent cell division and enlargement phases of fruit development (Figure 7C). In line with the upregulation of photosynthesis-related genes, downregulation of IAA9 was associated with a dramatic upregulation of genes involved in sucrose catabolism (Figure 7D), particularly at the postanthesis stage and to a lesser extent at the anthesis stage, suggesting the importance of these genes in the processes of the flower-to-fruit transition. Notably, all sugar metabolism genes that are differentially expressed be-tween AS-IAA9 and the wild type displayed upregulation during the fruit set developmental process, suggesting that activation of sugar metabolism may be an important event coupled with the initiation of pollination-independent fruit set.
The Fruit Set Process Recruits a High Number of Transcriptional Regulators
Up to 199 transcription factors displayed differential expression during natural fruit set. Such a high number of transcriptional regulators is indicative of the massive and complex regulation required for the fruit set process (see Supplemental Table 1 online). Comparing the transcriptomic profiles associated with the fruit set process in the wild type and AS-IAA9 revealed that 18 transcription factors showed differential expression be-tween the two genotypes (see Supplemental Table 3 online). qRT-PCR analysis showed that during natural pollination-induced fruit set in the wild type, the expression of two MADS box genes, Tomato Agamous1 (TAG1) and Tomato Agamous-like 6 (TAGL6), underwent dramatic downregulation following fertilization exhibiting seven- and eightfold decreases in the level
of transcript accumulation, respectively (Figure 8A). Interest-ingly, during later stages of fruit development, the expression level of the two genes continued to display sharp and steady decreases with TAG1 and TAGL6 transcripts dropping at 10 DPA to
;
10 and 1% of their levels at 1 DPA, respectively (Figure 8C). Moreover, compared with the wild type, the two MADS box genes underwent a net downregulation during fruit set in AS-IAA9 lines, which was most prominent at the anthesis stage (Figure 8B). Since both natural and pollination-independent fruit set were both characterized by a net downregulation of TAG1 and TAGL6, it can be speculated that these two MADS box genes are key players in the process of fruit set and that AS-IAA9 may promote fertilization-independent fruit set by downregulat-ing their expression.Upregulation of Cell Division-Related Genes Is Advanced in AS-IAA9 Lines
A number of cell division, protein biosynthesis, and cell wall– related genes were upregulated at the postanthesis stage in the wild type, while their activation occurred earlier in AS-IAA9 at the anthesis stage (see Supplemental Tables 1 and 2 online). Remark-ably, when comparing pollination-dependent and -independent fruit set, these genes were found to be upregulated in AS-IAA9 at the anthesis stage but downregulated at postanthesis (see Supplemental Table 3 online). These included cyclinA3, cyclinb, and 19 unigenes coding for histones that all displayed higher expression in AS-IAA9 at anthesis stage. A large group of 67 ribosomal protein genes was also all upregulated at anthesis stage in AS-IAA9. A total of 24 cell wall–related genes were differentially expressed in AS-IAA9, with a large majority of them being upregulated, including cellulose synthases, expansins, extensins, polygalacturonase, and glucanases. In particular, the polygalacturonase inhibitor protein (PGIP1) gene, putatively in-volved in fruit enlargement, was very strongly upregulated (sev-enfold) at both bud and anthesis stages in AS-IAA9, but only at postanthesis in naturally pollinated wild-type young fruit (see Supplemental Tables 1 and 3 online).
The expression of two histone protein genes and two ribo-somal protein genes during the flower-to-fruit transition in wild-type lines displayed a strong activation at 4 DPA (Figure 9A) and then a sharp decline after 10 DPA, coinciding with the shift from cell division to cell enlargement phases (Figure 9C). Interestingly, the upregulation of these genes occurred at anthesis stage in AS-IAA9. Consistently, when compared with the wild type, the expression of all four genes was upregulated in AS-IAA9 at both bud and anthesis stages but was clearly downregulated at the postanthesis stage (Figure 9B). By contrast, the expansin10 gene showed higher expression in AS-IAA9 compared with the wild type throughout the three stages of fruit set, and its transcript levels remained high after the shift from cell division to fruit enlargement during natural fruit development (Figures 9B and 9C). Expression of Phytohormone-Related Genes during the Process of Fruit Set
Taking into account the prominent role played by phytohor-mones in triggering and coordinating the flower-to-fruit transition
Table 3. Functional Classification of Differentially Expressed Genes between Antisense and the Wild Type during Fruit Set
Bud (AS versus WT) An (AS versus WT) PA (AS versus WT) Assignment No. of Genes % No. of Genes % No. of Genes % Hormone responses 16 12 17 5 4 4 Signal transductiona 23 17 36 10 11 10 Metabolism 21 15 74 20 22 20 Cell division 22 16 108 30 13 12 Photosynthesis 2 1 29 8 39 35 Cell wall 7 5 18 5 2 2 Cell structure 1 1 8 2 5 4 Stress/defense responses 19 14 27 7 8 7 Transporter 8 6 14 4 2 2 Others 4 3 11 3 0 0 Unknown 16 12 23 6 6 5 Total 139 100 365 100 112 100
developmental process, we closely examined transcript accu-mulation of genes associated with hormone responses and metabolism. During natural pollinated fruit set, almost 5% of the differentially expressed genes was related to hormone me-tabolism and signaling (Table 1). Functional category classifica-tion of these genes indicated that auxin, ethylene, and polyamine-associated genes were the most prominent in this developmental process (Figure 10A, left panel) as well as in the pollination-free fruit set of AS-IAA9 (Figure 10A, right panel). The high number of ethylene-related genes observed to change suggests that in addition to the well-established role of auxin and GAs (Pandolfini et al., 2007; Serrani et al., 2007), ethylene must also play an active role in fruit set. Detailed evaluation of the ethylene-associated genes reveals that they included both key ethylene signal transduction pathway and ethylene biosynthesis genes (see Supplemental Table 1 online).
qRT-PCR analysis (Figures 10B to 10D) indicated that, in both the wild type and AS-IAA9, the expression of all hormone-related
genes selected underwent dramatic downregulation following the anthesis stage (Figures 10B to 10D, left panel), which continued until at least 14 DPA in the wild type (Figures 10B to and 10D, right panel). Notably, the downregulation of auxin-related genes occurred earlier (2 DPA) than that of ethylene-related genes (6 DPA). As a general feature, the hormone-ethylene-related genes displayed lower expression in AS-IAA9 lines compared with the wild type (Figures 10B to 10D, middle panel). According to these data, auxin and ethylene are the two hormones most prominently involved in the control of the flower-to-fruit transition developmental process.
Aux/IAA and ARF Genes Are Strongly Regulated during Fruit Set
Considering the role of IAA9 in mediating auxin responses and that generally ascribed to auxin in the process of fruit set, we sought to study the expression profile of all members of the Aux/
Figure 7. Expression Analysis of Genes Involved in Photosynthetic Processes and Sugar Metabolism.
(A) Expression kinetics of selected photosynthetic genes during pollination-dependent fruit set in wild-type (black line) and pollination-free fruit set in
AS-IAA9 (gray line) assessed by qRT-PCR. cDNA were prepared from the same RNA samples used in the microarray experiment. Data are expressed
as relative values, based on the values of bud ovary taken as reference sample set to 1.
(B) Comparison of transcript levels between the wild type (white bar) and two independent AS-IAA9 lines AS1 (black bar) and AS2 (gray bar) assessed by qRT-PCR at three developmental stages. Data are expressed as relative values, based on the reference wild-type samples set to 1.0 at each stage considered.
(C) Transcript accumulation during early stage of natural pollination-induced fruit set in the wild type. Relative expression levels for stages 2 to 20 DPA were determined based on the reference 1 DPA sample set to 1.0. CAB4, chlorophyll a/b binding protein 4; CAB-1D, chlorophyll a/b Binding Protein1D. Error bars represent6SEof four biological repetitions.
(D) Comparative transcript accumulation in the wild type at different stages of genes involved in sugar metabolism identified by microarray analysis as differentially expressed between wild-type and antisense lines.
IAA and auxin transcription factors (ARF) gene families available in tomato. The expression data (Figure 11) indicate that through-out the process of natural fruit set, both ARFs and Aux/IAAs display a dramatic shift in their expression, suggesting an active role of these transcriptional regulators in this developmental process. Moreover, downregulation of IAA9 resulted in a feed-back regulation of a number of ARF and Aux/IAA genes. Of particular note is the fact that half of the ARF genes tested (7 out of 14) undergo opposite regulation during the transitions from bud to anthesis and from anthesis to postanthesis (Figure 11A). The expression of the overwhelming majority of ARF genes at the bud stage was strongly upregulated in AS-IAA9 lines compared with the wild type (Figure 11B). Notably, ARF4, ARF8, and ARF18 showed strong upregulation upon pollination in the wild type, and their expression levels were higher in the AS-IAA9 line at bud stage, suggesting their potential involvement in the process of pollination-independent fruit set. Most Aux/IAA genes (13 out of 18) were downregulated during the transition from bud to anthe-sis, whereas a number of them (six genes) displayed clear upregulation during the transition from anthesis to postanthesis. The Aux/IAAs genes that were upregulated upon pollination in the wild type (IAA1, IAA3, IAA11, IAA13, IAA14, and IAA30) displayed higher expression in AS-IAA9 than in wild-type lines at bud stage, suggesting that the upregulation of these genes is integral to the fruit set process.
Metabolite Accumulation in Ovary/Fruit during Natural Pollinated Fruit Set
Information related to metabolic changes underlying the flower-to-fruit transition are still lacking, and the studies of flower
metabolism in various species generally tend to be confined to specific pathways of importance with respect to color or fra-grance (Dudareva et al., 1996; Moyano et al., 1996; Dunphy, 2006). To identify the changes in primary metabolism that underlie the flower-to-fruit transition, an established gas chromatography– mass spectrometry (GC-MS) method was applied to extracts from the materials described in the experimental design (Figure 4). Comparing the metabolite contents between the samples harvested at anthesis and bud stages in the wild type revealed little difference in the metabolism of these developmental stages. By contrast, many changes were observed between the samples harvested at anthesis and postanthesis. The differences de-tected are summarized in Figure 12 (while the absolute values are presented in Supplemental Table 6 online). In the wild type, differences observed between bud and anthesis stages were confined to increases in raffinose, glycerol 3-phosphate, fruc-tose 6-phosphate, Val, Phe, Tyr, and His and a decrease in the level of galactonate-1,4-lactone (Figure 11, white bars). When comparing anthesis and postanthesis stages, a total of 22 of the 73 compounds measured were found at significantly differ-ent levels (see Supplemdiffer-ental Table 6 online). In a few instances, the direction of these changes was reversed from that observed between bud and anthesis. Raffinose, mannose,L-ascorbate, glucose-6-phosphate, maltitol, glycerol-3-phosphate, Leu, Val, Ala, Phe, Trp, isocitrate, Gln, Arg, and putrescine all signifi-cantly decrease at postanthesis to values as low as those recorded at the bud stage (see Supplemental Table 6 online). By contrast, few increases in metabolite level were observed with galactonate-1,4-lactone, gluconate-1,5-lactone, threonate, pyruvate, Asp, and 5-oxoproline being markedly elevated at this time point.
Figure 8. Expression Analysis of Two MADS Box Genes Assessed by qRT-PCR.
(A) Expression kinetics of two MADS box genes (TAG1 and TAGL6) during pollination-dependent (wild-type, black line) and pollination-free (AS-IAA9, gray line) fruit set. Data are expressed as relative values based on bud ovary taken as reference sample set to 1.0.
(B) Comparison of transcript levels between wild-type (white bar) and two independent AS-IAA9 lines AS1 (black bar) and AS2 (gray bar) at three developmental stages. Data are expressed as relative values, based on the reference wild-type samples set to 1.0.
(C) Transcript accumulation during early stage of natural pollination-induced fruit set in the wild type. Relative expression levels for stages 2 to 20 DPA were determined based on the reference value of 1 DPA sample set to 1.0. TAG1, Tomato Agamous 1; TAGL6, Tomato Agamous-like6. Error bars represent6SEof four biological repetitions.
Metabolite Accumulation in Ovary/Fruit Revealed
Considerable Differences between Fertilization-Dependent and -Independent Fruit Set
The scale of change in metabolite contents between the floral bud and anthesis samples was dramatically enhanced in the trans-genic lines (Figure 12, gray bars). These changes included increased levels of glucose, fructose, sucrose, xylose, inositol, gluconate-1,5-lactone, galactonate-1,4-lactone, ribose-5-phosphate, amino acids derived from pyruvate (Leu, Ile, and Ala), oxaloacetate (Asp, Asn, and Lys), and 2-oxoglutarate (Glu and Gln), as well as increased levels of Gly, threonate, and citrate at the anthesis stage. In addition, the shikimate pathway was upregulated in the antisense lines, as evidenced by the higher levels of both Tyr and the large increase in shikimate itself (Figure 12, gray bars; see
Supplemental Table 6 online). The transgenic genotype also displayed large changes with many metabolites returning to levels comparable to those observed at the bud stage. Partic-ularly dramatic changes in the levels of fructose, glucose, ino-sitol, citrate, glycerol 3-phosphate, fructose 6-phosphate, Ala, Asn, Glu, Leu, Tyr, and shikimate can be seen in Figure 12 (gray bars). These combined changes indicate that far fewer of the metabolites displayed significant differences at postanthesis stage in comparison to the control (bud stage).
Fertilization-independent fruit set is characterized by a mas-sive increase in sugars and sugar derivatives at the anthesis stage, with fructose, glucose, sucrose, inositol, and trehalose all being dramatically increased. However, the levels of glucose, inositol, and trehalose fell substantially at subsequent stages.
Figure 9. Expression Analysis of Cell Division–Related Genes Assessed by qRT-PCR.
(A) Expression kinetics of two histone genes (Histone H2A and Histone H3), two ribosomal protein genes (Ribosomal Pt. S26 and Ribosomal Pt. L15), and Expansin 10 gene during pollination-dependent (wild-type, black line) and pollination-free (AS-IAA9; gray line) fruit set. Data are expressed as relative values, based on bud ovary taken as reference sample set to 1.
(B) Comparison of transcript levels between wild-type (white bar) and two independent AS-IAA9 lines AS1 (black bar) and AS2 (gray bar) at three developmental stages. Data are expressed as relative values, based on the reference wild-type sample set to 1.0.
(C) Transcript accumulation during early stage of natural pollination-induced fruit set in the wild type. Relative expression levels for stages 2 to 20 DPA were determined based on the reference 1 DPA sample set to 1.0. Error bars represent6SEof four biological repetitions.
Interestingly, this effect is not mirrored by the levels of fructose 6-phosphate or glycerol 3-phosphate, which exhibited similar dynamic behavior across development in both types of fruit set. Organic acids were also generally present at higher levels throughout development during fertilization-independent fruit set. Notably, citrate was at significantly higher levels in the transgenics during anthesis, as was the ascorbate precursor galactonate-1, 4-lactone; however, both compounds returned to levels observed in the wild type by 4 DPA. Consistent changes in the levels of some amino acids were also observed (Figure 12, black bars). Ala is present at considerably higher levels at both anthesis and postanthesis stages in the transgenic lines, as is Leu, perhaps indicating a higher metabolic rate associated with
fertilization-independent fruit set. Glu and Gln as well as Tyr and shikimate are all at significantly enhanced levels in the AS-IAA9 lines at the bud stage. In addition, the levels of Trp are clearly decreased at all three developmental stages, perhaps indicating an important role for this metabolite in fertilization-dependent fruit set.
Integration of Metabolite and Transcript Profiling Data Obtained during Pollination-Dependent Fruit Set
Given that the determination of metabolite and transcript levels were performed in the exact same samples, we then investigated whether further biological insights were accessible following
Figure 10. (continued).
(A) Expression of hormone-related genes differentially expressed during pollination-dependent fruit set in the wild type (left panel) and pollination-free fruit set in AS-IAA9 (right panel). The most prominent groups are shaded gray. The category called “Others” includes abscisic acid, jamonic acid, and salicylic acid.
(B) to (D) Expression analysis assessed by qRT-PCR of auxin related genes (B), ethylene related genes (C), and GA response-related genes (D). Left panel, expression kinetics of selected hormone-response-related genes during pollination-dependent fruit set in the wild type (black line) and pollination-free fruit set in AS-IAA9 (gray line); data are expressed as relative values, based on the reference bud ovary sample set to 1.0. Middle panel, comparison of transcript levels between wild-type (white bar) and two independent AS-IAA9 lines AS1 (black bar) and AS2 (gray bar) at three developmental stages. Data are expressed as relative values, based on the reference wild-type samples set to 1.0. Right panel, transcript accumulation during early stage of natural pollination-induced fruit set in the wild type. Relative expression levels for stages 2 to 20 DPA were determined based on the reference 1 DPA sample set to 1.0. ARG, auxin-repressed gene; ARP, auxin-regulated gene; ACO1, ACC oxidase1. Error bars represent6SEof four biological repetitions.
Figure 11. Expression Profile of Auxin Response Transcription Factors during Fruit Set.
(A) and (C) Expression profile of ARF (A) and Aux/IAA (C) during pollination-induced fruit set in wild-type lines. Data are expressed as relative values, white bars indicate the relative transcripts level in anthesis stage compared with bud stage, and dark-gray bars indicate level in postanthesis stage compared with anthesis stage.
(B) and (D) Expression profile of ARFs (B) and Aux/IAAs (D) in AS-IAA9 pollination-free fruit set lines. Data are expressed as relative values, which indicate the relative transcript levels in AS-IAA9 lines compared with the wild type at bud stage. Expression analysis was assessed by real-time PCR, and data are expressed as relative value log2ratio.
integration of these data using two different approaches. First, we uploaded the combined data sets into the MapMan software framework to allow full access to our data for further interrogation (http://mapman.mpimp-golm.mpg.de/supplement/wang/). A vi-sualization of the connectivity between functionally classified transcripts and metabolites can be seen in the PageMan (Usadel et al., 2005) representation of Figure 13. To comprehensively investigate this, we compared changes in either the wild type (Figure 13A), the IAA9 antisense lines (Figure 13B), or the ratios
between the two genotypes during each transition and across the whole developmental process (Figure 13C). Interestingly, given that there were proportionally far more changes in the levels of metabolites than transcripts, the general picture is that most metabolite levels do not seem to be directly related to the levels of transcripts associated with their metabolism. However, certain observations, such as the similar trend in the levels of transcripts associated with photosynthesis and the levels of major carbohydrates, suggest that regulatory modules can be
Figure 12. Comparative Analyses of Metabolic Changes Associated with Pollination-Dependent and -Independent Fruit Set.
White bars represent metabolic changes during pollination-dependent fruit set in the wild type. The relative metabolite level of anthesis (An/B) and postanthesis (PA/B) were determined compared with that of wild-type flower bud, which was set to 1.0. Gray bars show the metabolic change during pollination-independent fruit set in AS-IAA9. The relative metabolite level of anthesis and postanthesis were determined compared with that of AS-IAA9 flower bud, which was set to 1.0. Black bars present changes in the metabolite profile in antisense line AS1 compared with wild-type lines during flower-to-fruit transition at three different developmental stages of bud, An (anthesis), and PA (postanthesis). The relative metabolite level was determined compared with that of the wild type at each stage. The dotted lines in the diagrams reflect the normalized control (1.0). The changes are represented as means6SEof determinations of six individual pooled samples. An asterisk indicates changes deemed by the Student’s t test (P < 0.05) to be statistically significant.
Figure 13. Integrated Analysis of Transcriptional and Metabolic Changes.
The left-hand side the figure shows the color-coded results of a Wilcoxon test for a consistent upregulation (blue) or downregulation (red) of individual processes for the whole data set (columns 1 to 3). Average levels of metabolites as well as averages of metabolites per process are also color coded in the same manner (columns 4 to 6). In the panel on the right-hand side, individual processes are magnified, and processes or metabolites are labeled individually. The results of the Wilcoxon test are shown in the first columns. The next columns show individual metabolites or the averages of individual enzyme classes. Processes or enzyme classes not flagged as significant have been omitted for clarity. The three independent graphs represent changes in the wild type (A), IAA9 antisense line (B), and the comparison of these genotypes obtained by dividing the log2transformed values of the
identified within the data set (Figure 13A). By contrast, the IAA9 antisense line displayed clearer correlative changes between transcript and metabolite levels with strong upregulation of transcripts associated with both the photosynthetic apparatus and enzymes of the Calvin cycle.
To further explore correlative changes between metabolites and transcripts, we performed a manual consistency check be-tween those metabolites that display differences in abundance and transcripts associated to the corresponding metabolic pathways (http://mapman.mpimp-golm.mpg.de/supplement/ wang/). There were many cases in which the changes in metab-olites were, at least partially, reflected by changes in the levels of transcripts associated with either their synthesis or degradation. The levels of His, Ala, and Asp provide good examples of such instances (see Supplemental Figures 1 to 3 online). Changes in the levels of His (which increased) were similar to those observed in the transcript level of histidinol-phosphate aminotransferase. In addition, changes documented in Ala levels were similar to those for the transcript levels of Ala glycoxylate transferase. Similarly, Asp displayed a similar upregulation as was observed in one of the isoforms of Asp aminotransferase (see online pathway visualizations and supplemental data for details). In two occasions, further potential transcriptional pathway regulation became apparent following the application of consistency anal-ysis. The first of these is in the pathway of polyamine biosynthe-sis; at the anthesis stage, several S-adenosylmethionine (SAM) decarboxylases as well as several spermidine synthases were downregulated. However, the levels of the spermidine synthase genes were upregulated again in the postanthesis stage, which might explain the lowered levels of putrescine found during this stage. This metabolite is potentially depleted by its flux into spermidine (Figure 13A, right panel), which is in keeping with previous reports of a rise of free spermidine and spermine levels during early tomato fruit development (Egea-Cortines et al., 1993). Furthermore, a depletion of Arg was also identified, which feeds into the polyamine biosynthesis pathway through Arg decarboxylase. The identification of transcriptional control of this pathway also may explain its identification as an overrepre-sented functional category. Secondly, the ascorbate pathway exhibited similar behavior (Figure 13A, right panel). While, ascor-bate levels fell during the transition from anthesis to the postanthesis stage, the levels of its direct precursor, galactonate 1,4-lactone, conversely decreased during anthesis before rising again at postanthesis. Interestingly, the transcript levels of both galactose-dehydrogenase (L-Gal-DH) and GDP-L -galactose-hexose-1-phosphate guanyltransferase were repressed during the anthesis stage withL-Gal-DH recovering during postanthesis and was thus able to account for the change in levels of galactonate 1,4-lactone. Furthermore, several transcripts coding for enzymes potentially involved in the production of glucuronate (an alternative precursor for ascorbate) were upregulated at later developmental stages.
By contrast, there was no correlation between transcript and metabolite changes for some of the metabolites displaying change throughout the fruit set process, such as raffinose and Leu, no consistent transcript responses could be detected, indicating that these metabolites are unlikely to be controlled at the transcriptional level. However, it is important to note that
caution must be taken when interpreting these data since the EU-TOM1 does not offer genome-wide coverage, and several genes, such as galactinol synthases, which catalyze the first step in the pathway of raffinose synthesis, are not represented on the chip. In the case of Leu, the amino acid was not significantly altered during the anthesis stage but increased thereafter. This was somewhat in contrast with the behavior of transcripts associated with its synthesis, for example, the gene encoding 2-isopropylmalate synthase increases constantly during devel-opment, while several branched-chain amino acid transami-nases were downregulated. This likely reflects a multilevel regulation of the branched-chain amino acids and suggests that the control resident in this metabolic network shifts among the constituent enzymes during the developmental period. Integration of Metabolite and Transcript Profiling Data Obtained during Pollination-Independent Fruit Set
We next searched for consistent changes occurring when com-paring the metabolites and transcripts of the transgenic line to that of the wild type. In this instance, not only the major sugars but also the minor sugars altered during development. An interesting example is the increased production of xylose in the antisense line during the later stages of development, which might be controlled by the upregulation of both dual-activity UDP-D-apiose/UDP-D-xylose synthase and UDP-D-xylose syn-thase isoforms in the transgenic line, since these enzymes represent both known synthetic pathways for xylose. As op-posed to many other nucleotide sugar converting enzymes, it is anticipated that these enzymes catalyze irreversible reactions that would likely require tight regulatory control (Reiter, 2008). Another example in which the transgenic situation was some-what different from that of the wild type is that the sharp rise in Leu synthesis, particular at the anthesis stage, could be ex-plained in the antisense line by a concerted upregulation of 3-isopropylmalate dehydrogenase and 2-isopropylmalate syn-thase and a downregulation of Leu degrading enzymes, such as 3-methylcrotonyl-CoA carboxylase. These changes thus cor-roborate the hypothesis we made on the basis of the wild-type data alone, that Leu metabolism is controlled by multilevel regulation.
As observed for pollination-dependent fruit set, there were several changes in transcripts associated with ascorbate metabolism. While the metabolite L-galactono-lactone was increased in the antisense line at anthesis, the transcripts in-volved in the initial stages of the ascorbate synthesis pathway as well as the potential myo-inositol pathway were upregulated in the transgenic lines. However, in this instance, these transcrip-tional changes were not reflected in changing ascorbate levels. Moreover, it was observed that Arg decarboxylases were down-regulated, while spermidine synthases were upregulated at this time point when comparing to the pollination dependent fruit set. Once again, this was not reflected in changes in the metabolites themselves. Figure 13C clearly highlights the differences be-tween the two genotypes, revealing the dramatic upregulation of photosynthesis in the IAA9 transgenics as well as an upregula-tion of glycerate 3-phosphate and the sugars sucrose, glucose, and fructose.
Differences between the Pollination-Dependent and -Independent Fruit Set Are More Discriminative at the Metabolomic Than the Transcriptomic Level
Having performed an integrative analysis, we next decided to compare the discriminatory power of the metabolite and tran-script data sets independently. Principal component analysis of the 480 transcripts whose expression is significantly altered between pollination-dependent and -independent fruit set (Figure 14A) allowed clear discrimination of developmental stages along both the first and second principal component, leading to three separated groups corresponding to bud (light-gray circle), anthe-sis (red and dark-gray circles), and postantheanthe-sis stages (green circle). However, they could not discriminate between the wild type and AS-IAA9 (AS) at bud and postanthesis stages, while at anthesis stage, wild-type (dark-gray circle) and AS-IAA9 (red circle) were clearly separated along the two principal components. It indicates that at the global transcriptional level, there are no significant differences between fertilization-dependent and -independent fruit set but rather specific functional changes that are sufficient to mediate the observed phenotypic responses.
Principle component analysis (PCA) of metabolite data (Figure 14B) allowed clear discrimination both between the two geno-types and between the various stages of fruit set process.
Wild-type samples (gray and black spots) could be discriminated from that of AS-IAA9 (colored spots) along both the first and second principal component, highlighting the global differences in terms of metabolic changes between fertilization-dependent and fertilization-independent fruit set. Along the first principal component, the postanthesis stage separate from the earlier time points in both genotypes. In the wild type, they could not however discriminate anthesis from bud stages (gray circle); by contrast, AS-IAA9 displayed a clear separation of anthesis (red circle) from bud stage (yellow circle), displaying a precocious shift of metabolite levels in AS-IAA9, consistent with the preco-cious development previously observed in these lines. Evalua-tion of the metabolites that made the major contribuEvalua-tion to the discrimination observed in this graph revealed that they were components of cell wall and energy metabolism.
DISCUSSION
This study was designed to harness transcript and metabolite profiling technologies to evaluate changes occurring within the developing ovary and fruits of both wild-type and AS-IAA9 plants to discriminate between fertilization-dependent and -indepen-dent fruit set. The underlying rationale was that such a study
Figure 14. PCA of Transcripts and Metabolites during the Flower-to-Fruit Transition.
Score plot of two principle components of transcripts and metabolites showing that developmental stages as well as different genotypes (wild type and
AS-IAA9) cluster separately.
(A) PCA of the 480 significantly altered transcript levels between AS1 and wild-type lines at all three developmental stages (see Venn diagram in Figure 5). Changes during development allow discrimination of developmental stages, leading to three separated groups corresponding to bud (light-gray circle), anthesis (red and dark-gray circle), and postanthesis stages (green circle).
(B) PCA of metabolite data. Wild-type samples clustered in two groups corresponding to bud/anthesis (gray) and postanthesis (black), while AS-IAA9 samples clustered into three groups corresponding to bud (yellow), anthesis (red), and postanthesis (green).
could provide a valuable resource for understanding how IAA9 exerts its function on gene transcription and subsequently on primary metabolite accumulation and developmental processes. The data published so far on Aux/IAA genes have provided relatively little information concerning their in vivo function and the AS-IAA9 transgenic lines and therefore represent a unique genetic resource in which the IAA9-mediated auxin response is effectively constitutive. It should be noted that this study has been performed with the MicroTom cultivar of tomato. This cultivar is developing into a useful research tool with many studies, documenting that it is essentially equivalent to larger nonmutated cultivars (Obiadalla-Ali et al., 2004a; Dan et al., 2005; Tsugane et al., 2005). The MicroTom background harbors several genetic mutations, including a floral meristem determi-nancy mutation and a brassinosteroid mutation (Meissner et al., 1997). However, given that our previous work showed that the altered fruit set phenotype in the antisense lines was fully reproducible in another genetic background (Wang et al., 2005), the use of MicroTom should not greatly complicate the interpretation of the results presented here.
The nature of the signals and sequence of events that stimulate or limit the processes involved in fruit initiation remain largely unknown, and the genes and mechanisms involved in translating the signal for fruit initiation evoked either by natural pollination or application of hormones, such as auxin and GAs, are still obscure. The vast majority of studies on fruit initiation focused on hormonal regulation and parthenocarpic fruit set (Vivian-Smith and Koltunow, 1999; Pandolfini et al., 2002; Wang et al., 2005; Goetz et al., 2006; Marti et al., 2007; Serrani et al., 2007, 2008; de Jong et al., 2009), though the effect of altering the flavonoid pathway has also been reported to lead to partheno-carpic fruit (Schijlen et al., 2006). However, to date, relatively few studies have used genomic tools to look at the global transcrip-tomic changes associated with flower-to-fruit transition (Vriezen et al., 2008). Other studies implementing a transcriptomic ap-proach focused on the events occurring from 8 d after pollination onward and addressed more specifically either the expansion phase (Lemaire-Chamley et al., 2005) or later fruit development and ripening phases (Alba et al., 2005; Carrari et al., 2006).
Recent work in tomato revealed that downregulation of IAA9 results in the uncoupling of fruit set from pollination and fertili-zation, thus giving rise to seedless (parthenocarpic) fruit. These data indicated that IAA9 is likely to participate within a regulatory complex that negatively regulates fruit initiation (Wang et al., 2005). IAA9 is a member of the Aux/IAA family constituting short-lived transcription factors involved in auxin response (Abel et al., 1995; Gray et al., 2001). The rapid turnover of these proteins allows exquisite control of the auxin response in plants (Dharmasiri and Estelle, 2002; Dreher et al., 2006), with their levels being medi-ated at both transcriptional and posttranslational levels. In this study, we used in situ mRNA hybridization to allow spatial resolution of the expression gradient of IAA9 during fruit orga-nogenesis. This expression was elevated in the ovary and peaked in specific tissues, such as the placenta, funiculus, and the inner layer of integument in the embryo sac. Within the mature flower, a distinctive expression gradient was apparent, and upon successful pollination and fertilization, this gradient was released with IAA9 expression being spread across all
tissues of the developing ovary/fruit. However, in the absence of fertilization, this gradient persisted, providing evidence that the initiation of normal fruit development and enlargement requires the dissipation of the IAA9 mRNA gradient, thus suggesting an important regulatory role for IAA9 in the process of fruit set. Although we have yet to examine IAA9 protein levels, we spec-ulate that prior to pollination and fertilization, IAA9 transcripts (and proteins) are kept at a normal level but that following perception of the fertilization signal the IAA9 protein is rapidly and extensively degraded. While the rapid postfertilization de-cline in transcript levels is in keeping with this hypothesis, further experiments will be necessary to directly delineate the mecha-nism linking the fertilization signal to alterations in IAA9 transcript abundance and ultimately to fruit set and growth. The observa-tion that IAA9 gradients persist in unfertilized ovules indicates that the negative regulation of fruit set by IAA9 is active through-out the flower-to-fruit transition, indicating a central role for the ovule in the mediation of fruit development.
The data documented both here and in our previous work (Wang et al., 2005) provide compelling arguments on the impor-tant role of auxin in the early events of tomato fruit development. It has been recently demonstrated that the interaction between Aux/IAA proteins and ARFs is instrumental in auxin-dependent transcriptional regulation (Tiwari et al., 2004; Dharmasiri et al., 2005). The identity of the exact ARF(s) putatively interacting with IAA9 is currently unknown, but a likely candidate is the protein encoded by the tomato ortholog of Arabidopsis ARF8. Indeed, recent studies have revealed that the parthenocarpic mutant fwf, which harbors a lesion in ARF8, exhibits an uncoupling of fruit set and growth from pollination and fertilization events (Goetz et al., 2006). Notably, ectopic expression in the tomato of an aberrant form of the Arabidopsis ARF8 induces parthenocarpic fruit set (Goetz et al., 2007). Under normal circumstances, pollination is known to induce increases in the levels of both auxin and ethylene in floral organs, correlating with the observation of subsequent growth (O’Neill, 1997; Llop-Tous et al., 2000). It is thus conceivable that in wild-type flowers, an auxin burst in-duced by pollination and fertilization leads to the degradation of IAA9 protein via a proteolytic pathway such as that described for Arabidopsis (Woodward and Bartel, 2005). This scenario would thus be anticipated to abolish the repression of crucial auxin-responsive fruit initiation genes by the ARF-IAA9 protein complex. In the AS-IAA9 lines, however, such a mechanism of repression is clearly impaired. It seems likely that the very low abundance of IAA9 in these lines is not capable of forming the inhibitory complex of ARF-IAA9 and thus leads to constitutive activation of auxin-responsive and fruit initiation genes. The ultimate consequence of this lack of control is fruit set in the absence of fertilization and subsequent parthenocarpy. In support of an active role of auxin during the flower-to-fruit transition, our data reveal that many transcriptional regulators from both ARF and Aux/IAA type undergo dramatic shifts in their expression throughout natural fruit set, suggesting that the coordinated regulation of these genes is integral to this developmental process.
Comprehensive transcriptomic profiling of the flower-to-fruit transition identified a large number of genes that are common to both pollination-induced and pollination-independent fruit set, among which only a small subset are IAA9 dependent. This