Pépite | Etude des manganites Ruddlesden-Popper RExA2-xMnO4 (RE : La, Nd et A : Sr, Ca) en vue de leur application en tant que matériaux d´électrode de pile à combustible à oxide solide (SOFC)
287
0
0
Texte intégral
(2) Thèse de Mónica Viviana Sandoval Rincón, Lille 1, 2017. Doctoral Thesis. Study of Ruddlesden-Popper manganites RExA2-xMnO4 (RE: La, Nd and A: Sr, Ca) with potential application as electrode materials in Solid Oxide Fuel Cells (SOFC). A dissertation submitted to the Universidad Industrial de Santander and Université de Lille 1. To obtain the degree of Doctor in Chemistry (Specialty: Molécules et Matière Condensée). by. Mónica Viviana SANDOVAL RINCÓN Defended on October 13, 2017 Reviewers: Examiners:. Dr. Maria Teresa CALDES, Institut des Matériaux Jean ROUXEL Dr. Liliana MOGNI, Centro Atómico Bariloche - CNEA Dr. Martha Eugenia NIÑO, Universidad Industrial de Santander Dr. Fabian Alirio RÍOS, Universidad Industrial de Santander. Thesis directors: Dr. Gilles GAUTHIER Dr. Pascal ROUSSEL Co-director: Dr. Caroline PIROVANO. © 2017 Tous droits réservés.. lilliad.univ-lille.fr.
(3) Thèse de Mónica Viviana Sandoval Rincón, Lille 1, 2017. ACKNOWLEDGEMENTS. I wish to express my deep gratitude to my advisor Profe Gilles Gauthier for giving me the opportunity to realize this thesis by his side. Certainly, his knowledge, support, kindness and fine sense of humor made me grow professionally and allowed me to love even more the chemistry. I also deeply thank Caroline Pirovano and Pascal Roussel for their contributions and to make their laboratory available to me, as well as for their patience with my spoken French.. I also thank those who provided invaluable technical assistance: Florence Porcher, Nora Djelal, Laurence Burylo, Edouard Capoen, Romain Jooris and Olivier Gardoll. I also need to mention "my little students" Maria Alejandra Murcia, Andrea Prada, Silvia Durán, Silvia Flórez, Carolina Cardenas, Giovanny Rodriguez, Jose David García and Santiago Palencia who helped me enormously in experimental development.. I appreciate the collaboration of the Grupo de Investigación en Tecnologías de Valorización de Residuos y Fuentes Agrícolas e Industriales para la Sustentabilidad Energética (INTERFASE), Unité de Catalyse et Chimie du Solide (UCCS), Laboratoire Léon Brillouin (LLB-CEA) and Laboratorio de Difracción de Rayos X (Parque Tecnológico Guatiguará-UIS) which was fundamental for the experimental development of this thesis.. I thank COLCIENCIAS for my Ph.D. scholarship and French Government for the “Eiffel excellence scholarship". I also thank the financial support of the Vicerrectoría de Investigación y Extensión of the Universidad Industrial de Santander (Projects 1333 and 1854), of COLCIENCIAS (Project 110265842833 - contract 038-2015) and of Chevreul institute (FR 2638), Ministère de l’Enseignement Supérieur et de la Recherche, Région Hauts de France and FEDER.. © 2017 Tous droits réservés.. lilliad.univ-lille.fr.
(4) Thèse de Mónica Viviana Sandoval Rincón, Lille 1, 2017. Also, I want to thank my friends July, Marito, Jose Luis, Lina, Oscar, Silvia, Mimi, Zulma, Sebastian, Carolina, Margarita, Nicolas and Lila who shared with me so many nice moments during these years, and especially to Coki who enjoyed with me the stay in France (also cooked).. I heartfelt thanks goes to my mami, my papi, Kelly and David, and especially thanks to my beloved husband Camilo, for his love and support.. Finally, I would like to thank all who contributed to the realization of this thesis.. Moni. © 2017 Tous droits réservés.. lilliad.univ-lille.fr.
(5) Thèse de Mónica Viviana Sandoval Rincón, Lille 1, 2017. RESUME. TITRE : Etude des manganites Ruddlesden-Popper RExA2-xMnO4±δ (RE : La, Nd et A : Sr, Ca) en vue de leur application en tant que matériaux d´électrode de pile à combustible à oxide solide (SOFC). AUTEUR : Mónica Viviana SANDOVAL RINCÓN. MOTS-CLEFS : SOFC symétrique, Ruddlesden-Popper, Manganite, Diffraction de Rayons X sur poudre, Diffraction de Neutrons sur poudre, Conductivité électrique, Réactivité, Spectroscopie d'Impédance Electrochimique.. DESCRIPTION : Les manganites de type Ruddlesden Popper RExA2-xMnO4 (RE : La, Nd et A : Sr, Ca) ont été étudiées en tant que possibles matériaux d'électrode pour piles à combustibles à oxyde solide symétriques. Trois séries de composés La xSr2-xMnO4±δ (x=0.25, 0.4, 0.5 et 0.6), NdxSr2-xMnO4±δ (x=0.4 et 0.5) et NdxCa2-xMnO4±δ (x=0.25, 0.4 et 0.5) ont été synthétisées pures avec succès. Les matériaux RE xSr2-xMnO4±δ avec RE : La, Nd sont stables sous atmosphère réductrice et présentent des Coefficients d'Expansion Thermique (TEC) compatibles avec ceux des électrolytes. L'étude In situ par Diffraction de Neutrons sur poudre à haute température du composé La0.5Sr1.5MnO4±δ (L5S15M), sous flux d'hydrogène, révèle la formation de lacunes d'oxygène sur les sites équatoriaux de la couche pérovskite. Des valeurs élevées de conductivité électrique ont été obtenues (35.6 S cm −1 sous air et 1.9 S cm−1 sous H2/Ar). Les propriétés électrochimiques de l'électrode L5S15M ont été examinées par Spectroscopie d'Impédance Electrochimique (EIS). L'influence sur les performances électrochimiques à la fois de la température de frittage et de la composition de l'électrode (L5S15M pur ou composite L5S15M:GDC) a été étudiée dans les deux atmosphères, cathodiques et anodiques. Du côté de la réduction de l'oxygène, le transfert d'électrons entre l'électrode et l'oxygène, et l'incorporation des. © 2017 Tous droits réservés.. lilliad.univ-lille.fr.
(6) Thèse de Mónica Viviana Sandoval Rincón, Lille 1, 2017. ions oxygène dans l'électrode sont les principales étapes limitantes pour des électrodes frittées à 1150 et 1200 °C. L'augmentation de la température de frittage à 1250 °C conduit à l'accumulation de Sr à l'interface GDC/YSZ et la dégradation consécutive de la cellule. L'électrode composite n'apporte aucune amélioration. Pour l'oxydation de l'hydrogène, trois étapes limitantes ont été identifiées : le transfert de charge à l'interface électrode/électrolyte, l'adsorption dissociative de l'hydrogène et la diffusion de surface. Pour chacune des électrodes, le processus de diffusion de surface représente la contribution majoritaire à la résistance de polarisation totale. Le meilleur compromis entre température de frittage et composition est obtenu pour une électrode de L5S15M pur frittée à 1150 °C. Finalement, les résultats extraits des mesures par EIS ont permis de comprendre la nature des processus mis en place au sein de l'électrode, révélant que le comportement électrochimique de La0.5Sr1.5MnO4±δ pouvait être amélioré par la modification de la surface de l'électrode.. © 2017 Tous droits réservés.. lilliad.univ-lille.fr.
(7) Thèse de Mónica Viviana Sandoval Rincón, Lille 1, 2017. ABSTRACT. TITLE: Study of Ruddlesden-Popper manganites RExA2-xMnO4±δ (RE: La, Nd and A: Sr, Ca) with potential application as electrode materials in Solid Oxide Fuel Cells (SOFC).. AUTHOR: MÓNICA VIVIANA SANDOVAL RINCÓN. KEYWORDS: Symmetrical SOFC, Ruddlesden-Popper, Manganite, Powder X-ray diffraction,. Neutron. powder. diffraction,. Electrical. conductivity,. Reactivity,. Electrochemical Impedance Spectroscopy.. DESCRIPTION: The Ruddlesden Popper manganites RExA2-xMnO4 (RE: La, Nd and A: Sr, Ca) have been studied as possible electrode materials for symmetrical Solid Oxide Fuel Cells. Three series of compounds LaxSr2-xMnO4±δ (x=0.25, 0.4, 0.5 and 0.6), NdxSr2xMnO4±δ. (x=0.4 and 0.5) and NdxCa2-xMnO4±δ (x=0.25, 0.4 and 0.5) were. successfully synthesized as single phases. The RExSr2-xMnO4±δ materials with RE: La, Nd are stable under reducing atmosphere with electrolyte-compatible Thermal Expansion Coefficients (TECs). In situ high temperature neutron powder diffraction study of La0.5Sr1.5MnO4±δ (L5S15M), under flowing hydrogen, reveals formation of oxide-ion vacancies on the equatorial sites of the perovskite layer. High electrical conductivities were obtained (35.6 S cm−1 in air and 1.9 S cm−1 in H2/Ar). Electrochemical. properties. of. L5S15M. electrode. were. investigated. by. Electrochemical Impedance Spectroscopy (EIS). The influence of both sintering temperature and electrode composition (pure L5S15M or L5S15M:GDC composites) on the electrochemical performance was studied in both cathode and anode atmosphere. For oxygen reduction, the electron transfer between the electrode and oxygen, and the incorporation of oxygen ions into the electrode are the main ratelimiting steps for electrodes sintered at 1150 and 1200°C. Increasing the sintering. © 2017 Tous droits réservés.. lilliad.univ-lille.fr.
(8) Thèse de Mónica Viviana Sandoval Rincón, Lille 1, 2017. temperature to 1250°C leads to Sr accumulation at the GDC/YSZ interface and subsequent cell degradation. The composite electrode does not show any improvement. For hydrogen oxidation, three limiting steps are identified: charge transfer at the electrode/electrolyte interface, dissociative adsorption of hydrogen and surface diffusion. For all electrodes, the surface diffusion process represents the highest contribution to the total polarization resistance. The best compromise between sintering temperature and composition is reached for pure L5S15M electrode sintered at 1150 °C. Finally, the results extracted from EIS measurements allowed understanding the nature of processes taking place within the electrode, proposing that the electrochemical behavior of La0.5Sr1.5MnO4±δ could be improved with modification of the electrode’s surface.. © 2017 Tous droits réservés.. lilliad.univ-lille.fr.
(9) Thèse de Mónica Viviana Sandoval Rincón, Lille 1, 2017. RESUMEN. TÍTULO: Estudio de las manganitas Ruddlesden-Popper RExA2-xMnO4±δ (RE: La, Nd y A: Sr, Ca) con potencial aplicación como materiales de electrodo en Celdas de Combustible de Óxido Sólido (SOFC).. AUTOR: MÓNICA VIVIANA SANDOVAL RINCÓN. PALABRAS CLAVE: SOFC simétrica, Ruddlesden-Popper, Manganita, Difracción de Rayos-X de polvo, Difracción de Neutrones, Conductividad Eléctrica, Reactividad, Espectroscopía de Impedancia Electroquímica.. DESCRIPCIÓN: Las manganitas Ruddlesden Popper RExA2-xMnO4 (RE: La, Nd y A: Sr, Ca) han sido estudiadas como posibles materiales de electrodo para Celdas de Combustible de Óxido Sólido simétricas. Tres series de compuestos LaxSr2-xMnO4±δ (x=0.25, 0.4, 0.5 y 0.6), NdxSr2-xMnO4±δ (x=0.4 y 0.5) y NdxCa2-xMnO4±δ (x=0.25, 0.4 and 0.5) fueron sintetizadas satisfactoriamente como fases puras. Los materiales LaxSr2xMnO4±δ. con RE: La, Nd son estables en atmósfera reductora, presentando. Coeficientes de Expansión Térmica (TECs) compatibles con los electrolitos. El estudio en atmósfera reductora por Difracción de Neutrones in-situ a alta temperatura del material La0.5Sr1.5MnO4±δ (L5S15M), reveló la formación de vacancias de iones óxido en los sitios ecuatoriales de la capa perovskita. Para este material se obtuvo también una alta conductividad eléctrica (35.6 S cm−1 en aire y 1.9 S cm−1 en H2/Ar). Las propiedades electroquímicas del electrodo L5S15M fueron investigadas por Espectroscopía de Impedancia Electroquímica (EIS). La influencia tanto de la temperatura de sinterización como de la composición del electrodo (L5S15M puro o L5S15M:GDC composites) sobre el rendimiento electroquímico fue estudiada en atmósfera oxidante y reductora. Para la reducción de oxígeno, la. © 2017 Tous droits réservés.. lilliad.univ-lille.fr.
(10) Thèse de Mónica Viviana Sandoval Rincón, Lille 1, 2017. transferencia de electrones entre el electrodo y el oxígeno, y la incorporación de iones oxígeno dentro del electrodo, son los principales pasos limitantes de la velocidad para los electrodos sinterizados a 1150 y 1200 °C. El incremento de la temperatura de sinterizado hasta 1250 °C, condujo a la acumulación de Sr en la interfase GDC/YSZ y subsecuente degradación de la celda. El electrodo composite no presenta ninguna mejora del rendimiento. Para la oxidación de hidrógeno, se identificaron tres pasos limitantes: transferencia de carga a la interfase electrodo/electrolito, adsorción disociativa de hidrógeno y difusión superficial. Para todos los electrodos, la difusión superficial representa la mayor contribución a la resistencia de polarización total. La mejor relación entre la temperatura de sinterizado y la composición fue lograda para el electrodo puro L5S15M sinterizado a 1150 °C. Finalmente, los resultados extraídos desde las medidas de EIS, permitieron entender la naturaleza de los procesos que tienen lugar dentro del electrodo, proponiendo que el comportamiento electroquímico de La0.5Sr1.5MnO4±δ podría ser mejorado con la modificación de la superficie del electrodo.. © 2017 Tous droits réservés.. lilliad.univ-lille.fr.
(11) Thèse de Mónica Viviana Sandoval Rincón, Lille 1, 2017. TABLE OF CONTENTS. INTRODUCTION…………………………………………………………………………25 CHAPTER 1: STATE OF THE ART ...................................................................... 29 1.1. INTRODUCTION ...................................................................................... 30 Energetic and enviromental context ................................................... 30 Fuel cells and the hydrogen economy ................................................ 31. 1.2. SOLID OXIDE FUEL CELL (SOFC) ......................................................... 32 Thermodynamic principles ................................................................. 33. 1.3. SOFC COMPONENTS ............................................................................. 38 Electrolyte .......................................................................................... 38 Cathode.............................................................................................. 39 Anode ................................................................................................. 49. 1.4. SYMMETRICAL CELLS............................................................................ 57. 1.5. REFERENCES ......................................................................................... 61. CHAPTER 2: PRELIMINARY STUDY OF THE RUDDLESDEN-POPPER RExA2xMnO4±δ. FAMILY (RE: La, Nd AND A: Sr, Ca) ..................................................... 74. 2.1. INTRODUCTION ...................................................................................... 75. 2.2. SYNTHESIS AND CHARACTERIZATION................................................ 78 Experimental section .......................................................................... 78 Results ............................................................................................... 83. 2.3. STABILITY IN REDUCING ATMOSPHERE ............................................. 99 Experimental section .......................................................................... 99 Results ............................................................................................... 99. 2.4. STRUCTURAL BEHAVIOR OF THE RExSr2-xMnO4±δ (RE: La, Nd) SERIES. DURING REDOX CYCLING ............................................................................. 115 Experimental section ........................................................................ 115 Results ............................................................................................. 117. © 2017 Tous droits réservés.. lilliad.univ-lille.fr.
(12) Thèse de Mónica Viviana Sandoval Rincón, Lille 1, 2017. 2.5. COMPATIBILITY. BETWEEN. ELECTRODE. AND. ELECTROLYTE. MATERIALS ..................................................................................................... 133 2.6. ELECTRICAL CONDUCTIVITY OF THE RExSr2-xMnO4±δ (RE: La, Nd). SERIES ............................................................................................................ 139 Experimental section ........................................................................ 140 Results ............................................................................................. 143 2.7. CONCLUSIONS ..................................................................................... 150. 2.8. REFERENCES ....................................................................................... 153. CHAPTER 3: PERFORMANCE OF La0.5Sr1.5MnO4±δ AS ELECTRODE MATERIAL FOR SYMMETRICAL SOLID OXIDE FUEL CELL ............................................. 160 3.1. EIS AS A POWERFULL TOOL FOR SOFC DIAGNOSIS ....................... 161. 3.2. CELL PREPARATION FOR EIS MEASUREMENTS .............................. 165 Conditions of symmetrical cell preparation ....................................... 165 EIS - Experimental conditions for EIS measurements ...................... 175. 3.3. ELECTROCHEMICAL PROPERTIES IN AIR (OXYGEN REDUCTION) 176 Pure L5S15M - Influence of sintering temperature ........................... 177 Use of a L5S15M-GDC composite ................................................... 199 Influence of the composite composition (GDC amount) ................... 206. 3.4. ELECTROCHEMICAL PROPERTIES IN REDUCING ATMOSPHERE .. 209 Influence of the sintering temperature .............................................. 210 Use of a L5S15M-GDC50 Composite .............................................. 226. 3.5. CONCLUSIONS ..................................................................................... 235. 3.6. REFERENCES ....................................................................................... 238. GENERAL CONCLUSION ................................................................................. 247 DIVULGATION …………………………………………………………………………251 ANNEXES ………………………………………………………………………………254. © 2017 Tous droits réservés.. lilliad.univ-lille.fr.
(13) Thèse de Mónica Viviana Sandoval Rincón, Lille 1, 2017. LIST OF FIGURES. CHAPTER 1 Figure 1. Electricity generation by fuel (a) in the world and (b) in Colombia. ......... 30 Figure 2. Scheme of a Solid Oxide Fuel Cell (SOFC).. .......................................... 33 Figure 3. Typical polarization curve describing the relationship between cell voltage and current density. ............................................................................................... 35 Figure 4. Diagram showing the TPB improvement, due to the mobility of both the oxide ions and the charge carriers. (a) Electronic conductor and (b) mixed conductor. .............................................................................................................. 41 Figure 5. ABO3 perovskite structure ....................................................................... 42 Figure 6. Temperature dependence of the electrical conductivity σ of La1−xSrxMnO3+δ in Arrhenius coordinates.. ............................................................. 43 Figure 7. Impedance curves of the O2 reduction reaction on LSM electrode as a function of dc bias at different temperatures in air.. ............................................... 44 Figure 8. EDX diffusion profiles on (a, b) LSCF/YSZ and (c, d) LSCF/GDC showing the Sr segregation.................................................................................................. 46 Figure 9. Ruddlesden-Popper unit cells for (a) n = 1 (RPn1), (b) n = 2 (RPn2), and (c) n = ∞ (perovskite) structures. ............................................................................ 47 Figure 10. Model illustrating the redox mechanism in Ni/YSZ cermets (a) the sintered state, (b) the short-term reduced state, (c) the long-term reduced state, and (d) the reoxidized state.................................................................................... 52 Figure 11. The Ni/YSZ anode fuel cell image and scanning electron microscopy (SEM) micrograph/ EDX mapping of the (a) Ni/YSZ surface; (b) coke that is deposited on the Ni/YSZ surface; and (c) coked spot on the Ni/YSZ surface after stability test in CH4. ................................................................................................ 53. © 2017 Tous droits réservés.. lilliad.univ-lille.fr.
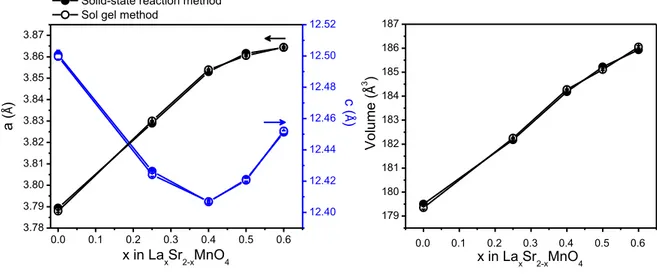
(14) Thèse de Mónica Viviana Sandoval Rincón, Lille 1, 2017. CHAPTER 2 Figure 12. Crystal structure of A2MnO4, depicting atomic positions and bonds. .... 76 Figure 13. Synthesis process by sol gel method. ................................................... 81 Figure 14. Iodometric titration assembly. ............................................................... 82 Figure 15. XRD patterns of LaxSr2-xMnO4±δ (x=0, 0.25, 0.4, 0.5, 0.6, 0.7) after synthesis in air. ...................................................................................................... 84 Figure 16. Evolution of cell parameters of LaxSr2-xMnO4±δ (x= 0, 0.25, 0.4, 0.5, 0.6) synthesized by solid state reaction. ....................................................................... 85 Figure 17. Evolution of cell parameters of LaxSr2-xMnO4±δ (x= 0.25, 0.4, 0.5, 0.6) synthesized by sol gel and solid-state method. ...................................................... 87 Figure 18. XRD patterns of NdxSr2-xMnO4±δ (x= 0.25, 0.4, 0.5, 0.6) after synthesis in air. In inset, zoom on Nd2O3 impurity in x=0.6 sample........................................ 88 Figure 19. Evolution of cell parameters of LaxSr2-xMnO4±δ and NdxSr2-xMnO4±δ (x= 0.25, 0.4, 0.5, 0.6). ................................................................................................. 90 Figure 20. XRD patterns of LaxCa2-xMnO4±δ (x= 0.15, 0.25, 0.5) after synthesis in air. In inset, zoom on (1) CaCO3 and (2) La2O3 impurities in x=0.15 and 0.25 compositions, respectively. .................................................................................... 92 Figure 21. View along [001] of (a) Ca2MnO4 (I41/acd) and (b) La0.25Ca1.75MnO4 (I4/mmm). .............................................................................................................. 93 Figure 22. XRD patterns of NdxCa2-xMnO4±δ (x= 0.25, 0.4, 0.5, 0.6) after synthesis in air. In inset, zoom on x=0.6. ............................................................................... 95 Figure 23. Evolution of cell parameters of NdxCa2-xMnO4±δ (x= 0, 0.25, 0.4, 0.5). For x=0 the parameters were taken from [52]. ....................................................... 97 Figure 24. XRD patterns of LaxSr2-xMnO4-δ (x=0, 0.25, 0.4, 0.5, 0.6) after reduction at 850 °C in diluted hydrogen. Except for x=0, all compositions are stable. ......... 100 Figure 25. Graphical result of Rietveld refinement of x=0.5 after reduction in 3% H2/Ar at 850 °C for 16 h. ...................................................................................... 101 Figure 26. Evolution of the cell parameters of LaxSr2-xMnO4-δ (x=0, 0.25, 0.4, 0.5, 0.6) (•) as-synthesized in air and (•) reduced in 3% H2/Ar at 850°C for 16 h. ...... 102. © 2017 Tous droits réservés.. lilliad.univ-lille.fr.
(15) Thèse de Mónica Viviana Sandoval Rincón, Lille 1, 2017. Figure 27. Thermogravimetric analysis (TG) in 3% H2/N2 of LaxSr2-xMnO4±δ (x=0, 0.25, 0.4, 0.5, 0.6). ............................................................................................... 103 Figure 28. XRD patterns of LaxSr2-xMnO4±δ (x=0, 0.25, 0.4, 0.5, 0.6) after TGA in 3% H2/N2. ............................................................................................................. 106 Figure 29. XRD patterns of NdxSr2-xMnO4-δ (x= 0.25, 0.4, 0.5, 0.6) after reduction at 850 °C in 3% H2/Ar. ............................................................................................. 107 Figure 30. Evolution of cell parameters of NdxSr2-xMnO4±δ (x=0, 0.25, 0.4, 0.5, 0.6) (•) as-synthesized in air and (•) reduced in 3% H2/Ar at 850°C for 16 h. For x=0.6, the phase is pure after reduction process. ........................................................... 109 Figure 31. Thermogravimetric analysis (TG) in 3% H2/N2 of Nd0.5Sr1.5MnO4±δ in comparison to La0.5Sr1.5MnO4±δ............................................................................ 110 Figure 32. XRD pattern of Nd0.5Sr1.5MnO4±δ after TGA in 3% H2/N2. ................... 112 Figure 33. XRD patterns of NdxCa2-xMnO4-δ (x= 0.25, 0.4, 0.5, 0.6) after reduction at 850 °C. ............................................................................................................. 113 Figure 34. In situ HT-XRD patterns of as-prepared La0.5Sr1.5MnO4±δ (x=0.25) from Room Temperature to 800 °C in air (grey), 3% H2/N2 (red) then air again (blue). 118 Figure 36. In situ HT-XRD patterns of as-prepared LaxSr2-xMnO4±δ (x=0.5) from Room Temperature to 800 °C in air (grey), 3% H2/N2 (red) then air again (blue). 118 Figure 37. In situ HT-XRD patterns of as-prepared LaxSr2-xMnO4±δ (x=0.6) from Room Temperature to 800 °C in air (grey), 3% H2/N2 (red) then air again (blue). 119 Figure 38. Thermogravimetric profiles for LaxSr2-xMnO4±δ (x=0.25 and 0.5) in air. ............................................................................................................................. 120 Figure 39. Evolution of the cell parameters during redox cycling for La xSr2-xMnO4±δ (x=0.25, 0.4, 0.5, 0.6) ........................................................................................... 120 Figure 40. In situ HT-XRD patterns of as-prepared Nd0.5Sr1.5MnO4±δ from Room Temperature to 800 °C in air (grey), 3% H2/N2 (red) then air again (cyan). .......... 125 Figure 41. Evolution of the cell parameters during redox cycling for Nd0.5Sr1.5MnO4±δ .................................................................................................. 125 Figure 42. Neutron diffraction pattern for La0.5Sr1.5MnO4±δ at 850°C in 3% H2/Ar. ............................................................................................................................. 127. © 2017 Tous droits réservés.. lilliad.univ-lille.fr.
(16) Thèse de Mónica Viviana Sandoval Rincón, Lille 1, 2017. Figure 43. Occupancy factors of the equatorial oxygen sites (O1) of La0.5Sr1.5MnO4±δ upon heating in 3% H2/Ar, refined from neutron data under H2 flow. ..................................................................................................................... 129 Figure 44. Variation of (a) Mn-O1 and (b) Mn-O2 bond lengths in La0.5Sr1.5MnO4±δ during reduction. .................................................................................................. 130 Figure 45. Variation of (a) La/Sr-O1 and La/Sr-O2 bond lengths in La0.5Sr1.5MnO4±δ during reduction. .................................................................................................. 131 Figure 46. Anisotropic displacement parameters U11, U22 and U33 for O1 in La0.5Sr1.5MnO4±δ upon heating in 3% H2/Ar. ......................................................... 132 Figure 47. XRD patterns after reactivity test of La0.5Sr1.5MnO4±δ in air with (a) YSZ at 1200 °C, (b) LSGM at 900 °C, (c) GDC at 1200, 1250 and 1300 °C. ............... 135 Figure 48. XRD patterns after reactivity test of Nd0.5Sr1.5MnO4±δ in air with (a) YSZ at (b) GDC at 1200 °C.......................................................................................... 137 Figure 49. XRD patterns before and after reactivity test of La0.5Sr1.5MnO4±δ with GDC in diluted hydrogen at 850 °C. ..................................................................... 138 Figure 50. Schematic representation of the sample for four-point probe DC measurement of electrical conductivity. ............................................................... 141 Figure 51. Experimental measuring device for four-point probe DC measurement of electrical conductivity. .......................................................................................... 142 Figure 52. Thermal stability of La0.5Sr1.5MnO4±δ. .................................................. 144 Figure 53. Dilatometric curve of La0.5Sr1.5MnO4±δ prepared by solid state reaction. The derivative curve (red) was normalized for easier comparison. ...................... 144 Figure 54. Dilatometric curves of LaxSr2-xMnO4±δ prepared by sol-gel method… . 146 Figure 55. Arrhenius plot of the total conductivity of LaxSr2-xMnO4±δ (x=0.25, 0.4, 0.5, 0.6) in air and 3% H2/Ar. ............................................................................... 147. CHAPTER 3 Figure 56. (a) Three roll mill and (b) screen printer (DEK 248). ........................... 167 Figure 57. a) Thermogravimetric analysis of GDC ink and deduced heat-treatment using b) slow ramp (40 °C/h) or c) fast ramp (300 °C/h). ..................................... 169. © 2017 Tous droits réservés.. lilliad.univ-lille.fr.
(17) Thèse de Mónica Viviana Sandoval Rincón, Lille 1, 2017. Figure 58. SEM micrographs of GDC surface sintered using a) slow ramp (40 °C/h) and b) fast ramp (300 °C/h). ................................................................................ 170 Figure 59. Dilatometric curves in air of GDC without and with pre-sintering treatment at different temperatures for 3 h. .......................................................... 171 Figure 60. SEM micrographs of GDC surface prepared using GDC pre-sintering at a) 900 °C, b) 1000 °C and c) 1100 °C. ................................................................. 172 Figure 61. SEM images of the cross-section of the GDC/YSZ interface, sintered at 1250 °C using GDC pre-sintering treatment at 1100 °C....................................... 173 Figure 62. Dilatometric curves of (a) L5S15M and (b) L5S15M-GDC50 composite. ............................................................................................................................. 174 Figure 63. Sintering process used for the electrode formation. ............................ 175 Figure 64. Experimental set-up for EIS measurements of symmetric cells. ......... 175 Figure 65. Impedance spectra measured in air between 835 °C and 600 °C for L5S15M electrodes sintered at 1150, 1200 or 1250 °C for 3 hours. .................... 178 Figure 66. Impedance spectrum at 800 °C for L5S15M electrode sintered at 1150 °C and measured in air. ....................................................................................... 179 Figure 67. Arrhenius plot of the (a) area specific resistance (ASR) and (b) individual resistances (limiting steps) for L5S15M electrode prepared at 1150 °C and measured in air. ............................................................................................ 181 Figure 68. Arrhenius plot of the (a) relaxation frequencies and (b) equivalent capacitances for L5S15M electrode prepared at 1150 °C and measured in air. .. 182 Figure 69. SEM image and EDXS concentration mapping of the main elements in the cross-section of Au/L5S15M/GDC/YSZ/GDC/L5S15M/Au cell sintered at 1150 °C. ........................................................................................................................ 184 Figure 70. Impedance spectrum of L5S15M electrode sintered at 1200 °C and measured in air at 800 °C. ................................................................................... 185 Figure 71. Impedance spectra for LSCF sintered at (a) 850 and (b) 1000°C measured at 800°C in air.. ................................................................................... 186. © 2017 Tous droits réservés.. lilliad.univ-lille.fr.
(18) Thèse de Mónica Viviana Sandoval Rincón, Lille 1, 2017. Figure 72. Arrhenius plot of the (a) individual resistances (limiting steps) and (b) area specific resistance (ASR) for L5S15M electrode sintered at 1200 °C and measured in air. ................................................................................................... 187 Figure 73. Arrhenius plot of the (a) relaxation frequencies and (b) equivalent capacitances for L5S15M electrode sintered at 1200 °C and measured in air. .... 188 Figure 74. SEM image and EDXS concentration mapping of the main elements in the cross-section of Au/L5S15M/GDC/YSZ/GDC/L5S15M/Au cell sintered at 1200 °C. ........................................................................................................................ 189 Figure 75. Impedance spectra for L5S15M electrode sintered at 1250 °C and measured in air at (a) 800 °C and (b) 600 °C.. ..................................................... 191 Figure 76. Arrhenius plot of the (a) area specific resistance (ASR) and (b) individual resistances (limiting steps) for L5S15M electrode sintered at 1250 °C and measured in air. ............................................................................................ 191 Figure 77. Arrhenius plot of the (a) relaxation frequencies and (b) equivalent capacitances for L5S15M electrode prepared at 1250 °C and measured in air. .. 193 Figure 78. SEM image and EDXS concentration mapping of the main elements in the cross-section of Au/L5S15M/GDC/YSZ/GDC/L5S15M/Au cell sintered at 1250 °C (before EIS test). ............................................................................................. 195 Figure 79. SEM and EDXS images along the cross-section of Au/L5S15M/GDC/YSZ/GDC/L5S15M/Au cell sintered at 1250 °C. ...................... 196 Figure 80. Arrhenius plots of the serial resistance (Rs) for the L5S15M/GDC/YSZ/GDC/L5S15M and Pt/GDC/YSZ/GDC/Pt cells measured in air. ............................................................................................................................. 198 Figure 81. Impedance spectra measured in air at 800 °C for L5S15M and L5S15MGDC50 cathodes sintered at 1150 °C. ................................................................. 200 Figure 82. Arrhenius plot of the (a) individual resistances (limiting steps) and (b) area specific resistance (ASR) for L5S15M and L5S15M-GDC50 electrodes (1150 °C) under air. ....................................................................................................... 201 Figure 83. Arrhenius plot of the (a) relaxation frequencies and (b) equivalent capacitances for L5S15M and L5S15M-GDC50 composite sintered al 1150 °C. 202. © 2017 Tous droits réservés.. lilliad.univ-lille.fr.
(19) Thèse de Mónica Viviana Sandoval Rincón, Lille 1, 2017. Figure 84. Impedance spectra measured in air at 800 °C for L5S15M and L5S15MGDC50 electrode sintered at 1200 °C.................................................................. 204 Figure 85. Arrhenius plots of the (a) individual resistances (limiting steps) and (b) area specific resistance (ASR) for L5S15M and L5S15M-GDC50 electrodes (1200 °C) in air. .............................................................................................................. 205 Figure 86. Impedance spectra measured in air at 800 °C for the different L5S15Mbased cathodes prepared at 1200 °C. ................................................................. 207 Figure 87. Area specific resistance (ASR) for L5S15M and composite electrodes (1200 °C) under air. (a) temperature dependence and (b) GDC amount dependence. ........................................................................................................ 208 Figure 88. Impedance spectra measured in H2 (3% H2O) at 700 °C for L5S15M electrode sintered at (a) 1150 and (b) 1200 °C.. .................................................. 211 Figure 89. Arrhenius plots of ASR for L5S15M electrodes sintered at 1150 and 1200 °C measured in wet H2 (3% H2O)................................................................ 213 Figure 90. Impedance spectra of (a) Ni/YSZ anodes measured at 1000 °C and (b) LSTM4646 anode measured at 810 and 760 °C in wet H2……………………... . . 214 Figure 91. (a) Relaxation frequencies and (b) equivalent capacitances of the limiting steps for L5S15M electrodes sintered at 1150 and 1200 °C and measured in H2 (3% H2O). .................................................................................................... 215 Figure 92. Arrhenius plots of individual resistances (limiting steps) for L5S15M electrode sintered at (a) 1150 °C and (b) 1200 °C and measured in H2-3% H2O.215 Figure 93. Impedance spectra measured in H2 (3% H2O) and 3 % H2/Ar (3% H2O) at 800 °C for L5S15M electrode sintered at (a) 1150 °C and (b) 1200 °C.. ......... 216 Figure 94. Relaxation frequencies for L5S15M electrodes sintered at (a) 1150 °C and (b) 1200 °C measured in wet H2 (filled symbols) and 3 % H2/Ar (empty symbols). ............................................................................................................. 217 Figure 95. Elementary kinetic scenarios at a Ni/YSZ TPB. (a) Spillover of hydrogen from the Ni surface onto an oxygen ion or hydroxyl ion on the YSZ surface. (b) Charge-transfer reactions with and without spillover of oxygen ions from the YSZ. © 2017 Tous droits réservés.. lilliad.univ-lille.fr.
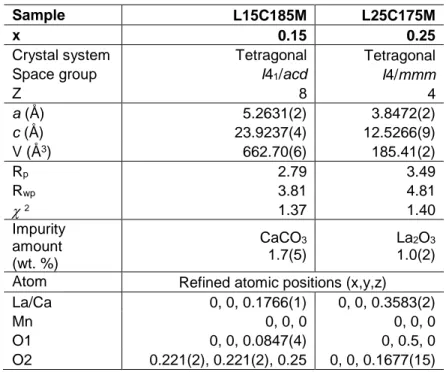
(20) Thèse de Mónica Viviana Sandoval Rincón, Lille 1, 2017. surface to the Ni surface. (c) Hydroxyl spillover from the YSZ surface to the Ni surface.. ............................................................................................................... 219 Figure 96. Arrhenius plots of high frequency resistance (RHF) for L5S15M electrode sintered at 1200 °C and measured in wet H2 (filled symbols) and 3 % H2/Ar (empty symbols). ............................................................................................................. 221 Figure 97. Arrhenius plots of medium frequency resistance RMF for L5S15M electrode sintered at (a) 1150 °C and (b) 1200 °C and measured in wet H2 (filled symbols) and wet 3 % H2/Ar (empty symbols). .................................................... 223 Figure 98. Arrhenius plots of low frequency resistance (RLF) for L5S15M electrode sintered at (a) 1150 °C and (b) 1200 °C and measured in wet H2 (filled symbols) and wet 3 % H2/Ar (empty symbols). ................................................................... 225 Figure 99. Impedance spectra measured in wet and dry 3 % H2/Ar at 800 °C for L5S15M electrode sintered at (a) 1150 °C and (b) 1200 °C................................. 226 Figure 100. Arrhenius plots of (a) ASR and (b) individual resistances (limiting steps) for L5S15M (filled symbols) and L5S15M-GDC50 (half-filled symbols) electrodes sintered at 1150 °C measured in wet H2 (3% H2O). ........................... 228 Figure 101. Impedance spectra measured in H2 (3% H2O) at 800 °C for L5S15M and L5S15M-GDC50 electrodes sintered at 1150 °C. ......................................... 228 Figure 102. (a) Relaxation frequencies and (b) equivalent capacitances for L5S15M (filled symbols) and L5S15M-GDC50 (half-filled symbols) electrodes sintered at 1150 °C and measured in wet H2 (3% H2O). ...................................... 229 Figure 103. Arrhenius plots of (a) ASR and (b) individual resistances (limiting steps) for L5S15M (filled symbols) and L5S15M-GDC50 (half-filled symbols) electrodes sintered at 1200 °C and measured in wet H2 (3% H2O). .................... 231 Figure 104. Impedance spectra measured in wet H2 (3% H2O) at 800 °C for L5S15M and L5S15M-GDC50 electrodes sintered at 1200 °C.. .......................... 232 Figure 105. a) Relaxation frequencies and (b) equivalent capacitances for L5S15M (filled symbols) and L5S15M-GDC50 (half-filled symbols) electrodes sintered at 1200 °C and measured in wet H2 (3% H2O)......................................................... 233. © 2017 Tous droits réservés.. lilliad.univ-lille.fr.
(21) Thèse de Mónica Viviana Sandoval Rincón, Lille 1, 2017. LIST OF TABLES. CHAPTER 1 Table 1. State-of-the-art SOFC cathode and anode materials. .............................. 56 Table 2. Selected performances of sSOFC (typically air is used as oxidant). ........ 60. CHAPTER 2 Table 3. Structural parameters and selected bond lengths (Å) for LaxSr2-xMnO4±δ (x=0, 0.25, 0.4, 0.5, 0.6) calculated by Rietveld refinement from powder X-ray diffraction data (space group I4/mmm); estimated Mn oxidation states deduced from iodometric titration. ........................................................................................ 86 Table 4. Structural parameters and selected bond lengths (Å) for Nd xSr2-xMnO4±δ (x= 0.25, 0.4, 0.5, 0.6) calculated by Rietveld refinement from powder X-ray diffraction data (space group I4/mmm). ................................................................. 89 Table 5. Structural parameters for LaxCa2-xMnO4±δ (x= 0.15, 0.25) calculated by Rietveld refinement from powder X-ray diffraction data. ........................................ 93 Table 6. Structural parameters for NdxCa2-xMnO4±δ (x= 0.25, 0.4, 0.5) calculated by Rietveld refinement from powder X-ray diffraction data. ........................................ 96 Table 7. Summary of synthesis for RExA2-xMnO4±δ (RE: La, Nd and A: Sr, Ca) family. .................................................................................................................... 98 Table 8. Structural parameters and selected bond lengths (Å) of reduced LaxSr2xMnO4-δ. (x=0.25, 0.4, 0.5, 0.6) calculated by Rietveld refinement using powder X-. ray diffraction data (space group I4/mmm). ......................................................... 102 Table 9. Weight losses and stoichiometries estimated from iodometric titration and TGA data (reducing atmosphere)......................................................................... 104 Table 10. Structural parameters and selected bond lengths (Å) of reduced Nd xSr2xMnO4-δ. (x=0.25, 0.4, 0.5, 0.6) calculated by Rietveld refinement using powder X-. ray diffraction data (space group I4/mmm). ......................................................... 108. © 2017 Tous droits réservés.. lilliad.univ-lille.fr.
(22) Thèse de Mónica Viviana Sandoval Rincón, Lille 1, 2017. Table 11. Weight losses and stoichiometries estimated from iodometric titration and TGA data....................................................................................................... 111 Table 12. Thermal expansion coefficients of LaxSr2-xMnO4±δ (x= 0.25, 0.4, 0.5, 0.6). ............................................................................................................................. 123 Table 13. Occupancies and anisotropic thermal parameters of O1, oxidation state of Mn for La0.5Sr1.5MnO4±δ derived from in situ neutron diffraction data collected upon heating in 3% H2/Ar. .................................................................................... 128 Table 14. Selected bond lengths (Å) in La0.5Sr1.5MnO4±δ derived from in situ neutron diffraction data collected upon heating in 3% H2/Ar. ............................... 131 Table 15. Structural parameters of La0.5Sr1.5MnO4±δ-GDC mixture before and after the reactivity tests in air, calculated by Rietveld refinement using powder X-ray diffraction data. .................................................................................................... 136 Table 16. Structural parameters of La0.5Sr1.5MnO4±δ -GDC mixture before and after the reactivity tests in reducing atmosphere, calculated by Rietveld refinement using powder X-ray diffraction data. .............................................................................. 139 Table 17. Sintering treatments and compacity for La0.5Sr1.5MnO4±δ prepared by solid state reaction. .............................................................................................. 145 Table 18. Sintering treatments and compacity for La0.5Sr1.5MnO4±δ prepared by solgel method. .......................................................................................................... 146 Table 19. Conductivity values at 800 °C and activation energy values for La xSr2xMnO4±δ. (x=0.25, 0.4, 0.5, 0.6) in air and 3% H2/Ar. A comparison to literature. values for RP manganites and LSCM is made. ................................................... 148. CHAPTER 3 Table 20. Parameters of elementary contributions for L5S15M electrode prepared at 1150 °C and measured in air. .......................................................................... 180 Table 21. Parameters of elementary contributions for L5S15M electrode sintered at 1200 °C and measured in air. .............................................................................. 186 Table 22. Parameters of elementary contributions for L5S15M electrode sintered at 1250 °C and measured in air. .............................................................................. 192. © 2017 Tous droits réservés.. lilliad.univ-lille.fr.
(23) Thèse de Mónica Viviana Sandoval Rincón, Lille 1, 2017. Table 23. Parameters of elementary contributions for L5S15M-GDC50 electrode prepared at 1150 °C and measured in air. ........................................................... 201 Table 24. Parameters of elementary contributions L5S15M-GDC50 electrode sintered at 1200 °C and measured in air. ............................................................. 204 Table 25. Abbreviations for L5S15M-GDC composites prepared at 1200 °C. ..... 206 Table 26. Area specific resistance (ASR) values in air for composite cathodes sintered at 1200 °C. ............................................................................................. 208 Table 27. Summary of the area specific resistance (ASR) and activation energies for the different electrodes tested in air. ............................................................... 210 Table 28. Resistances in H2-3% H2O for L5S15M electrodes prepared at 1150 °C and 1200 °C. ........................................................................................................ 212 Table 29. Relaxation frequencies and equivalent capacitances in H 2-3% H2O for L5S15M electrodes prepared at 1150 °C and 1200 °C. ....................................... 212 Table 30. Parameters of elementary contributions for L5S15M-GDC50 electrode sintered at 1150 °C and measured in wet H2 (3% H2O). ...................................... 229 Table 31. Parameters of elementary contributions for L5S15M-GDC50 electrode sintered at 1200 °C and measured in wet H2 (3% H2O). ...................................... 234 Table 32. Summary of the area specific resistance (ASR) and activation energies for the different electrodes tested in wet H2 (3% H2O). ........................................ 235. © 2017 Tous droits réservés.. lilliad.univ-lille.fr.
(24) Thèse de Mónica Viviana Sandoval Rincón, Lille 1, 2017. LIST OF ANNEXES. Annex 1. Graphical result of Rietveld refinement of RExA2-xMnO4±δ (RE: La, Nd and A: Sr, Ca) as-synthesized materials ..................................................................... 256 Annex 2. Comparison of the refinement of Nd0.5Ca1.5MnO4±δ using I41/acd and Fmmm space group. ............................................................................................ 262 Annex 3. Graphical result of Rietveld refinement of LaxSr2-xMnO4±δ series after reduction in 3% H2/Ar at 850 °C for 16 h. ............................................................. 263 Annex 4. Graphical results of Rietveld refinement of NdxSr2-xMnO4±δ series after reduction in 3% H2/Ar at 850 °C for 16 h. ............................................................. 265 Annex 5. Thermogravimetric profiles for LaxSr2-xMnO4±δ (x=0.4 and 0.6) in air .... 267 Annex 6. Structural parameters of La0.5Sr1.5MnO4±δ derived from in situ neutron diffraction data. .................................................................................................... 268 Annex 7. Principles of Electrochemical Impedance Spectroscopy (EIS).............. 269 Annex 8. Reactions at the cathode (Oxygen reduction) ....................................... 274 Annex 9. Reactions at the anode (Hydrogen oxidation) ....................................... 281 Annex 10. Resistances and equivalent capacitances for L5S15M measured in wet 3% H2/Ar (3% H2O) .............................................................................................. 286. © 2017 Tous droits réservés.. lilliad.univ-lille.fr.
(25) Thèse de Mónica Viviana Sandoval Rincón, Lille 1, 2017. INTRODUCTION. The exhaustion of traditional energy sources (fossil fuels), climate change, increased oil dependence and rising energy costs create the need to find alternative energy solutions especially for developing countries which are now more vulnerable than ever to the energy deficit. Because of this, it is essential to start contributing to the development and application of alternative renewable sources or to use them in a more efficient way, in order to address the energy crisis and participate to a cleaner environment. The generation of energy through Solid Oxide Fuel Cells (SOFC), an electrochemical device that operates at high temperature, is a possible option since this highly efficient technology is based on the direct conversion of fuels into electricity. In those systems, efficiency values are theoretically higher than those of thermal machines (such as motors, turbines, etc.) and have the huge advantage of being able to use a diversity of fuels such as hydrocarbons, alcohols, synthesis gas, among others, which cannot be used directly in low temperature fuel cells [1][2]. However, one of the main critical issues to solve for viable SOFCs is their high prices mainly related to the difficulty in finding and producing efficient, reliable, durable and cheap cell materials for the three main components of the device, i.e. the anode, the electrolyte and the cathode.1. The currently used SOFC materials present numerous drawbacks and several issues still needs to be addressed. For instance, Ni/YSZ cermet at the anode exhibit numerous drawbacks that are even more pronounced when used in cells operating with hydrocarbon fuels. At the cathode, lanthanum strontium manganite (La 1xSrxMnO3). is the state-of-the-art material but such electrocatalyst requires a high. activation energy, i.e. high operating temperatures are needed, which is not in favor of sustainable process and result in cell materials degradation. Hence, one research [1] S. Mekhilef, et al., Renew. Sustain. Energy Rev., vol. 16, no. 1, pp. 981-989, 2012. [2] N. Mahato, et al., Prog. Mater. Sci., vol. 72, pp. 141-337, 2015.. 25 © 2017 Tous droits réservés.. lilliad.univ-lille.fr.
(26) Thèse de Mónica Viviana Sandoval Rincón, Lille 1, 2017. axis consists in finding materials able to operate at lower temperatures. One advantage of decreasing the operating temperature is the opportunity to use lowcost metallic interconnecting materials between the cells and to limit the electrode degradation, caused by the chemical and/or thermomechanical incompatibility between the components. However, decreasing SOFC operating temperature results in slower kinetics of the oxygen reduction reaction and large polarization losses [3]. On the other hand, the complications for anode’s production are mainly due to (i) the deposition of carbon due to the catalytic cracking reaction [4][5], (ii) the low tolerance to sulfur which is present in real fuels as H2S molecules for example [6] and (iii) the mechanical instability of Ni/YSZ caused by delamination after several redox cycling [7].2. In recent years, researchers have focused on finding better electrocatalysts for electrode reactions by studying new structural arrangements exhibiting some anisotropy (two-dimensional structure) in order to find mixed ionic and electronic conducting materials (MIEC). The mixed conductivity can potentially extend the triple phase boundary (TPB) active region over the entire electrode, thus greatly reducing the electrode polarization at low operating temperature. In this context, the present investigation focuses on the study of mixed conducting materials of K 2NiF4-type structure (Ruddlesden-Popper phases) for potential application as electrodes in symmetrical cells. In this innovative configuration, the same material is used for both electrodes (air and hydrogen), which potentially simplifies the assembly process by allowing co-sintering of the electrodes and minimizes the problems related to the mechanical stress due to the differences in thermal expansion coefficients. The Ruddlesden-Popper phases, particularly the lanthanum nickelates La2NiO4+δ possess structural and transport properties that have made them promising [3] R. Pelosato, et al., J. Power Sources, vol. 298, pp. 46-67, 2015. [4] M. Kogler, et al., Mater. Chem. Phys., vol. 173, pp. 508-515, 2016. [5] Y. Zhang, et al., J. Power Sources, vol. 279, pp. 759-765, 2015. [6] H. Chen, et al., Appl. Energy, vol. 179, no. 5, pp. 765-777, 2016. [7] Y. Zhang, et al., Solid State Ionics, vol. 180, pp. 1580-1586, 2009.. 26 © 2017 Tous droits réservés.. lilliad.univ-lille.fr.
(27) Thèse de Mónica Viviana Sandoval Rincón, Lille 1, 2017. candidates for Intermediate Temperature SOFC cathode materials [8][9]. Unfortunately, these nickel materials are not suitable for the anodic side because they are unstable in reducing atmosphere. In contrast, RP manganites could be proposed as symmetrical electrode, since the presence of manganese in the structure seems to be a key element for such dual function, what is the case for example for La0.75Sr0.25Cr0.5Mn0.5O3-δ (LSCM) perovskite that exhibits a good stability in both reducing and oxidizing environments and an anodic behavior comparable to Ni/YSZ cermet [10][11].3. This thesis presents the study of the RExA2-xMnO4 oxides with RE: La, Nd and A: Sr, Ca as possible electrode materials in symmetrical Solid Oxide Fuel Cells, including the determination of the range of compositions that can be prepared in air, the stability study in oxidizing and reducing atmospheres, the evaluation of chemical and thermo-mechanical compatibility with the common electrolytes, the determination of the electrical characteristics as a function of temperature and atmosphere, and finally the evaluation of the electrochemical properties of symmetrical cells operated in air and hydrogen.. The first chapter describes the scientific context of the research, the operation of solid oxide fuel cells and the essential requirements for the three main components of the cell, namely the electrolyte, cathode and anode. In addition, a comprehensive literature review of the electrode materials used in the past years, including a description of the properties (or issues) of both the well-known perovskite and Ruddlesden-Popper materials is given. This chapter also presents the advantages of a symmetric cell configuration, and the electrode materials reported so far, satisfying the corresponding specific requirements.. [8] R. J. Woolley and S. J. Skinner, Solid State Ionics, vol. 255, pp. 1-5, 2014. [9] R. K. Sharma, et al., J. Power Sources, vol. 316, pp. 17-28, 2016 [10] D. M. Bastidas, et al., J. Mater. Chem., vol. 16, no. 17, pp. 1603-1605, 2006. [11] S. Tao and J. T. S. Irvine, J. Electrochem. Soc, vol. 151, no. 2, pp. A252-259, 2004.. 27 © 2017 Tous droits réservés.. lilliad.univ-lille.fr.
(28) Thèse de Mónica Viviana Sandoval Rincón, Lille 1, 2017. Chapter 2 presents the study of preparation conditions to obtain single phases within the RExA2-xMnO4 families with RE: La, Nd and A: Sr, Ca, the structural characterization performed using X-ray Powder Diffraction data (XRPD) and the evaluation of the thermal stability of the same materials under reducing conditions. This preliminary part of the work allows to make a first selection of potential electrode materials for symmetrical SOFC. The structural behavior during redox cycling of selected compositions, using in situ high temperature XRD and TGA measurements is then presented, that is completed with a deep study by in situ neutron powder diffraction (NPD) of one of the most promising and representative compositions, in order to get a further insight into the process of oxygen vacancies formation during reduction. Finally, the last selection is based on the analysis of the thermal stability and chemical compatibility of the remaining compositions with common electrolytes (LSGM, GDC and YSZ), completed by the determination of their electrical properties in air and hydrogen using the four-probe method.. The Chapter 3 concerns the determination of the optimized fabrication conditions for symmetric cells using the selected material of Chapter 2; the influence of electrode sintering temperature and electrode composition (composite) is described and thoroughly analyzed, based on the determination by Electrochemical Impedance Spectroscopy (EIS) of the electrochemical behavior in the oxygen reduction reaction (cathode) and the hydrogen oxidation reaction (anode). The results are discussed in order to correlate the different contributions that constitute the cathode and anode polarization resistances with the nature of the limiting steps of the corresponding electrode reactions and the characteristic parameters of the electrode elaboration process.. 28 © 2017 Tous droits réservés.. lilliad.univ-lille.fr.
(29) Thèse de Mónica Viviana Sandoval Rincón, Lille 1, 2017. CHAPTER I. 1 STATE OF THE ART. 29 © 2017 Tous droits réservés.. lilliad.univ-lille.fr.
(30) Thèse de Mónica Viviana Sandoval Rincón, Lille 1, 2017. State of the art. __________________________________________________________________ 1.1 INTRODUCTION ENERGETIC AND ENVIROMENTAL CONTEXT. Nowadays, environmental issues such as global climate change, natural resources depletion and air pollution, have strongly attracted world's attention. Currently, most countries are highly dependent on fossil fuels, since the latter are widely used to handle energy demand in industry, communication, transportation, food production, as well as domestic purposes [1][2][3]. According to the statistics of the International Energy Agency (IEA), total global energy consumption reached 21962 TWh in 2014, which was mainly supplied by 36%, 4%, 22%, 20% and 1.5% from coal, oil, natural gas, hydro sources and biofuels/waste, respectively. For its part, Colombia produces 74% of its energy from hydro sources, 9% from coal, 15% from natural gas and 1.4% from biofuels/waste (see Figure 1) [4]. Given the imminent consumption of fossil fuels, the emissions of CO2, SOx and NOx have been growing during the last decades. As some reports indicate, these emissions have increased of about 16 million tons in the last 20 years, which would generate a global warming of 2 °C by the middle of the 21st century [5][6].. Figure 1. Electricity generation by fuel (a) in the world and (b) in Colombia. (a). (b). 25000. 70000 60000. 20000. GWh. TWh. 50000 15000. 10000. 40000 30000 20000. 5000. 1972. 10000. 1978. 1984. 1990. 1996. 2002. 2008. 2014. 1972. 1978. 1984. 1990. 1996. 2002. 2008. 2014. Taken from web: http://www.iea.org/statistics. 30 © 2017 Tous droits réservés.. lilliad.univ-lille.fr.
(31) Thèse de Mónica Viviana Sandoval Rincón, Lille 1, 2017. State of the art. __________________________________________________________________ In response to the need to decrease the fossil fuels depletion and the pollution, some potential solutions have evolved, including energy conservation through improved energy efficiency and an increase in environmental-friendly energy technologies, such as renewable sources and fuel cells [7][8][9][10]. In this context, hydrogen, a clean energy carrier that can be produced from any primary energy source, and fuel cells which are very efficient energy conversion devices, with the largest energy content of any fuel. In brief, the hydrogen and fuel cells open the way to integrated clean energy devices with high efficiency, durability and availability [11][12].. FUEL CELLS AND THE HYDROGEN ECONOMY. The economy based on hydrogen energy can be considered as a long-term transition process, which will allow to change the current energy system to one which attempts to combine the cleanliness of hydrogen as an energy carrier with the efficiency of fuel cells, as devices to transform energy into electricity and heat [13][14]. Hydrogen can be produced from water, both by conventional electrolysis and advanced high temperature processes; from nuclear or solar energy, biomass, coal, as well as fossil fuels using steam reforming process [15]. Currently, the annual production of H2 is about 0.1 Gton, from which 90-95% is consumed by the petrochemical industries and 5-10% by people in everyday life. In addition, the overall global demand for hydrogen is expected to increase by around 5-6% annually up to the year 2020, as a result of demand from petroleum refinery operations, and for the production of ammonia and methanol. However, it should be also pointed out that the foremost factor that will determine the specific role of hydrogen technologies will likely be energy demand [16][17][18].. In the development of new hydrogen technologies, the fuel cells are considered as promising devices for use as source of heat and electricity. Indeed, these systems allow the electrochemical recombination of hydrogen and oxygen to produce electricity, with characteristics such as high efficiency (up to more than 60%) and. 31 © 2017 Tous droits réservés.. lilliad.univ-lille.fr.
(32) Thèse de Mónica Viviana Sandoval Rincón, Lille 1, 2017. State of the art. __________________________________________________________________ reliability; modular structure makes them suitable for a variety of applications, excellent performance and limited or no atmospheric or acoustic emissions [19][20].. Fuel cells may be classified based on their operating temperature regime: (i) at low temperature (23-150 °C) such as AFC (alkaline fuel cell), PEMFC (proton exchange membrane fuel cell) and DMFC (direct methanol fuel cell), (ii) at medium temperature (150-220 °C) such as PAFC (phosphoric acid fuel cell) and at high temperature (6001000 °C) such as MCFC (molten carbonate fuel cell), DCFC (direct carbon fuel cell) and SOFC (solid oxide fuel cell). Likewise, these can also be divided according to the type of electrolyte (liquid, ceramic or polymer) and the electrodes used, or depending on the nature of the ion exchanged between the electrodes (OH -, CO32-, H+, O2-). Among all this variety, the most promising technologies are the PEMFC (Proton Exchange Membrane Fuel Cell) and the SOFC (Solid Oxide Fuel Cell) [21][22][23].. 1.2 SOLID OXIDE FUEL CELL (SOFC) A solid oxide fuel cell (SOFC) is a ceramic-based electrochemical device that converts the chemical energy of a fuel gas and an oxidant gas directly to electrical energy and heat without combustion as an intermediate step, giving much higher conversion efficiencies than conventional thermomechanical methods. A SOFC system usually utilizes a solid ceramic as the electrolyte and operates at extremely high temperatures (600-1000 °C). The operating temperature allows internal reforming, promotes rapid electrocatalysis with non-precious metals, and produces high quality by-product heat for co-generation. SOFCs are favored for high-power applications since they can reach an electrical efficiency between 35 and 43% and a combined heat and power (CHP) efficiency up to 90% [22][24][25].. A SOFC is built of five key types of components: electrolyte, anode, cathode, interconnects and seals. Figure 2 shows a SOFC scheme.. 32 © 2017 Tous droits réservés.. lilliad.univ-lille.fr.
(33) Thèse de Mónica Viviana Sandoval Rincón, Lille 1, 2017. State of the art. __________________________________________________________________ Figure 2. Scheme of a Solid Oxide Fuel Cell (SOFC). Taken from [26][27].. Cathode Electrolyte Anode 1 H2 + 𝑂2− → 𝐻2 O + 2e− O2 + 2e− → O2− 2. The electrolyte at the heart of each cell is a solid ceramic oxide that facilitates the generation of oxygen vacancies and carries the charge between the half reactions at the cathode and anode. The cathode (or the air electrode) and the anode (or the fuel electrode) are the sites of each half reaction: oxygen reduction and fuel oxidation, respectively. The roles of interconnects are the electrical connection between cells and the gas distribution within the cell stack. The seals, used in some planar designs, bond components together and provide gas-tightness [27][28][29].. THERMODYNAMIC PRINCIPLES. The operation of a SOFC involves the reduction of the oxidant at the cathode and the oxidation of the fuel at the anode. At present, the most common fuel and oxidant for use in SOFCs are hydrogen and oxygen (electrochemically active). Oxygen molecules consume electrons at the cathode and get reduced to oxide ions, which diffuse through the electrolyte and results in the generation of ionic current. At the cathode, the reaction can be represented as: 1 2. 𝑂2 + 2𝑒 − → 𝑂2−. (1-1). Eq. 1-1 can be presented in Kröger–Vink notation as: 33 © 2017 Tous droits réservés.. lilliad.univ-lille.fr.
(34) Thèse de Mónica Viviana Sandoval Rincón, Lille 1, 2017. State of the art. __________________________________________________________________ 1 2. 𝑂2 + 2𝑒 − + 𝑉𝑂.. → 𝑂𝑂𝑥. (1-2). where 𝑉𝑂.. is a vacant oxygen site while 𝑂𝑂𝑥 is an oxide ion sitting at its allocated oxygen site in the oxide sublattice cathode. As apparent from the above equations, the oxygen reduction process in utilizing oxide ion has three basic requirements: (i) presence of oxygen, (ii) presence of electrons, and (iii) diffusion of oxide ions (from reaction site (cathode) to the electrolyte). As a result, the electrode material must possess high electronic conductivity and be porous to facilitate gas permeation to and from the reaction sites. Oxide ions move through the electrolyte and at the same time, oxygen vacancies migrate from the anode side to the cathode side via an ion conducting electrolyte. After migrating through the electrolyte, the oxide ions emerge at the anode and react with fuel (for example H2 or CO) as follows: 2𝑂2− + 2𝐻2 → 2𝐻2 𝑂 + 4𝑒 −. (1-3). 2𝑂2− + 2𝐶𝑂 → 2𝐶𝑂2 + 4𝑒 −. (1-4). The electrons produced during the reactions are carried by the current collector in the anode to an external load via externally connected electrical circuit [30][31].. The SOFC is therefore considered to be an oxygen concentration cell, and the electromotive force (emf) or reversible (thermodynamic) voltage, Er, is given by the Nernst equation:. 𝐸𝑟 =. 𝑅𝑇 4𝐹. 𝑙𝑛. 𝑃𝑂2(𝑐𝑎𝑡ℎ𝑜𝑑𝑒) 𝑃𝑂2(𝑎𝑛𝑜𝑑𝑒). (1-5). where R is the gas constant, T the temperature (K), F the Faraday constant, and 𝑃𝑂2 the oxygen partial pressure at the electrode. Since, air is fed as an oxidant through the cathode side of the SOFC, the 𝑃𝑂2 at the cathode is 0.21 atm. In laboratory experiments related to SOFCs, the commonly used hydrogen gas is generally fed at the anode, and the overall cell reaction can be expressed as [32]: 1. 𝐻2(𝑔) + 2 𝑂2(𝑔) → 𝐻2 𝑂(𝑔). (1-6). Under open circuit conditions, with electrochemical potential of oxide ions equilibrated across the oxide-ion conducting electrolyte, a voltage difference, E, the. 34 © 2017 Tous droits réservés.. lilliad.univ-lille.fr.
(35) Thèse de Mónica Viviana Sandoval Rincón, Lille 1, 2017. State of the art. __________________________________________________________________ Nernst potential, appears between the anode and the cathode. It is related to the net free energy change, ΔG, of the reaction via the following relation: ∆𝐺 = −𝑛𝐹𝐸 = −2𝐹𝐸. (1-7). where n denotes the number of electrons participating in the reaction. The Nernst potential, E, is the open circuit voltage, OCV, and is given in terms of the various partial pressures by: 𝑅𝑇. 𝐸 = 𝐸 0 + 4𝐹 𝑙𝑛 (. 𝑐 𝑝𝑂 𝑝𝑎 2 𝐻2 𝑎 𝑝𝐻 2𝑂. 2. ). (1-8). Where 𝑝𝑂𝑐 2 is the partial pressure of oxygen in the cathode gas, 𝑝𝐻𝑎2 and 𝑝𝐻𝑎2 𝑂 are respectively the partial pressures of H2 and H2O in the anode gas, R is the gas constant, F the Faraday constant, and T the absolute temperature.. As seen in Figure 3, the fuel cell voltage is significantly deviated from the theoretical potential (also called reversible standard potential, 1.23 V). The dependence of E on current density can be estimated assuming the respective cathodic and anodic chambers as being continuously stirred tank reactors.. Figure 3. Typical polarization curve describing the relationship between cell voltage and current density. OC V. Taken from [33] 35 © 2017 Tous droits réservés.. lilliad.univ-lille.fr.
(36) Thèse de Mónica Viviana Sandoval Rincón, Lille 1, 2017. State of the art. __________________________________________________________________. In an operating SOFC, the cell voltage is always less than the theoretical Nernst value because of some electrochemical or polarization losses. The cell polarization or overpotential ‘η’ is the difference between the theoretical and the operating voltages, and it includes: (i) resistance (ohmic), (ii) diffusion (concentration) polarization and (iii) charge transfer (activation) polarization [31].. Ohmic polarization Ohmic loss arises due to resistance offered to the flow of ions in ionic conductors or electrons in electronic conductors. Transport of oxide ions through the electrolyte is thus governed by the ionic resistivity of the electrolyte. Similarly, transport of electrons (or electron holes) through the electrodes (the cathode and the anode) is governed by their respective electronic resistivities (corrected for porosity and the possible existence of secondary, insulating phases). Because of these ohmic resistances, at a given current density, there is a voltage loss, ηohm, given by: 𝜂𝑜ℎ𝑚 = (𝜌𝑒 𝐼𝑒 + 𝜌𝑐 𝐼𝑐 + 𝜌𝑎 𝐼𝑎 + 𝑅𝑐𝑜𝑛𝑡𝑎𝑐𝑡 )𝑖. (1-9). where 𝜌𝑒 , 𝜌𝑐 , and 𝜌𝑎 , are respectively electrolyte, cathode, and anode resistivities, and 𝐼𝑒 , 𝐼𝑐 , and 𝐼𝑎 , are respectively electrolyte, cathode, and anode thicknesses, and Rcontact is any possible contact resistance. In a SOFC, the main contribution to 𝜂𝑜ℎ𝑚 is due to the electrolyte material [45], since its (e.g. yttria-stabilized zirconia, YSZ) ionic resistivity is much greater than electronic resistivities of the cathode (e.g. Sr-doped LaMn03, LSM), and the anode (e.g. Ni + YSZ cermet). For example, the ionic resistivity of YSZ at 800°C is ~50 Ω cm. By contrast, electronic resistivity of LSM is 10-2 Ω cm and that of the Ni/YSZ cermet is on the order of 10 -4 Ω cm. Thus, the electrolyte contribution to ohmic polarization can be large, especially in thick electrolyte supported cells.. 36 © 2017 Tous droits réservés.. lilliad.univ-lille.fr.
Figure


+7


Documents relatifs
[Researcher's note]: The loss is mentioned in Shipwrecks of Newfoundland and Labrador by Galgay and McCarthy, 79.. For complete verification of details and a full text of this
T here ar e few s tudies qua ntifying t he economic burden of VL on households conducted prior to the elimination initiative showed the profound impact of a VL episode on
Importantly, for the same periodicity of a hncp nanorod array, the distances between nanorods were further changed by varying the background gas pressure during the PLD (here,
In a recent theoretical study, a phase transition was found upon compression from the I4/mmm structure stable at ambient conditions to the Cmcm structure, although at
According to visual intentionalism, unless such visual properties as shape, orientation, color, texture, motion had been instantiated by mind-independent objects in the envir- onment
[r]
Takes note that no supplementary voluntary contributions to the Intangible Cultural Heritage Fund have yet been received in line with the two funding priorities approved
When a child is the victim of a criminal offence, appropriate measures to protect the rights and best interests of the child shall be adopted at all stages of the criminal
