Science Arts & Métiers (SAM)
is an open access repository that collects the work of Arts et Métiers Institute of
Technology researchers and makes it freely available over the web where possible.
This is an author-deposited version published in: https://sam.ensam.eu Handle ID: .http://hdl.handle.net/10985/7014
To cite this version :
José OUTEIRO, Jean-Philippe COSTES, Joana KORNMEIER - Cyclic Variation of Residual Stress Induced by Tool Vibration in Machining Operations - In: 14th CIRP Conference on Modeling of Machining Operations (CIRP CMMO), Italy, 2013-06-13 - 14th CIRP Conference on Modeling of Machining Operations (CIRP CMMO) - 2013
Any correspondence concerning this service should be sent to the repository Administrator : archiveouverte@ensam.eu
14
thCIRP Conference on Modeling of Machining Operations (CIRP CMMO)
Cyclic Variation of Residual Stress Induced by
Tool Vibration in Machining Operations
J.C. Outeiro
a,*, J.-P. Costes
a, J. R. Kornmeier
b a LaBoMaP, Arts et Metiers ParisTech, rue Porte de Paris, 71250 Cluny, France b HahnTechnische Universität München, ZWE-FRM II, Lichtenbergstr.1, 85747 Garching, Germany * Corresponding author. Tel.:+ 33-385595358. E-mail address: jose.outeiro@ensam.euAbstract
In machining, due to the tool vibration the forces, temperatures and stresses vary during the cutting process, so as the residual stresses over the machined surface. This variation of the residual stress has never been measured and, therefore, imposes new experimental challenges. The objective of this work is to correlate the variation of the residual stresses along the cutting path with the frequency of the surface geometrical defect generated by the vibration of the tool holding system. In order to perform such correlation a hybrid experimental/analytical approach was applied for an austenitic stainless steel, AISI 316L. Residual stresses were analyzed in the machined specimen along the cutting path using neutron diffraction. The results show a cyclic variation of the residual stresses, which can be detected when considering the frequency of the tool vibration. The frequency of the tool vibration is also correlated with the topology of the surface.
Keywords: Residual stresses, surface roughness, cutting forces, vibrations.
1. Introduction
Metal cutting, or simply machining, is one of the oldest and most important processes for shaping components in the manufacturing industry. Due to the interaction between the cutting tool and the workpiece, a new (machined) surface is generated. Due to the tool vibration the forces, temperatures as stresses are not constant, but they vary, so as the residual stresses over the machined surface. This cyclic variation of the residual stress has never been measured and, therefore, imposes new experimental challenges.
Although, regenerative vibrations phenomena in machining have been well known since the sixties, the dynamic behavior of the tool or the workpiece is a complex problem that manufacturers have to face. For most of the applications the most harmful consequences of regenerative vibrations is the poor surface quality. More precisely, the link between machining parameters and surface roughness taking account of the dynamic of the system is now well established. In 1991, Montgomery [1] examined the link between machining parameters and surface roughness taking account of the dynamic of the system. In 2001, Altintas [2] built a time domain
simulation of the milling process taking into account the dynamic of the tool in order to predict the surface roughness. A method based on tool displacements measurements in milling including tool vibrations was proposed by Costes [3] and Arizmendi [4]. However, intentionally invoked chatter during machining can be very useful to generated surface textures or structures for different applications, such as running in, oil retention, friction control [5, 6].
Almost of the chatter analysis in machining have paid attention to their consequences in surface finishing and rarely in the mechanical state of the machined surface layers. The objective of this study is to search for eventual periodic variation of the residual stresses along the cutting path and correlate this with tool vibration
2. Experimental and Numerical Procedures
2.1. Machining tests
Round bars (100 mm in diameter) of austenitic stainless steel AISI 316L were selected for this study. Microstructure of the steel consisted of an equiaxed grain
J.C. Outeiro, J.-P. Costes, J. R. Kornmeier
structure characterized by an approximate grain size of 50 m and material hardness was close to 170HV.
The machining tests were conducted under orthogonal cutting conditions (Fig. 1), using uncoated (ISO M10-M30) tungsten carbide tools. The geometry of the cutting tools according to the ISO Standard 3002/1-1982 was as follows: the normal rake angle () was equal to 0º, the normal flank angle () was equal to 11º and the tool cutting edge radius (rn) was equal to 30 m. The tool
cutting edge angle (r) was 90º and the tool cutting edge
inclination angle (s) was 0º.
Finally, the range of cutting regime parameters used in the tests was as follows: the cutting speed (vc) was equal to
100 and 150 m/min, the uncut chip thickness (t1) was
equal to 0.1 and 0.2 mm and width of cut (w) was constant and equal to 6 mm. The cutting speed was kept constant by the lathe controller, which varied the rotation speed depending on the tool position in radial direction. No cutting fluid was used in the tests.
These disks were machined in a SOMAB T400 CNC lath machine equipped with an experimental setup for forces, which was composed by a Kistler dynamometer 9121B. The three cutting force components Fp, Ff and Fc were
monitored during the operation through an acquisition system with a 10 kHz sampling frequency. No filtering was applied to the signal during or after the measurement.
Fig. 1: Configuration of the orthogonal cutting tests and the directions of the measurements of the cutting forces and the residual stresses.
2.2. Residual stresses and surface topography analysis
Residual stresses were analyzed along the cutting path by neutron diffraction at FRM II, Technische Universität München (TUM), on the Stress-Spec instrument. This diffractometer is dedicated to texture and residual stress analysis [7]. A PSD area detector of 20x20 cm2 collected
the diffracted radiation. A bent silicon Si (400) monochromator was set at a take-off angle 2M = 76°,
which provides a wavelength around 1.68 Å. The measurements were performed around a scattering angle of 2s 101° for the austenite. A gauge volume of 1x1x1
mm3 was defined by the primary and secondary slits.
Residual stresses were analyzed in the three orthogonal
directions: circumferential (cutting direction), axial and radial (normal to machined surface) directions (Fig. 1). Surface topography was measured using the profilometer Somicronic Surfascan 3D. The measurements were performed in the circumferential direction, using a trace length of 35 mm, a Gaussian M1 band-pass filter with a cut-off length of 2.5 mm.
3. Results and discussion
3.1. Correlation between the force and surface topography
The force components can be described as a steady force with a high amplitude varying signal. The high levels of forces variations are well correlated with the fact that instability occurred during the machining operation. As illustrated in the spectrogram represented in Fig. 2, several frequencies appear at the same time in the force signal. Moreover, Fig. 2 shows that these chatter frequencies vary along the tool path. The Y-axis of the spectrogram shows the time, where each horizontal black line is spaced with the time corresponding to one revolution. The beginning of the first revolution corresponds to 0.1 sec. It is noticeable that during one revolution the frequency behaviour of the force component does not remain constant.
As shown Fig. 2, in the frequency range from 1000 to 1500 Hz, it is observed:
From 0.1 sec to about 0.22 sec, a near 1200 Hz frequency is detected.
From 0.22 sec to the next horizontal line (0.28 sec), which corresponds to one complete revolution, the frequency is lower (about 1100 Hz).
The main frequency of the signal changes periodically around 1200 Hz and is synchronized with the part revolution. This frequency is related with the vibration of the tool holding system, composed by the tool holder, dynamometer and turret attachment. The two others frequency bands (≈2600 and ≈3800 Hz) look like harmonics of the first 1200 Hz frequency.
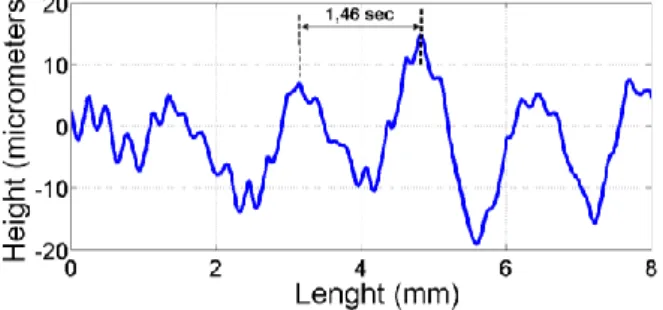
Using the profilometer the topography of the machined surface was measured. Due to the circular shape of the workpiece, the first step consists into remove the circular shape from the signal. Fig. 3 shows the measured profile with no filtering, thus including both waviness and surface roughness. The pattern length of the defect is approximately 1.46 mm, which is an unusual high value. This length can be associated to the surface geometrical defect.
Taking into account that the cutting speed was equal to 100 m/min, the induced frequency of the periodic surface defect can be calculated, being this frequency equal to 1141 Hz. It seems that this value matches quite well the
value of the frequency of the force signal (Fig. 2). Therefore, the frequency of the force signal is identical to the frequency of the periodic surface defect, being both caused by the tool holding system.
Regarding the residual stresses in the machined surface, two questions may arise: 1) Does the residual stresses in the machined surface varies also periodically? 2) Does the frequency of this variation equal to the frequency of tool holding system vibration?
Fig. 2. (a) Spectrogram of the penetration force Fp ; 3D view. (b) Top view. The horizontal lines show the revolution period of the part (vc = 100m/min).
Fig. 3: Measured profile of the surface (first workpiece).
3.2. Correlation between surface topography and the residual stress
To answer the previous questions, a second workpiece was machined, for which only the surface topography and residual stresses are known.
Fig. 4 shows the profile of the surface with no filtering, thus including both waviness and surface roughness. In this case, the periodicity of the surface defect is approximately 1.8 mm, which corresponds to a frequency of 930 Hz.
Fig. 4: Measured profile of the surface (second workpiece).
Using neutron diffraction, the residual stresses were measured and the obtained results represented in Fig. 5
This figure put in the evidence the variation of the residual stresses along the cutting path. These stresses are tensile and higher (reaching values around 550 MPa) in the cutting direction (circumferential direction). They are lower and compressive in the radial direction, i.e., in the direction normal to the machined surface.
If the vibration of the tool holding system causes this variation of the residual stresses, then the frequency of the residual stress variation should be equal to this frequency. Assuming that the residual stresses follow a cyclic variation, then a simple way to describe this variation is using a sinusoidal function as follows:
0
sin 2
residual
A
f x
X
D
(1)where A is the amplitude of the residual stress (MPa), X0
is the phase, D is the average residual stresses along the cutting path (MPa), x is the distance along the surface (mm) and f is the frequency of the surface defect, which is the inverse of the period of the surface defect (mm). While f is equal for the residual stresses in the three directions, the coefficients A and D will depends on particular direction and they can be calculated from the experimental data. Table 1 shows the values of the above-mentioned coefficients.
Fig. 6 shows the experimental residual stresses together with the sinusoidal functions that describe the cyclic variation of the residual stresses. These sinusoidal functions fit the experimental results relatively well. The
J.C. Outeiro, J.-P. Costes, J. R. Kornmeier
scatter is probably due to the experimental errors in the residual stress determination and also to the fact that the residual stresses were averaged over a depth of 1 mm.
Table 1. Coefficients of the residual stress model.
A
(MPa)
D
(MPa)
X
0(mm)
f
(mm
-1)
Cicumf.
100 425 -0.5 0.56Axial
112 106 -0.5 0.56Radial
78 -41 -0.5 0.56Fig. 5: Cyclic variation of the residual stresses along the cutting path
4. Conclusions
The objective of this work was to correlate the variation of the residual stresses along the cutting path with the frequency of the surface geometrical defect generated by the vibration of the tool holding system.
The following conclusions can be derived. First, a good agreement was observed between the force signal and surface geometrical defect frequencies, being both caused by the vibration of the tool holding system. Second, the variation of the residual stresses was modeled using a sinusoidal function, being the corresponding coefficients determined from residual stress and surface geometrical defect measurements. The obtained model match reasonable well the measured residual stresses on the machined surface. Therefore, the vibration of the tool holding system will induce periodic variations of the surface geometrical defect and residual stress.
Acknowledgements
Part of this research project has been supported by the European Commission under the 6th Framework Programme through the Key Action: Strengthening the European Research Area, Research Infrastructures. Contract nº RII3-CT-2003-505925.
References
[1] Montgomery, D. and Y. Altintas, Mechanism of Cutting Force and Surface Generation in Dynamic Milling. Journal of Engineering for Industry 1991. 113: p. 160-168.
[2] Altintas, Y. and S. Engin, Generalized Modeling of Mechanics and Dynamics of Milling Cutters. CIRP Annals - Manufacturing Technology 2001. 50: p. 25-30.
[3] Costes, J.P. and V. Moreau, Surface roughness prediction in milling based on tool displacement. Journal of Manufacturing Processes, 2011. 13(2): p. 133-140.
[4] Arizmendi, M., et al., Model for Surface Topography Prediction in Peripheral Milling Considering Tool Vibration. CIRP Annals - Manufacturing Technology 2009. 58: p. 93-96.
[5] Mann, J.B., et al., Modulation-Assisted Machining: A New Paradigm in Material Removal Processes, in 13th CIRP Conference on Modelling of Machining Operations, J.C. Outeiro, Editor 2011, Trans Tech Publications: Sintra, Portugal. p. 514-524.
[6] Borštnik Bračić, A., T. Surmann, and E. Govekar, Modeling and characterization of surface structures produced by milling, in 13th CIRP Conference on Modelling of Machining Operations, J.C. Outeiro, Editor 2011, Trans Tech Publications: Sintra, Portugal. p. 495-504.
[7] Hofmann, M., R. Schneider, and G.A. Seidl, The new materials science diffractometer STRESS-SPEC at FRM-II, in 8th International Conference on Neutron Scattering 2006, Physica B-Condensed Matter Sydney, Australia. p. 1035-1037