HAL Id: hal-01857388
https://hal.archives-ouvertes.fr/hal-01857388
Submitted on 18 Aug 2018
HAL is a multi-disciplinary open access archive for the deposit and dissemination of sci-entific research documents, whether they are pub-lished or not. The documents may come from teaching and research institutions in France or abroad, or from public or private research centers.
L’archive ouverte pluridisciplinaire HAL, est destinée au dépôt et à la diffusion de documents scientifiques de niveau recherche, publiés ou non, émanant des établissements d’enseignement et de recherche français ou étrangers, des laboratoires publics ou privés.
A Method to build a Geolocalized Food Price Time
Series Knowledge Base analyzable by Everyone
Johyn Papin, Frédéric Andrès, Laurent d’Orazio
To cite this version:
Johyn Papin, Frédéric Andrès, Laurent d’Orazio. A Method to build a Geolocalized Food Price Time Series Knowledge Base analyzable by Everyone. Latin America Data Science Workshop (LADaS@VLDB), 2018, Rio de Janeiro, Brazil. �hal-01857388�
A Method to build a Geolocalized Food Price Time Series
Knowledge Base analyzable by Everyone
Johyn Papin1,2, Frederic Andres2, Laurent D’Orazio1,3 1 Univ Rennes
Lannion France
2National Institute of Informatics Tokyo, Japan
3IRISA Lannion, France
Abstract. Time-series analysis is a very challenging concept in Data Science for companies and industries. Harvesting prices of agricultural production (e.g. vegetable, fruit, milk...) as time series is key to operating reliable dish cost pre-diction at scale to ensure for example that the market price is valid. In this paper, we describe initial stakeholder needs, the service and engineering con-texts in which the challenge of time-serie harvesting and management arose, and theoretical and architectural choices we made to implement a solution of historical food prices. For this, we use scrappers1 through the TOR network2. We also propose a knowledge map approach to make the data accessible to any type of users.
1. Introduction
FAO Food Price Index (FFPI)3, introduced in 1996 is becoming more and more popular as in the 21st century it is important to monitor the variation of Food Price over time and location. Various events play a role in this Food Volatility such as nature seasons, natu-ral disasters (floods, drought), or political problems (war, strikes, importation/exportation regulation). Contributions to a knowledge base of pricing time series open up new per-spectives in Data Science. As part of the NII CRWB project, a Linked Open Data Collec-tion of recipes and ingredients is available for internaCollec-tional collaboraCollec-tion [Andres 2018] for which there is a need to monitor ingredient prices. This makes possible to estimate the cost of the recipe itself and, for example, to ensure that the market price is valid. Unfortunately, there is not yet any available knowledge base, only existing databases of pricing time series are offered by the states (Eurostat4, USDA ERS5, FAO6...), and they contain only a limited dataset. Indeed, creating a knowledge-base of pricing time series7
1Data scraping is a technique in which a computer program extracts data from human-readable output
coming from another program.
2TOR network is a group of volunteer-operated servers that allows people to improve their privacy and
security (https://www.torproject.org/) 3 http://www.fao.org/worldfoodsituation/foodpricesindex/en/ 4http://ec.europa.eu/eurostat/web/main/home 5https://www.ers.usda.gov/ 6http://www.fao.org/giews/food-prices/tool/public/
7Estimated volume of the knowledge: by collecting the prices of 2000 products from 5 sources in 270
raises many problems: How to collect time series food prices based on location, and how to make the data usable by any type of user?
To address these issues, we propose to create a harvesting service that will run continuously. This service will use scrappers through the TOR network. We then propose to use Linked Open Data to make accessible the overall pricing time serie dataset and to use an interface inspired by knowledge maps to visualize these data. Data harvesting in this context raises several challenges: data integration from a myriad of sources, data storage, consistency... These are out of the scope of this paper which addresses secu-rity and visualization. Our scrapper is capable of completely masking his identity. We implemented our solution on the French website Monoprix to prove the concept.
This paper is structured as follows. Section 2 reviews the motivations beyond this research. Section 3 describes our scrapper’s architecture, our visualization system and our implementation choices. Finally, Section 4 concludes and introduces the future works.
2. Motivations
Large food chains usually have an online catalog, but no API to access to their food pricing. The only solution is then to use scrappers to extract the data directly from the websites of large food chains. Unfortunately, these websites are generally able to detect scrappers. Current scrappers are based on frameworks such as Scrapy8 or Colly9 and are very fast ([Hernandez-Suarez et al. 2018]). They can bypass basic security, but not more complex cases. In addition to that, they are designed to run once and then return a file containing the data, not to run continuously. It is by trying to answer these two problems that we designed our original scrapper, while taking into account the speed.
Navigation over the harvested pricing time serie is also a key service. Current solutions for displaying times series of food prices are based on multi-level lists and then graphs (Eurostat10). This works when you know what you want to see (for example the evolution of the price of milk in Brittany). But to get a global view of the data and for example detect anomalies this is not usable.
3. Proposition
3.1. Data harvesting
Some food prices are available online on the websites of large groups. These data are very important because they will allow the database to be filled quickly with reliable prices. As these websites do not offer open data, the only solution is to use scrappers to extract them. Unfortunately, most of these websites are secure and quickly detect scrappers. We therefore propose a system capable of bypassing the security of these websites.
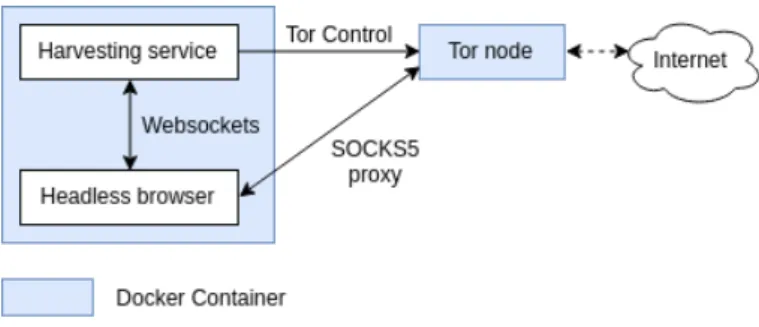
Using a headless browser and the TOR network ([Dingledine et al. 2004]) makes it possible to counter these security features effectively and at low cost. There are solu-tions that offer a large IP pool, but these are expensive. This is why the TOR network is a good alternative. We have implemented a scrapper capable of extracting prices from https://monoprix.fr/. You can see the architecture of the system on the Figure 1.
8https://scrapy.org/ 9http://go-colly.org/
The service communicates with a headless browser to load web pages and is connected to a TOR node via the TOR Control protocol. The headless browser proxy is configured on the TOR node. This makes it possible to make the scrapper anonymous, and request a new IP when it is needed. However, it is slower than traditional scrappers, even though it can extract data from multiple links at the same time. This can be fixed by running multiple instances of the scrapper. The scrapper algorithm is described on the Algorithm 1. This
Figure 1. Architecture of our scrapper
simple algorithm extracts data until the server blocks us. There, it changes his identity then continues the extraction. In our implementation, we parallelized the algorithm. By periodically executing this scrapper, we can collect time series of prices and thus be able to monitor their evolution. By using different sources we can also collect prices depend-ing on geography. This technique may work for other websites, but is particularly useful for this application.
Algorithm 1 scrapper with free identity renewal
while queue is not empty do Peek the queue to get an URL
Send this URL to the browser via the websocket connection if the web page returns an error then
Restart the browser with a new profile
Ask the TOR node via TOR Control for a new identity else
Extract data from the DOM Dequeue the URL
end if end while
3.2. Pricing Time Serie Visualisation
In order to make the data open and usable, we propose to use Linked Data. The data can then be easily reused ([El-Roby et al. 2018]). This is why data is sent to a Linked Data Platform as it is extracted. However, non-developer users should also be able to use the data. The raw database does not have much value for them because it is difficult to navigate. To solve this problem ([Agrawal et al. 2015]), we propose a price visualization method inspired by knowledge map ([Jadeja and Shah 2015], [Fionda et al. 2016]). We developed an implementation of this solution. The idea is to represent the products in the form of rectangles of different sizes. This intuitive interface allows non-developer users to navigate the data. The knowledge map approach is a very good way to view price time series. Since our food knowledge base may contain several similar products (for
example, several different types of milk), we index the data in a search engine to use the aggregation operator that allows us to retrieve the average price of a product: it is this average result that we are showing. For our implementation, we are using ElasticSearch ([Thacker et al. 2016]). The interface itself is built this way: thanks to the pricing time serie, users can select a time period from the top right input. A different color is assigned for each food category (dairy products, vegetables...). The color is dark if the price has decreased over the selected period, and light otherwise. At the top of the screen, it is possible to choose the geographical location of the displayed data. Finally, the size varies according to the price evolution over the selected period according to the following for-mula: ((priceend− pricebegin)/pricebegin) × 100. Currently, we show the products whose prices have changed the most so that the interface is not overloaded. In the future, we would like to add: the possibility to click on a product to see more details, and the ability to select a category to display more products.
4. Conclusion
This paper addressed the problem of creating a geolocalized time series knowledge base of food prices. We introduced our implementation capable of harvesting food prices over internet as time series. We applied a knowledge based interface allowing easy navigation over the big data of time series. In the future, we want to create a crowdsourcing platform to get the prices of shops without online catalog. The pricemap would then be important because it would give an immediate interest to the participants. We will also focus on performance optimisation, storage, consistency and how to improve the pricemap.
5. Acknowledgements
We would like to thank the LADaS workshop for accepting this paper. We would also like to thank Anderson Carlos Ferreira da Silva and Alexandra Fritzen for their advice.
References
[Agrawal et al. 2015] Agrawal, R., Kadadi, A., Dai, X., and Andres, F. (2015). Challenges and opportunities with big data visualization. In Proceedings of the 7th International Conference on Management of Computational and Collective intElligence in Digital EcoSystems, MEDES ’15, pages 169–173, New York, NY, USA. ACM.
[Andres 2018] Andres, F. (2018). The crwb rsbench: Towards a cooking recipe benchmark initiative. In Data Engineering Meets Intelligent Food and Cooking Recipe Workshop 2018 (DECOR 2018),ICDE2018. [Dingledine et al. 2004] Dingledine, R., Mathewson, N., and Syverson, P. (2004). Tor: The second-generation
onion router. In Proceedings of the 13th Conference on USENIX Security Symposium - Volume 13, SSYM’04, pages 21–21, Berkeley, CA, USA. USENIX Association.
[El-Roby et al. 2018] El-Roby, A., Ammar, K., Aboulnaga, A., and Lin, J. (2018). Sapphire: Querying rdf data made simple.
[Fionda et al. 2016] Fionda, V., Gutierrez, C., and Pirr`o, G. (2016). Building knowledge maps of web graphs. Artificial Intelligence, 239:143 – 167.
[Hernandez-Suarez et al. 2018] Hernandez-Suarez, A., Sanchez-Perez, G., Toscano-Medina, K., Martinez-Hernandez, V., Sanchez, V., and Perez-Meana, H. (2018). A web scraping methodology for bypassing twitter api restrictions.
[Jadeja and Shah 2015] Jadeja, M. and Shah, K. (2015). Tree-map: A visualization tool for large data. 1393:9–13.
[Thacker et al. 2016] Thacker, U., Pandey, M., and Rautaray, S. S. (2016). Performance of elasticsearch in cloud environment with ngram and non-ngram indexing. In 2016 International Conference on Electrical, Electronics, and Optimization Techniques (ICEEOT), pages 3624–3628.