INCORPORATION OF GREENHOUSE GAS EMISSION DYNAMICS FROM BOREAL RIVERS INTO THE GLOBAL CARBON CYCLE
THESIS PRESENTED AS PARTIAL REQUIREMENT TO THE PH.D IN BIOLOGY BY RYAN HUTCHINS JANUARY 2019
Avertissement
La diffusion de cette thèse se fait dans le respect des droits de son auteur, qui a signé le formulaire Autorisation de reproduire et de diffµser un travail de recherche de cycles supérieurs (SDU-522 - Rév.07-2011 ). Cette autorisation stipule que «Conformément à l'article 11 du Règlement no 8 des études de cycles supérieurs, [l'auteur] concède à l'Université du Québec à Montréal une licence non exclusive d'utilisation et de publication de la totalité ou d'une partie importante de [son] travail de recherche pour des fins pédagogiques et non commerciales. Plus précisément, [l'auteur] autorise l'Université du Québec à Montréal à reproduire, diffuser, prêter, distribuer ou vendre des copies de [son] travail de recherche à des fins non commerciales sur quelque support que ce soit, y compris l'Internet. Cette licence et cette autorisation n'entraînent pas une renonciation de [la] part [de l'auteur] à [ses] droits moraux ni à [ses] droits de propriété intellectuelle. Sauf entente contraire, [l'auteur] conserve la liberté de diffuser et de commercialiser ou non ce travail dont [il] possède un exemplaire.»
INCORPORER LA DYNAMIQUE DES GAZ À EFFET DE SERRE DES RIVIÈRES BORÉALES DANS LE CYCLE GLOBAL DU CARBONE
THÈSE PRÉSENTÉE
COMME EXIGENCE PARTIELLE DU DOCTORAT EN BIOLOGIE
PAR
RYAN HUTCHINS
First off, I would like to thank my supervisors Paul del Giorgio and Yves Prairie. They gave me the freedom to explore my research interests within a diverse and welcoming research group at the GRIL-UQAM. They fostered an environment that allowed me to take the time to learn statistical programming and geospatial analysis and modeling and were always able to help if I lost direction. I especially appreciate the patience and confidence you placed in me throughout the last six years. The research platform Paul provided through the research chair was world class but only reached its true potential because of his big picture insight for what questions were really important; this research intuition will continue with me after I am gone. Thank you both truly.
The research environment in the GRIL-UQAM was very synergetic during my time there. This is only because the group was the sum of its parts and more. . . and there were many, many parts ever changing over time. I could write 100 pages with all the ways all of the people contributed to my research, personal development and overall wellbeing. Without naming the plethora of people and events, I would like to acknowledge the diversity of ideas that could only have resulted from free and open expression of everyone's origins, gender, sexual orientation and neurodiversity. You all know how much you mean to me and it was a great honour to have you in my life for however long or short of period of time.
My international research internship funded by FQNRT under the direction of Thorsten Ditmar was indescribably important to everything. . . full stop. Thorsten is the most kind PI I have ever met and his group treated me like one of their
My research career would never have happened if not for my experiences at the University of Waterloo and my masters under the supervision of Sherry Schiff. Richard Elgood, you do the work of at least 3 people.
Nothing would have been possible without my family. Mom, dad, I know you had no preconceived expectations for your little monster of a double middle child (3 of 5) but from the day I was born you both supported all my hopes and dreams; no matter how whimsical it seemed at the time. My earliest memories are with my grandparents Edith and Howard Cruickshank and interacting with nature on their pasture, upland forest and lowland swamp where my curiosity sparked for why. Grandpa you are the example of steward of the land and as a human being. The Cruickshank's and my aunt Chris Hutchins unexpectedly gave me financial assistance that allowed me to pull through the hardest times of 10+ years of tuition and living well below a "living wage", thank you.
Katherine, I never would have carried on without you. My best friend, my love, and the smartest statistician I know. You were always there when I needed you.
LIST OF TABLES . LIST OF FIGURES RÉSUMÉ .. ABSTRACT INTRODUCTION 0.1 Context ... lX Xl XXl xxm 1 1 0.1.1 Northern Rivers in the Global Carbon Cycle . . . 2 0.1.2 Supersaturation of C02 and CH4 in boreal streams and
atmo-spheric flux . . . 3 0.1.3 The role of riverine dissolved organic matter quality in C02
supersaturation . . . 5 0.2 Thesis Objectives . 0.3 General Approach 0.3.1 Spatial Survey 0.3.2 Temporal Survey 0.3.3 DOM Characterization .
0.3.4 Statistical and Modeling Approach CHAPTER I
THE OPTICAL, CHEMICAL, AND MOLECULAR DISSOLVED ORGANIC MATTER SUCCESSION ALONG A BOREAL SOIL-STREAM-RIVER
6 7 9 9 9 10 CONTINUUM . . . 11 ABSTRACT . . . 13 1.1 Introduction . . . 13
1.2 Methods and Material 16
1.2.2 Field Measurements 1.2.3 Laboratory Analyses 1.2.4 Statistical analyses 1.3 Results and Discussion ..
17 18 22 26 1.3.1 Patterns in DOM composition along the soil-stream continuum 26 1.3.2 Linking DOM processing to the chemical and optical
charac-teristics of DOM along the soil-stream-river continuum . . . . 32 1.3.3 Shifts in molecular composition associated to selective
degra-dation of soil-derived DOM . . . 35 1.3.4 Soil DOM degradation as a pathway of C02 supersaturation in
the stream network . . . 42 1.4 Supplementary Tables and Figures . . . 48 CHAPTER II
LARGE-SCALE LANDSCAPE DRIVERS OF C02 , CH4 , DOC AND DIC
IN BOREAL RIVER NETWORKS . . . 57 ABSTRACT . . . 59 2.1 Introduction .
2.2 Methods and Material 2.2.1 Study Area ..
2.2.2 Field and Laboratory Analyses 2.2.3 GIS and Statistics ..
2.2.4 Literature comparison 2.3 Results . . . . 59 62 62 65 66 67 72 2.3.1 General stream and river characteristics . . . 72 2.3.2 Relationships between fluvial pC02 , pCH4 , and DOC, stream
chemistry and landscape properties and modeling C species 7 4 2.3.3 Regional effects on C species . . . 79
2.4 Discussion ... . 81
2.4.2 Network position and large-scale patterns in fluvial pC02 . . . 85
2.4.3 Large scale patterns and importance of regional climate for flu-vial CH4 . . . 87
2.4.4 The importance of landscape features for fluvial DOC . 87 2.4.5 Regional structure of fluvial dissolved carbon 88 2.4.6 Conclusions and implications 95 2.5 Supplementary Figures . . . 96
CHAPTER III THE RELATIVE IMPORTANCE OF WATERSHED FEATURES AND SEASONALITY IN DETERMINING THE VARIABILITY OF RIVERINE C02 , CH4 AND DOC ACROSS BOREAL QUÉBEC ... 103
ABSTRACT . . . 105
3.1 Introduction . . . 105
3.2 Methods . . . 108
3.2.1 Sampling Design 3.2.2 Field and Laboratory Analysis. 3.2.3 Flux and k600 Measurements . 3.3 Results . . . . 3.3.1 Regional differences and seasonal hydrology 3.3.2 Spatial-temporal patterns in pC02 3.3.3 Spatial-temporal patterns in pCH4 3.3.4 Spatial-temporal patterns in DOC 3.3.5 Seasonal patterns in pC02, pCH4 , fluxes and k600 108 108 109 110 114 119 121 124 127 3.4 Discussion . . . 128 CHAPTER IV MAGNITUDE AND REGIONAL PATTERNS IN INTEGRATED FLU-VIAL NETWORK GREENHOUSE GAS EMISSIONS ACROSS THE BO-REAL LANDSCAPE IN QUÉBEC ... 135
ABSTRACT . . . 137
4.2
Results and Discussion . . .142
4.2.1
Watershed and Stream Network Properties .142
4.2.2
Modeled Fluvial C02 and CH4 Surface Concentrations143
4.2.3
Modeling Stream Surface Emissions . . .144
4.2.4
Integrated Fluvial C02 and CH4 Emissions .146
4.2.5
Significance of N etwor k Emissions .151
4.3
Methods ...156
4.3.1
Stream Network Modeling156
4.3.2
Modeling stream gas concentrations .157
4.3.3
Modeling stream gas fluxes157
4.3.4
Annual Fluxes ....158
4.3.5
Watershed Properties .158
4.3.6
DOC and DIC export158
4.4
Supplementary Tables and Figures161
4.5
Stream Network, Area, Gas and Flux Modeling165
4.5.1
Stream N etwor k Modeling165
4.5.2
Stream Area . . .166
4.5.3
Discharge and Velocity .167
4.5.4
pC02 and pCH4 Propagation170
4.5.5
C02 and CH4 Fluxes171
4.6
DOC and DIC export175
CONCLUSION . .
177
Tu~ ~~
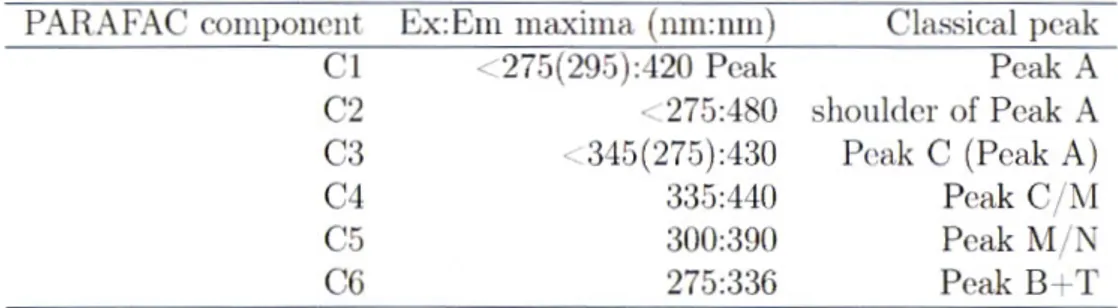
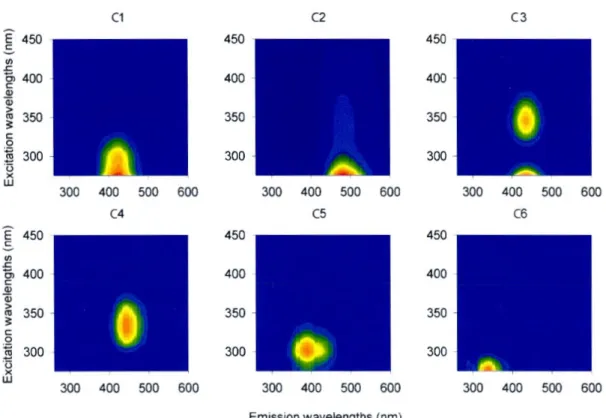
l.Sl Sampling sites, GPS coordinates and Strahler Ortler. All sites la-beled RC had riparian soil water collected. . . 48 1.82 Description of PARAFAC components as defined by Lapierre et al.
2014 and Stubbins et al. 2014 . . . 51 l.S3 PARAFAC Components and matches to the OpenFluor database
with 953 similarity. Note Quebec Boreal-69 was the model used for the dataset in the paper. For more information use ID# to look up the database at http://www.openfiuor.org/. . . 53 2.1 Information on sampling, regions, streams and their watersheds
with summary statistics: medians and quantiles (lst, 3rd) in paren-theses . . . 70 2.2 Water chemistry of sampled streams and rivers with summary
statis-tics: medians and quantiles (lst, 3rd) in parentheses . . . 71 2.3 Fixed effects of the linear mixed effects models used to predict
pC02 , pCH4 and DOC (±standard error) . . . 80
2.4 Random effects and regional intercepts from linear mixed effects models used to predict pC02 , pCH4 and DOC (±standard error) . 80
2.5 Regressions of regional random effects and average regional soil car-bon content (kg-C m-2 ), net primary production (NPP, kg m-2 yr-1, from Foley et al. (1996)) and mean annual temperature (MAT, °C) (±standard error) . . . 81 3.1 Sampling information and regional watershed landscape.
Water-shed characteristics are shown as median values with the interquan-tile range in parentheses. . . 111 3.2 Annual and seasonal measurements with summary statistics for
3.3 Summary table of the ANCOVA for pC02 , pCH4 and DOC,
show-ing the intercepts (
E)
for each season . . . 121 4.1 Characteristics of modeled watersheds, the watershed codecorre-sponds to the map labels on Figure 1 . . . 159 4.2 Summary of C02 and CH4 emissions per area of landscape and
other measures (reported or calculated) related to the terrestrial C budget from published studies of streams/rivers in temperate and boreal regions . . . 160 4.Sl Long term mean annual discharge measurements across northern
Québec and watershed area (data source: Québec Ministère du Développement durable, de l'Environnement et de la Lutte contre les changements climatiques) . . . 167 4.82 NPP used in models of pC02 and pCH4 . . . 17 4 4.83 DOC and DIC (mg L-1) concentrations from high order streams
Figure
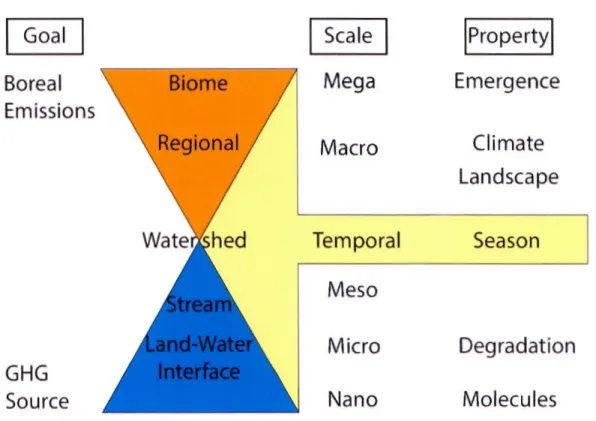
0.1 General Approach towards the two major goals of the thesis. There is a separation of scales with goals 1) sources of C02 and CH4
en-compassing the small and 2) boreal emissions the large. Whereas, the temporal scale acts on sizes. The property at each scale
repre-Page
sents the controls investigated in the approach to reach both goals. 8 1.1 Comparison of soil water and streams (Strahler Orders 1-4) for
a) dissolved organic matter carbon concentration (DOM-[C]), b) colored dissolved organic matter (CDOM), and c) CDOM:DOM-[C] ratio. Boxplots show the median, first and third quartiles, and whiskers extend to the furthest data point that is within 1.5 times the interquartile range; points are outliers. Asterisks
(*)
indicate significant differences (Wilcoxon rank sum test, p-value<
0.01). . 27 1.2 a) dissolved organic matter carbon concentration (DOM-[C]) ona loglü axis, b) deuterium excess ( d-excess)
(%0)
along the soil-stream-river continuum from soil water (SW) to Strahler Ortler 4, c) median values of DOM-[C] and d-excess binned to network position ( soil water and Stream Orders 1-4) with a linear regression (R2 adjusted 0.92, p-value 0.006). Boxplots show the median, firstand third quartiles, and whiskers extend to the furthest data point that is within 1.5 times the interquartile range; points are outliers. 28 1.3 Comparison of DOM-[C] fraction concentrations from size-exclusion
chromatography by LC-OCD in soil water and streams (Strahler Orders 1-4), concentrations of carbon in a) Biopolymers, b) Low Molecular Weight (LMW) Neutrals, c) Building Blocks and d) Hu-mic Substances fractions. Boxplots show the median, first and third quartiles, and whiskers extend to the furthest data point that is within 1.5 times the interquartile range; points are outliers. As-terisks
(*)
indicate significant differences (Wilcoxon rank sum test, p-value<
0.02). . . 291.4 Contribution of DOM fractions from size-exclusion chromatogra-phy by LC-OCD to total DOM-[C] along the soil-stream-river con-tinuum from soil water (SW) to Strahler Order 4. Fractions: a) Biopolymers, b) Low Molecular Weight (LMW) N eutrals, c) Build-ing Blocks fractions and d) Humic Substances. Boxplots show the median, first and third quartiles, and whiskers extend to the fur-thest data point that is within 1.5 times the interquartile range; points are outliers. . . 30 1.5 Redundancy analysis of PARAFAC components and LC-OCD
frac-tions. LC-OCD fractions: Biopolymers (BP), Humic Substances (HS), Building Blocks (BB), Low Molecular Weight Neutrals (LMW-N). PARAFAC components: Cl-C5 (humic-like) and C6 (protein-like). PARAFAC components were normalized to total sample flu-orescence and LC-OCD fractions were normalized to total sample DOM-[C]. The first axis, explaining 48.13 of the co-variation, rep-resents a DOM degradation and compositional axis, with the two extremes related to the two dominant fractions of DOM (Biopoly-mers/LMW Neutrals and Humic Substances) that were selectively removed along the soil-stream-river continuum. . . 34 1.6 Comparison of molecular groups from FT-ICR-MS in soil water
and streams (Strahler Orders 1-4). a) Peptides, b) Unsaturated Aliphatics, c) Saturated Fatty Acids, d) Polyphenols, e) Phenols, and f) Highly Unsaturated Compounds. Molecular groups are magnitude-weighted to relative peak intensity of the group and expressed as a percent of contribution to total sample peak in-tensity. Boxplots show the median, first and third quartiles, and whiskers extend to the furthest data point that is within 1.5 times the interquartile range; points are outliers. Asterisks
(*)
indicate significant differences (Wilcoxon rank sum test, p-value<
0.02). . 37 1. 7 Color-coded correlations of molecule-specific intensities with thecanonical axis of DOM molecular space associated with the re-dundancy analysis axis 1 of PARAFAC components and LC-OCD fractions (Fig. 5), identifies the molecular subpopulations in Van Krevelen Space related to shifts in DOM composition in soil wa-ter and stream samples. For example, red colored molecules are associated with Biopolymers, Low Molecule Weight Neutrals and PARAFAC component C6 (the negative end of redundancy analy-sis axis 1) generally higher in soil water samples and degraded in the soil-stream interface. . . 39
1.8 Redundancy analysis of LC-OCD fractions (BP - Biopolymers, HS - Humic Substances, BB - Building Blacks, LMW-N - Low Molecular Weight Neutrals) and molecular groups from FT-ICR-MS. LC-OCD fractions were normalized to total sample DOM-[C] and molecular groups as percent contribution of total peak inten-sity of FT-ICR-MS in a sample. The first axis explaining 31.03 of their total co-variation, shows similar patterns to those in Figures 5 and 7 with the negative end of the axis (Biopolymers and LMW Neutrals) associated to peptides, saturated fatty acids and unsat-urated aliphatics, and the positive end (Humic Substances) with phenols and polyphenols. . . 41 1.9 Median C02 fluxes measured using fl.oating chambers, and median
degradation rates of total dissolved organic matter carbon con-tent (DOM-[C]), Biopolymers (BP), Low Molecular Weight Neu-trals (LMW-N), Humic Substances (HS) and Building Blacks (BB) estimated from a first order approximation using the difference be-tween soil water and stream water. Floating chamber measure-ments were bootstrapped 10 000 times for each Strahler Stream Order (1-4) and pooled; bar shows the median value of the pooled bootstrapped values and error bars show the quartiles. Degradation rates were calculated from bootstrapped (10 000 times) soil water concentrations and each Strahler Orcier (Eq. 2-4) and pooled; bars show median rates from pooled bootstrapped calculations and error bars show the quartiles. HS rates exclude Orcier 1 streams which showed no significant difference with soil waters. . . 45 l.Sl Annual average daily discharge for the Moisie River a Strahler
Or-cier 8 river in the Cote-Nord region. Points are 2013 discharge and the line is the average discharge from 1965 to 2017. The summer base-fl.ow sampling period is shown in red. (data source: Québec Ministère du Développement durable, de !'Environnement et de la Lutte contre les changements climatiques) . . . 51 l.S2 Fluorescence signatures of the components identified by the PARAFAC
model (see Lapierre et al. 2014, http://www.openfl.uor.org/ dataset ID#69) . . . 52 1.S3 DOC concentrations from LC-OCD and TOC analyser with 1:1 line 54 l.S4 Downstream trends of fractions from LC-OCD-OND measurements 55
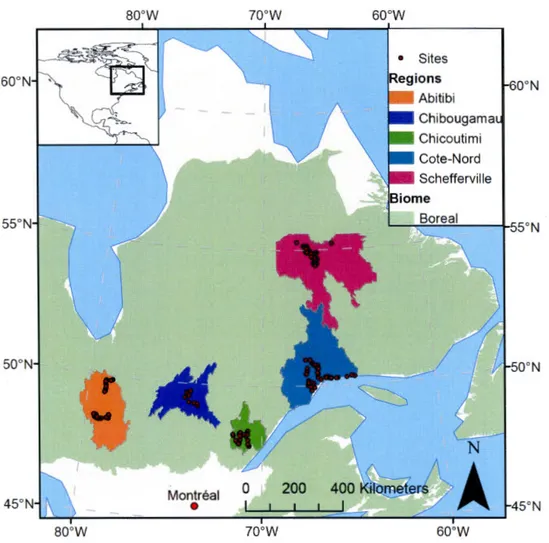
2.1 Map of the boreal biome in Québec, regions sampled and the 190 stream and river sites sampled . . . 64
2.2 Relationships of a) partial pressure of C02 (pC02) versus partial
pressure of CH4 (pCH4), b) pC02 versus dissolved organic car bon
(DOC) and c) pCH4 versus DOC in ri vers and streams in boreal Québec, Canada . . . 7 4
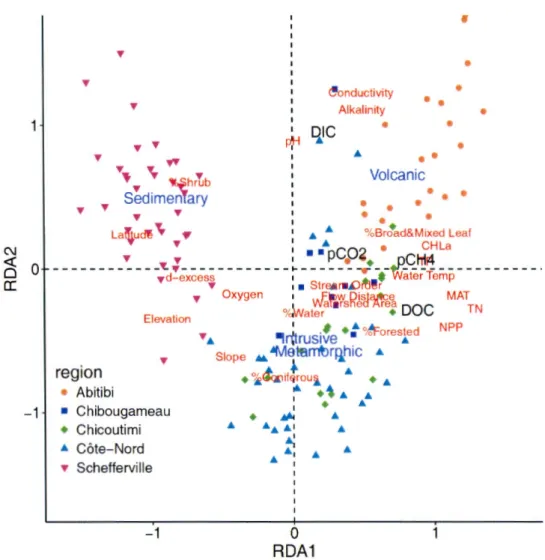
2.3 Ordination plot of redundancy analysis (RDA) of pC02 , pCH4,
dis-solved organic carbon (DOC) and disdis-solved inorganic carbon (DIC) with watershed landscape properties (latitude, watershed slope, elevation, stream order, flow distance, mean annual temperature (MAT), net primary production (NPP), percent total forest, per-cent coniferous, perper-cent broadleaf and mixed wood, perper-cent shrubs and herbs, and water) and water chemistry (pH, conductivity, al-kalinity, dissolved oxygen, total nitrogen (TN), total phosphorus (TP), and chlorophyll a). In blue are factor centroids of bedrock type, points are sites which are colored-coded by region correspond-ing to the color scheme in Figure 1. pC02 , pCH4, and DOC all were
related to climate, topography and nutrients while DIC was related to the dominant bedrock geology. . . 75
2.4 Ordination plot of redundancy analysis (RDA) of pC02 , pCH4, and
dissolved organic carbon (DOC) with watershed landscape proper-ties (latitude, watershed slope, elevation, stream order, flow dis-tance, mean annual temperature (MAT), net primary production (NPP), percent watershed water and forest coverage) which can be all obtained remotely. Points are sites which are colored-coded by region corresponding to the color scheme in Figure 1. There is a clear separation between regions with variables relating to climate and topography with pC02 , pCH4, and DOC positively related to
warmer and flatter watersheds. pC02 showed less of an effect of
cli-mate /topography than pCH4 and DOC but was related to network position (Strahler order, flow distance,
%
water). . . . 782.5 Regional intercepts from mixed effects models predicting pC02 ,
pCH4 and dissolved organic carbon (DOC) and the relationship with average regional soil carbon content (IGBP-DIS, 1998) and average regional net primary production (NPP) (Foley et al., 1996). Units are log µatm for pC02 and pCH4 and log mg L-1 DOC. This
shows that the regional baseline amount of the three car bon species relates to broader landscape properties from maps with a global distribution. . . 89
2.6 Modelled pC02 using log(pC02 )
=
-0.293*Log(Flow Distance)+4.480*NPP+8.304 compared with recent studies in the boreal biome with information on C02 and network position. This includes
data from Alaska (Crawford et al., 2013), Finland (Huotari et al., 2013a), Krycklan Sweden (Wallin et al., 2013) and Lappland Swe-den (Giesler et al., 2013; Lundin et al., 2013). The 1:1 line of modelled and measured pC02 is shown. . . 92
2. 7 Modelled pCH4 using log(pCH4 ) = -0.00328*Elevation+ 15. 7 42*NPP+0.318 compared with the average pCH4 from different locations in the
bo-real biome from global CH4 database (methDB; Stanley et al. 2016.
This includes data from Alaska/Yukon (Clilverd et al., 2008; Striegl et al., 2012; Crawford et al., 2013), Finland (Silvennoinen et al., 2008; Dyson et al., 2011; Juutinen et al., 2013; Huotari et al., 2013a) and Russia (Flessa et al., 2008; Wallin et al., 2014; Gar'kusha & Fedorov, 2014). The hallow points represent median pCH4 values
from each region from this study in Québec with the model output. The 1:1 line of modelled and measured pCH4 is shown. . . 93
2.8 Modelled dissolved organic carbon (DOC) using log(DOC)
=
-0.00106*Elevation+ 7.937*NPP+2.081 compared with the average DOC from different locations in the boreal biome from synthesis by Laudon et al. (2012). This includes data from Alaska (Petrone et al., 2006), east-central Finland(Sarkkola et al., 2009; Rantakari et al., 2010), Russia (Pekka et al., 2004), northern-central Sweden (Laudon et al., 2004; Agren et al., 2007), Lappland Sweden (Laudon & Bishop, 1999; Lyon et al., 2010; Olefeldt & Roulet, 2012). The hallow points represent median DOC concentrations from each re-gion from this study in Québec with the model output. The 1:1 line of modelled and measured DOC concentrations is shown. . . . 94
2.81 Boxplots partial pressure of C02 (pC02), partial pressure of CH4
(pCH4), dissolved organic car bon (DOC) with Strahler order in rivers and streams in boreal Québec, Canada divided by five re-gions: Abitibi, Chibougameau, Chicoutimi, Côte-Nord, and Schef-ferville. . . 97
2.82 Relationship between partial pressure of C02 (pC02) and partial
pressure of CH4 (pCH4 ) separated by region. . . 98
2.83 Modelled pC02 using log(pC02) = -0.293*Log(Flow Distance)+ 0.213*SoilC+8. 735 compared with recent studies in the boreal biome with information on C02 and network position. This includes
data from Alaska (Crawford et al., 2013), Finland (Huotari et al., 2013a), Krycklan Sweden (Wallin et al., 2013) and Lappland Swe-den (Giesler et al., 2013; Lundin et al., 2013). The 1:1 line of modelled and measured pC02 is shown. . . 99
2.84 Modelled pCH4 using log(pCH4) = -0.00328*Elevation+0.675*Soi1C+0.318 compared with the average pCH4 from different locations in the
bo-real biome from global CH4 database (methDB; Stanley et al. 2016.
This includes data from Alaska/Yukon (Clilverd et al., 2008; Striegl et al., 2012; Crawford et al., 2013), Finland (Silvennoinen et al., 2008; Dyson et al., 2011; Juutinen et al., 2013; Huotari et al., 2013a) and Russia (Flessa et al., 2008; Wallin et al., 2014; Gar'kusha & Fedorov, 2014). The hallow points represent median pCH4 values
from each region from this study in Québec with the model output. The 1:1 line of modelled and measured pCH4 is shown. . . 100
2.85 Modelled dissolved organic carbon (DOC) using log(DOC)
=
-0.00106*Elevation+0.322*SoilC+3.21 compared with the average DOC from different locations in the boreal biome from synthesis by Laudon et al. (2012). This includes data from Alaska (Petrone et al., 2006), east-central Finland(Sarkkola et al., 2009; Rantakari et al., 2010), Russia (Pekka et al., 2004), northern-central Sweden (Laudon et al., 2004; Agren et al., 2007), Lappland Sweden (Laudon
& Bishop, 1999; Lyon et al., 2010; Olefeldt & Roulet, 2012). The
hallow points represent median DOC concentrations from each re-gion from this study in Québec with the model output. The 1: 1 line of modelled and measured DOC concentrations is shown. . . . 101
3.1 Annual average daily discharge for the Kinojevis River a Strahler Ortler 7 river in the Abitibi region. Black line is 2010-2011 dis-charge, the blue dots are sampling times of the Kinojevis River and the red line is the average discharge from 1969 to 2017. (data source: Québec Ministère du Développement durable, de !'Environnement et de la Lutte contre les changements climatiques) . . . 115
3.2 Annual average daily discharge for the Pikauba River a Strahler Ortler 5 river in the Chicoutimi region. Black line is 2011-2012 discharge, the blue dots are sampling times of the Pikauka River and the red line is the average discharge from 1969 to 2017. (data source: Québec Ministère du Développement durable, de !'Environnement et de la Lutte contre les changements climatiques) . . . 116
3.3 Boxplots of 6180-H
20 in rivers and streams from Abitibi and Chicoutimi
by season. Boxplots show the median, first and third quartiles, and whiskers extend to the furthest data point that is within 1.5 times the interquartile range; points are outliers. . . 117
3.4 Boxplots of d-excess in rivers and streams from Abitibi and Chicoutimi by season. Boxplots show the median, first and third quartiles, and whiskers extend to the furthest data point that is within 1.5 times the interquartile range. . . 118
3.5 Monthly 6180-H
20 of precipitation collected at Chapais, Québec
(49.8° N, 74.9° W) from 1997 to 2010. Boxplots show the median,
first and third quartiles, and whiskers extend to the furthest data point that is within 1.5 times the interquartile range; points are outliers. (data source: Global Network of Isotopes in Precipitation) 119
3.6 Boxplots of a) pC02 , b) pCH4 and c) DOC concentrations in 13 streams and rivers in Abitibi from June 2010 to May 2011 and 10 streams and rivers in Chicoutimi from June 2011 to June 2012, grouped by season. Different letters indicate significant differences (Wilcoxon rank sum test, p value
<
0.05). Boxplots show the me-dian, first and third quartiles, and whiskers extend to the furthest data point that is within 1.5 times the interquartile range; points are outliers. . . 1233.7 Boxplots of surface water a) gas exchange coefficient (k600 ) b) C02
flux and c) CH4 flux in 13 streams and rivers in Abitibi from June 2010 to May 2011 and 10 streams and rivers in Chicoutimi from June 2011 to June 2012 grouped by season. The winter season is absent since fluxes were not measured during ice-cover. Different letter indicate significant differences (Wilcoxon rank sum test, p value <0.05). Boxplots show the median, first and third quartiles, and whiskers extend to the furthest data point that is within 1.5 times the interquartile range; points are outliers. . . 126
4.1 Watersheds from the Canadian National Hydrological Network for which the stream networks were modeled. Labels are Water Survey of Canada sub-sub-drainage area codes. The area shaded in green is the North American boreal zone from Brandt (2009). . . 142
4.2 Boxplots of area specific fluvial C02 and CH4 emissions from mod-eled watersheds (medians of 10,000 Monte Carlo analysis iterations) on a log10 scale. "Watershed" labelled emissions are normalized to
the entire watershed landscape area and "fluvial" labelled emissions are normalized to the total area of the fluvial network within the watershed. Boxplots show the median, first and third quartiles, and whiskers extend to the furthest data point that is within 1.5 times the interquartile range; points are outliers. . . 146
4.3 Annual total network fluvial emissions in g C m-2 yr-1 of a) C0 2
against percent of total stream network surface area within the watershed, b) C02 against total watershed area, c) C02 against
average watershed slope, d) CH4 against percent of total stream network surface area within the watershed, e) CH4 against total
watershed area, and f) CH4 against average watershed slope. Points are medians and error bars are 5th and 95th confidence interval percentiles of 10,000 Monte Carlo analysis iterations. . . 149
4.4 Annual total network fluvial emissions in g C m-2 yc1 of a) C0 2
against average watershed net primary production (NPP) g C m-2 yr-1 ,
b) C02 against mean annual temperature (MAT) in °C, c) C02
against watershed surface soil organic C content, the amount in the active layer of soil (0-30 cm) kg C m-2 , d) CH4 against
av-erage watershed NPP g C m-2 yr-1, e) CH
4 against mean annual
temperature (MAT) °C, and f) CH4 against watershed surface soil
organic C content kg C m-2 . Points are medians and error bars are 5th and 95th confidence interval percentiles of 10,000 Monte Carlo analysis iterations. . . 152 4.5 Boxplots of terrestrial landscape carbon losses/input of the
mod-eled watersheds: C02 emissions, DOC export, DIC export and
total fluvial loss (C02+DOC+DIC) and terrestrial net ecosystem
production (NEP) from Turner et al. (2013). Boxplots show the median, first and third quartiles, and whiskers extend to the fur-thest data point that is within 1.5 times the interquartile range; points are outliers. . . 154 4.6 Watershed slope against total watershed annual C02 emissions as
an estimated a) ratio of downstream export of dissolved organic car-bon (DOC) and dissolved inorganic car car-bon (DIC) and, b) percent of terrestrial net ecosystem production (NEP) . . . 155 4.81 Boxplot of proportion of area in each 8trahler stream order from
all modeled watersheds (n=19x8) . . . 161 4.82 Boxplot of modelled stream widths in each 8trahler stream order
from all modelled points in all watersheds (n=9,514,049). Red dots represent global width estimates by Downing et al. 2012 . . . 161 4.83 Example of modeled stream network with assigned pC02 from
pC02 = exp(-0.293 x log(L) +4.480 x NPP+8.304) ... 162 4.84 Boxplot of modeled pC02 from all points in all watersheds by
8trahler stream order (n=9,514,049) . . . 162 4.85 Boxplot of modeled pCH4 from all point in all watersheds by 8trahler
stream order (n=9,514,049) . . . 163 4.86 Boxplot of modeled point C02 fluxes from all points in all
4.87 Boxplot of modeled point CH4 fluxes from all points in all
water-sheds by 8trahler stream order (n=9,514,049) . . . 164 4.88 Boxplot of the proportion of modeled point C02 fluxes per Strahler
stream order from all watersheds (n=19x8) . . . 164 4.89 Boxplot of the proportion of modeled point CH4 fluxes per 8trahler
stream order from all watersheds (n=19x8) . . . 165 4.810Log stream width (m) and flow length measurements from Hutchins
et al. (2019). Model fit: log(W) = 0.0958 x log(L)2 - 0.954 x log(L)
+
2.02, R2 = 0.58, n = 173 . . . 1664.811Watershed area and mean annual discharge relationship from 54 streams and rivers across northern Québec (Table 81) log(Q) = 0.96 x log(A) - 3.62, R2 = 0.99, n = 54 . . . 167
4.812Comparison between histograms of modeled stream network veloci-ties (left, n=9,514,049) and velociveloci-ties (right, n=287) from measure-ments of streams and rivers in Northern Quebec . . . 170 4.813Histograms of modeled stream network gas exchange coefficients
Le bilan carbone actuel de la Terre accumule rapidement du C02 et du CH4 ,
tous deux des gaz à effet de serre (GES) présents dans l'atmosphère. Le biome boréal est un composant majeur de ce bilan, puisqu'il détient parmi les plus grands stocks de matière organique en ses sols, particulièrement les tourbières, le comp-tant comme un puits majeur de carbone. Cette région possède également une forte densité d'eau sous la forme entre autres de réseaux fluviaux. Même s'ils n'occupent qu'une petite superficie de cette région, les ruisseaux et rivières représentent d'importantes zones d'activité biogéochimique, en transportant, transformant et émettant de grandes quantités de C vers l'atmosphère. Dès lors, ces émissions ont le potentiel de compenser une partie du puits de C terrestre. Toutefois et malgré leur importance, ces flux restent mal intégrés au sein des bilans de car-bone terrestre du biome boréal. La complexité, l'étendue et l'éloignement des réseaux :fluviaux de cette région, expliquent en partie que les émissions de GES, leurs sources ainsi que leur régulation soient mal quantifiées.
Au cours de cette thèse, 1) j'ai exploré les patrons de transformation de la matière organique (DOM) au sein des réseaux fluviaux et sa contribution dans le maintien de la sursaturation en C02 de continuums fluviaux, 2) j'ai exploré les patrons
spatiaux et temporels des concentrations et émissions de C02 et CH4 des réseaux
fluviaux boréaux, 3) j'ai ensuite développé des modèles empiriques établissant le relation entre la concentration fluviale des gaz à effet de serre et les caractéristiques environnementales, climatiques et géographiques du paysage. Enfin, 4) à l'aide des outils développés dans les chapitres précédents, j'ai pu reconstruire les émissions de GES à l'échelle du réseau fluvial entier et ce, pour plusieurs grands bassins versants boréaux. J'ai ensuite replacé ces flux intégrés dans le contexte du bilan de C terrestre. L'étude consistait en l'échantillonnage de 455 sites fluviaux répartis dans la région boréale du Québec, avec un gradient important de taille des bassins hydrographiques, du climat, de géomorphologie et de végétation, auquel s'ajoutait un aspect saisonnier visant à capturer la variabilité des différentes espèces de C au sein des réseaux fluviaux boréaux.
Bien qu'il existe une relation entre la concentration en C02 des rivières et celle
de la DOM dérivée du sol, sa contribution à la sursaturation des cours d'eau reste toutefois méconnue. En utilisant des méthodes avancées de caractérisation de la DOM, le chapitre 1 démontrait la dégradation sélective de la DOM le long
du continuum sol-rivière. L'interface sol-cours d'eau se trouvait être une région particulièrement active de la dégradation de la DOM, où les composés les plus biolabiles étaient préférentiellement éliminés. La DOM de nature aromatique, était quant à elle, sélectivement photo-minéralisée dans la rivière et ce, tout au long du continuum. Le C02 produit à la fois à l'interface sol-cours d'eau et dans
la colonne d'eau elle-même, pourrait être responsable de plus de la moitié des émissions fluviales de C02 •
En utilisant une approche interrégionale, les principaux résultats ont montré que les espèces fluviales de C (C02 , CH4 et DOM) pouvaient être modélisées en
fonc-tion des propriétés du paysage et du climat régional (Chapitre 2) et que cette variation spatiale l'emportait largement sur les effets saisonniers (Chapitre 3). Les effets régionaux étaient communs pour le C02 , le CH4 et la DOM, suggérant
l'existence de « baselines
»
régionales du C fortement liées en particulier à la production primaire nette (NPP) ainsi qu'à la teneur moyenne régionale en C des sols. Le CH4 et la DOM semblaient plus sensibles aux différences régionales de climat et donc plus susceptibles de varier si en fonction desÀ l'aide des modèles développés dans les chapitres 2 et 3, le chapitre 4 décrivait la modélisation des émissions annuelles fluviales intégrées de C02 et de CH4 dans
de grands bassins versants de la région boréale du Québec. Le but étant d'évaluer la variation de cette propriété émergente du paysage en fonction du climat et en relation avec d'autres composants du budget C du paysage. Nos résultats dé-montraient que les émissions fluviales intégrées n'étaient pas fonction de la taille des bassins versants, ni de la densité des rivières dans notre gamme de bassins versants boréaux, mais bien de la pente des bassins versants. En rapprochant ce modèle avec ceux des écosystèmes terrestres, nous avons démontré que les émis-sions fluviales boréales pourraient compenser jusqu'à 203 du puits C terrestre, d'où l'importance de considérer cette composante dans le bilan C du paysage. Dans l'ensemble, cette thèse atteste de l'importance des approches à l'échelle in-terrégionales et à l'échelle de réseaux fluviaux entiers, dans la compréhension des émissions fluviales de GES sur les vastes zones et éloignées du biome boréal. Les «
baselines » régionales de C et les émissions fluviales intégrées sont des propriétés émergentes du biome et constituent des outils pour déterminer les compensations potentielles du puits de C terrestre, de plus en plus affecté par les activités an-thropiques.
The current carbon balance of Earth is accumulating C02 and CH4 , both
green-house gases (GHG), in the atmosphere rapidly. The boreal biome is an important component of this balance as it contains among the largest stocks of organic matter in soils and peatlands in the biospehere, and is potentially a large contemporary land sink of carbon. The boreal biome also contains the highest densities of water, including extremely complex fluvial networks. Despite occupying a small area in the landscape, streams and rivers in this region are major hotspots of biogeochem-ical activity, transporting, processing and emitting C large amounts of C to the atmosphere. These fluvial C emissions have the potential to offset a portion of the C land sink, yet they are currently not well incorporated into the land carbon budget of the boreal biome. Fluvial emissions of GHGs (C02 , CH4 ) in the boreal
biome, their sources and their regulation are poorly quantified, in part due to the complexity, vastness and remoteness of this region and its fluvial networks. In this thesis, I have 1) have explored the patterns of organic matter processing within fluvial networks and addresses the role of dissolved organic matter (DOM) degradation in fueling C02 in the fluvial continuum, 2) explored the spatial and
temporal patterns in C02 and CH4 concentrations and emissions across boreal
fluvial networks, 3) have developed empirical models linking fluvial GHGs to en-vironmental, climatic and geographic features across the boreal landscape, and 4) have used the above tools to reconstruct GHG emissions at the whole fluvial net-work scale for several major boreal watersheds, and place these integrated fluvial GHG emissions within the context of the land C budget. The research involved sampling of, 455 fluvial sites distributed in boreal Québec across a large scale with large gradient in watershed size, climate, geomorphology, and vegetation with a seasonal component to capture variability of fluvial C species in the boreal biome. There is a link between fluvial C02 and soil-derived DOM, however, to what extent
its degradation sustains C02 supersaturation is not well known. Using advanced
DOM characterisation methods, Chapter 1 showed there was clear sequence of selective DOM degradation along the soil-stream-river continuum. The soil-stream interface was a hotspot of DOM degradation where the most biolabile compounds were selectively removed. In the stream channel, aromatic DOM was selectively photo-mineralized along the stream continuum. C02 mineralized in both the
soil-stream interface and the soil-stream channel from soil-derived DOM could potentially sustain over half of C02 emissions.
Using a cross regional approach, the main results showed fluvial C species, C02 ,
CH4 and DOM, could be modeled as a fonction of landscape properties and
re-gional climate (Chapter 2) and that such spatial variation greatly outweighed seasonal effects (Chapter 3). The regional effects were common for C02, CH4 and
DOM suggesting there are regional C baselines which were strongly related to average regional soil C content and especially to net primary production (NPP). CH4 and DOM appeared to be more sensitive to regional differences in climate
and therefore more likely to shift under future scenarios of change in northern landscapes.
Using the models developed in Chapter 2 and Chapter 3, Chapter 4 modeled integrated annual network fluvial C02 and CH4 emissions for large watersheds across boreal Québec, to evaluate how this emergent landscape property varies as a fonction of landscape and climate properties, and how it relates the other components of the landscape C budget. These integrated fluvial emissions, were not related to watershed size or density of rivers across a range of boreal water-sheds, but watershed slope was an emergent driver of these integrated emissions. Pairing with terrestrial ecosystem models indicates that boreal fluvial emissions could offset as much as 20% of terrestrial C sink indicating this component is significant in landscape C budget.
Together, the chapters of this thesis show to understand fluvial GHG emissions over vast and remote areas of boreal biome require cross-regional and whole net-· work approaches. Regional C baselines and integrated fluvial emissions are emerg-ing properties of the biome that can be used to determine the potential offsets of a major landscape C sink in the Earth's carbon cycle increasingly impacted by anthropogenic activities.
0.1 Context
Water and carbon are essential for all known life. Water's unique polar and sol-vent properties make it indispensable for all lifeforms, whereas, carbon is required for the biochemistry of living. Together the cycling of water and carbon in the biosphere of Earth sustain the ecosystems required for all higher life. The inter-action between the biosphere and the carbon cycle, in particular, has shaped all biota on Earth. The modern carbon cycle arose during the Proterozoic Eon (2400 million years ago) with the advent of photosynthesis which fixed C02 from the
atmosphere with 02 as a waste product causing one of the greatest extinction
events in Earth's history (Canfield & Teske, 1996). During the Devonian Period ( 419 million years ago) plants colonized land creating the first soils, further drop-ping the C02 in the atmosphere to near modern levels (Algeo et al., 2001). In the
last 500,000 years, C02 in the atmosphere has varied between 180 to 280 ppm on
100,000 year cycles (Petit et al., 1999). However, since the industrial revolution,
300 years ago, humans have extracted carbon that was fixed by plants over hun-dreds of millions of years and released it to the atmosphere, raising atmospheric C02 from 280 to above 400 ppm (Mackenzie et al., 2002; Monastersky, 2013). In
this new epoch, the Anthropocene, it is essential to understand the natural global carbon cycle and how it might change in the near future and how it will effect the biosphere.
0.1.1 Northern Rivers in the Global Carbon Cycle
Soils represent the largest organic carbon reservoir on Earth with the highest den-sities at higher latitudes contained in the boreal biome (Tifafi et al., 2018). The half-life of organic carbon is longer in soils than within inland waters where de-cay rates are the highest with the shortest retention times (Catalan et al., 2016). Thus, the land-water interface and streams and rivers, with the shortest reten-tion times of the aquatic continuum, are hotspots of organic carbon degradareten-tion. Although streams and rivers represent a small fraction of the terrestrial land-scape they drain, they are responsible for a disproportionately large amount of carbon processing, emission and export, and in this way contribute significantly to regional (Teodoru et al., 2009; Koprivnjak et al., 2010; Lundin et al., 2013; Wallin et al., 2013; Campeau et al., 2014) and global (Cole et al., 2007; Raymond et al., 2013; Drake et al., 2017) C budgets and may be particularly important at northern latitudes which represent the largest land C sink (Steinkamp & Gru-ber, 2015). Terrestrial carbon enters rivers and streams throughout watersheds and is degraded, mineralized and degassed throughout the continuum (Hotchkiss et al., 2015). Rivers are as a result systematically supersaturated with greenhouse gases (GHGs), C02 and CH4 , and are therefore net emitters to the atmosphere
(Bastviken et al., 2011; Raymond et al., 2013). Rivers are also the main vec-tors of the export of dissolved organic and inorganic carbon (DOC and DIC) from land to the oceans, and sites of major transformation and mineralization of this terrestrially-derived DOC (D'Amario & Xenopoulos, 2015; Rasilo et al., 2017; Hutchins et al., 2017). Despite the importance of these various C pools in northern rivers and streams, the magnitude of these carbon fluxes and the environmental factors and processes regulating them are still not fully understood.
0.1.2 Supersaturation of C02 and CH4 in boreal streams and atmospheric flux
The overwhelming majority of streams and rivers are supersaturated in C02 (Ray-mond et al., 2013; Lauerwald et al., 2015; Marx et al., 2017). C02 supersaturation in streams is caused by aquatic respiration, photooxidation of organic carbon and export of C02 respired in soils and shallow groundwater (Hope et al., 1994; Ôquist et al., 2009; Humborg et al., 2010; Giesler et al., 2013; Hotchkiss et al., 2015; Marx et al., 2017). Therefore, since dissolved organic car bon (DOC) is an important energy source for heterotrophic bacteria and is readily mineralized to C02 , this should be considered. However, DOC is a complex mixture of compounds and its composition can change without observable changes in concentration. Thus, DOC quality must be considered as well as the quantity. For example, low-molecular weight fractions of DOC have been shown to be more bioavailable to bacteria than larger fractions (Âgren et al., 2008). Yet, the relative contribution of terres-trial versus aquatic respiration to C02 supersaturation has yet to be disentangled
(Humborg et al., 2010; Giesler et al., 2013; Hotchkiss et al., 2015). Similarly, CH4 is utilized by bacteria and oxidized to C02 . CH4 from boreal ri vers is also an important contributor to regional GHG emission from the aquatic system but is rarely considered (Campeau et al., 2014; Rasilo et al., 2017; Campeau et al., 2018a). In general, GHG dynamics in rivers are dependent on physical (geology, geomorphology, hydrology, and gas exchange), chemical (pH and redox condi-tions) and biological (production, decomposition, and respiration) factors. These interdependent factors have generally been studied independently, resulting in an incomplete picture of the dynamics of carbon in rivers. Therefore, there is a need for comprehensive studies covering large environmental gradients in order to understand the dynamics of GHG emissions in rivers.
de-composition of organic matter (Hope et al., 1994; Cole & Caraco, 2001). In addition to in-situ processes, C02 enters ri vers from shallow groundwater ( soils and mineral dissolution) (Ôquist et al., 2009; Humborg et al., 2010). Recent evi-dence from stable isotopes suggests that C02 in streams has a strong respiration signature (Giesler et al., 2013; Venkiteswaran et al., 2014; Campeau et al., 2017; Deirmendjian & Abril, 2018). Thus, most of C02 in rivers and streams cornes
from biological degradation of organic matter either in-situ or in groundwater and soils.
CH4 is primarily produced in soils and sediments by obligate anaerobic bacteria (Jones & Mulholland, 1998; Hope et al., 2004). Methanogenic activity spikes at the onset of anoxie conditions where sufficient organic C exists, for example in soils and wetlands when the water table rises (Hope et al., 2004). Few studies have created complete watershed-scale C02 and CH4 mass balances, including organic C sources, GHG emissions, and watershed export (Striegl et al., 2012; Lundin et al., 2013; Campeau et al., 2014).
The atmospheric flux of C02 and CH4 from streams and rivers has often been poorly quantified despite its importance in the global carbon cycle (Cole et al.,
2007; Drake et al., 2017). There is increasing evidence that gas exchange from
streams and rivers is one of the dominant pathways for car bon export, representing anywhere from 13 to 58% of total carbon flux (Billett et al., 2004; Jonsson et al.,
2007; Aufdenkampe et al., 2011; Buffam et al., 2011; Wallin et al., 2013; Butman
et al., 2016; Magin et al., 2017; Stackpoole et al., 2017). There is potential for the fluvial network to offset the terrestrial carbon sink and a need to put these fluxes into context within the framework of the terrestrial carbon balance.
0.1.3 The role of riverine dissolved organic matter quality in C02 supersatu-ration
DOC is an important component of the biogeochemistry of rivers. DOC is one of the largest cycled organic car bon pools on Earth (Amado et al., 2006). It has been shown that there are links between C02 and DOC (Mayorga et al., 2005; Karlsson et al., 2007; Zeng
&
Masiello, 2010; Ward et al., 2013; D'Amario & Xenopoulos,2015; Bodmer et al., 2016) in inland waters suggesting that mineralization and
respiration of DOC to C02 can be an important pathway in the carbon cycle
of ri vers. In particular, recent studies have shown terrestrial DOM, previously thought to be resistant to degradation, to be important to C02 production in streams (Lapierre et al., 2013; Fasching et al., 2015; Drake et al., 2015). However, DOC is only a measure of the carbon content of the larger pool of dissolved organic matter (DOM). DOM with similar DOC concentrations can have vastly different quality and implications for metabolism and biogeochemical cycling. DOM is a complex mixture of thousands of different compounds (Singer et al., 2012), making the characterization of its quality difficult. New and recent techniques show great promise for investigating DOM quality but few have been applied to boreal streams.
For more than 50 years, DOC concentration has been a standard measurement in freshwater ecology and biogeochemistry (Perdue
&
Ritchie, 2005). In the last 20 years, there has been a considerable effort to better characterize the complex DOM pool. Absorbance measurements or chromophoric dissolved or-ganic matter (CDOM) were among the first used to supplement DOC concen-tration and provided insight into structure, molecular weight and degradation of DOM. Absorbance in the UV range, commonly reported as specific ultraviolet absorbance (SUVA), is useful in estimating aromaticity associated with terrestrial DOM (Weishaar et al., 2003). The ratio of UV to visual CDOM (a250:a365) isre-lated to the molecular size of DOM (Spencer et al., 2012). More recently, analysis of fluorescent dissolved organic matter (FDOM) has been applied to determine the source and degradation of DOM (Coble, 1996; McKnight et al., 2001a). Specific fiourophores originating from terrestrial, microbial or algal sources can be quan-tified within FDOM. Additionally, size exclusion chromatography coupled with organic carbon detection (SEC-OCD), one particular method being LC-OCD, has the ability to <livide DOM into six functional fractions (Huber et al., 2011). LC-OCD has the advantage of producing a measurement of carbon and nitrogen in each fraction. Recent technological and data processing advances have made analysis of the molecular composition of DOM possible (Kujawinski et al., 2004; Koch et al., 2007). Ultrahigh-resolution electrospray ionization Fourier transform ion cyclotron resonance mass spectrometry (FT-ICR-MS) has the ability to re-solve individual molecules in the complex DOM pool resulting in thousands of chemical formulae being identified (Koch et al., 2007). With FT-ICR-MS, LC-OCD and optical properties combined it is possible to investigate DOM dynamics in rivers across diverse landscapes and investigate the compositional controls on C02 production from this pool. DOM properties are related to potential for
photo-degradation and bacterial mineralization (Amado et al., 2006) and thus yield information on C02 production and may be useful in disentangling sources.
0.2 Thesis Objectives
The main focus of this thesis is to provide a better understanding of GHG dy-namics in boreal rivers. Currently, two of the major uncertainties with regards to a more comprehensive view of GHGs in boreal rivers and their interaction with the terrestrial ecosystem and the global carbon cycle are:
2. How much C02 and CH4 do boreal rivers emit to the atmosphere?
This thesis will improve the current state of knowledge of these two main themes through four objectives, representing four thesis chapters, each written in the form of a scientific manuscript:
1. Explore the degradation of DOM along the soil-stream-river continuum and as a potential source of C02
2. Determine landscape controls of C02 and CH4 in boreal rivers at a large scale
with a focus on remotely sensed properties with potential for upscaling 3. Access the seasonal variation of C02 and CH4 in the context of landscape
controls
4. Use the relationships developed above to model and upscale fluvial C02 and
CH4 emissions in the boreal 0.3 General Approach
My overall approach of this thesis is to separate the two main goals with scale (Figure 0.1). At the large scale, I use landscape and climate drivers to build models to predict C02 and CH4 remotely over vast areas. Using these predictive models, large scale integrative fluvial emissions can be characterized to investigate emergent properties to realize the goal of the boreal biome emissions of C02 and CH4 . At the small scale, I use molecular, chemical and optical properties of DOM through the land-water interface and at the larger watershed scale to address the potential for DOM degradation as a source of C02 supersaturation. At the temporal scale, I investigate how C02 and CH4 concentrations and fluxes vary annually in two contrasting regions to help address the seasonality with respect to the two main goals.
1
Goal
1 1Scale
1IPropertyl
Boreal
\
Biome
//1
Mega
Emergence
Emissions
\ /Macro
Climate
Landscape
Temporal
Sea son
-Meso
Micro
Degradation
GHG
Source
Na no
Molecules
Figure 0. 1: General Approach towards the two major goals of the thœis. There is a separation of scales with goals 1) sources of C02 and CH1 encompassing the small and 2) boreal emissions the large. Whereas, the temporal scale acts on sizes. The property at each scale represents the controls investigated in the approach to reach both goals.
0.3.1 Spatial Survey
Five distinct regions of the Québec boreal biome were snapshot sampled to cap-ture the variability in size and watershed properties of streams and rivers in each region. These regions have unique climate, vegetation and geomorphology and represent the variability in the Eastern North American boreal biome. From each region, between 12 and 57 streams and rivers were sampled between late July or early August. These sites were selected in each region to attempt to cap-ture the range of stream order and diversity of catchment properties. At each site, sampling included biological ( chlorophyll a), physical ( stream morphology, velocity, discharge, temperature, gas exchange) and chemical (pH, conductivity, concentrations of nutrients, dissolved inorganic and organic carbon, C02 , CH4 ) measurements. Using geographic information systems (GIS) and available geospa-tial data, the watershed of each stream and river was delineated and characterized for geomorphology and climate.
0.3.2 Temporal Survey
While the spatial survey was a summer snapshot, in two of the regions, sam-pling was expanded to include a full annual cycle. These two regions (Abitibi and Chicoutimi) are similar latitudes but have different climate, land cover and geo-morphology. Ten to thirteen sites in each region were sampled eight times during a year with the same measurements of the spatial survey.
0.3.3 DOM Characterization
In one of the regions (Côte-Nord), the measurement and characterization of DOM was expanded just car bon concentration to include optical ( absorbence, fluores-cence), chemical (LC-OCD) and molecular (FT-ICR-MS) properties. In addition to stream and river sampling, in this region riparian soils were sampled for DOM
measurements.
0.3.4 Statistical and Modeling Approach
This thesis is based the use of on a number of multivariate statistical methods to explain the variation in fluvial dissolved carbon in space and time. Redundancy analysis was used to explore the co-variation between dissolved carbon and cli-mate and landscape properties and also between different DOM characterization measurements. Similarly, canonical analysis of principal coordinates was used to explore co-variation in DOM molecular composition with the position in the aquatic continuum and other measures of DOM composition. The inter- and intra-regional variation of dissolved carbon was partitioned using mixed effects models.
In addition to multivariate statistics, GIS digital elevation based modeling of the stream network was clone. Using the statistical models developed, C02 and CH4 concentrations and fluxes were modeled at a large scale.
THE OPTICAL, CHEMICAL, AND MOLECULAR DISSOLVED ORGANIC MATTER SUCCESSION ALONG A BOREAL SOIL-STREAM-RIVER
CONTINUUM
Ryan H. S. Hutchins1, Pieter Aukes2 , Sherry L. Schiff2,Thorsten Dittmar3 , Yves
T. Prairie1 , and Paul A. del Giorgio1
Published in Journal of Geophysical Research: Biogeosciences (2017), 122 (11),
2892-2908, 10.1002/2017JG004094
1Groupe de Recherche Interuniversitaire en Limnologie (GRIL), Département
des sciences biologiques, Université du Québec à Montréal, Montréal, Québec,
Canada.
2Earth and Environmental Sciences, University of Waterloo, Waterloo, Ontario,
Canada.
3Research Group for Marine Geochemistry (ICBM-MPI Bridging Group) Institute
for Chemistry and Biology of the Marine Environment, University of Oldenburg, Oldenburg, Germany
Soils export large amounts of organic matter to rivers, and there are still major uncertainties concerning the composition and reactivity of this material, and its fate within the fluvial network. Here we reconstructed the pattern of movement and processing of dissolved organic matter (DOM) along a soil-stream-river con-tinuum under summer base-flow conditions in a boreal region of Québec (Canada), using a combination of fluorescence spectra, size-exclusion chromatography and ultrahigh-resolution mass spectrometry. Our results show that there is a clear sequence of selective DOM degradation along the soil-stream-river continuum, which results in pronounced compositional shifts downstream. The soil-stream in-terface was a hotspot of DOM degradation, where biopolymers and low molecular weight (LMW) compounds were selectively removed. In contrast, processing in the stream channel was dominated by the degradation of humic-like aromatic DOM, likely driven by photolysis, with little further degradation of either biopolymers or LMW compounds. Overall, there was a high degree of coherence between the patterns observed in DOM chemical composition, optical properties, and molec-ular profiles, and none of these approaches pointed to measurable production of new DOM components, suggesting that the DOM pools removed during transit were likely mineralized to C02 . Our first order estimates suggest that rates of
soil-derived DOM mineralization could potentially sustain over half of the measured · C02 emissions from this stream network, with mineralization of biopolymers and
humic hubstances contributing roughly equally to these fluvial emissions. 1.1 Introduction
Streams and rivers cover a small surface area of the Earth but emit C02 at rates
that are significant in terms of the global carbon budget (Raymond et al., 2013). However, the source sustaining C02 supersaturation throughout the stream
net-work is still an area of active research (Butman et al., 2016). C02 can be exported
from the terrestrial system or generated from the mineralization of terrestrially-derived organic matter within the aquatic system, yet the relative contributions of these pathways and the underlying mechanisms are not well understood (Butman
et al., 2016; Hotchkiss et al., 2015). Sorne studies have reported that the ground-water mediated injection of soil-derived C02 can account for much of the stream
C02 dynamics (Ôquist et al., 2009; Leith et al., 2015; Winterdahl et al., 2016),
others have shown that in-stream processing of DOM may be a significant source of C02 outgassing in streams (Berggren et al., 2012; Lapierre et al., 2013; Hotchkiss
et al., 2015), but few studies have actually assessed the combined contributions of these pathways. In this regard, Rasilo et al. (2017) quantified the relative con-tribution of direct soil-derived C02 injection and the degradation of soil-derived
DOM and CH4 in a large number of boreal streams of low order (Strahler order
3 and smaller), and concluded that the degradation of soil derived DOM may account for up to 75% of the C02 flux observed across all streams. Rasilo et al.
(2017) also concluded that this degradation of soil-derived DOM mostly occurs at
the soil-stream interface in the hyporheic zone, although these authors did not ex-plicitly quantify the degradation subsequently taking place in the stream channel itself along the fluvial continuum. The corollary of these patterns found by Rasilo et al. (2017) is that, simultaneous to the differences in concentration between soil and stream waters, there should be qualitative shifts in the chemical composition of this DOM as it transits through the soil-water interface, because it is unlikely that all its constituents are uniformly degraded. Likewise, the subsequent degra-dation of DOM within the stream channel should also impose further qualitative changes in its chemical nature. The mass balance approach solely based on DOM carbon concentrations (DOM-[C]) in soil and stream waters, however, does not allow determination of the underlying qualitative shifts in DOM, and in particu-lar, the identification of the components of this DOM that are actually degraded and converted to stream C02 , and where this occurs in the continuum.
The above requires assessing the composition and structure of ambient DOM, which is extremely challenging due to the complexity of this pool. Measurement
of fluorescent components of DOM (FDOM) based on excitation/emission spectra (EEMs) is a commonly applied technique which is useful for tracking bulk changes in fluorescent DOM components related to quality (McKnight et al., 2001b; Lu et al., 2013; Lambert et al., 2016). However, the chemical composition of FDOM and its relationship to non-fluorescent DOM are still not well understood (Stub-bins et al., 2014). Recent advances in measuring the composition of DOM using ultrahigh-resolution electrospray ionization Fourier transform ion cyclotron res-onance mass spectrometry (FT-ICR-MS) holds promise for understanding the molecular composition of DOM and its potential links to DOM quality and re-activity (Koch et al., 2008; Singer et al., 2012; Kellerman et al., 2014). As with EEMs, FT-ICR-MS yields a mostly qualitative perspective of DOM composition. In the case of FT-ICR-MS, charge competition between ions (Koch et al., 2008) and selectivity of the solid phase extraction pretreatment commonly used (Raeke et al., 2016; Chen et al., 2016) render the determination of absolute quantities of constituents highly uncertain. In contrast, size-exclusion chromatography in combination with organic carbon detection (SEC-OCD), although providing a much coarser discrimination than FT-ICR-MS, can be used to determine the ac-tual amount of DOM in fractions based on molecular size (Huber et al., 2011) and functional groups (Ruhl & Jekel, 2012), and therefore to quantitatively track changes in DOM composition. It is clear that no single approach is sufficient to capture both the quantitative and qualitative changes that DOM undergoes as it transits from soils through aquatic networks.
In this paper we apply a combination of these advanced analytical tools to study the movement and processing of DOM along a soil-stream-river continuum in a boreal landscape. This study builds on previous work that focused on stream C emissions, and where Rasilo et al. (2017) determined the contributions of di-rect soil-derived C02 injection and the degradation of soil-derived CH4 and
soil-derived DOM to stream C02 fluxes across a large number of small (
<
order 3) boreal streams (Rasilo et al., 2017). Here, as a follow-up paper, we explore the mechanisms underlying these pathways of delivery of C02 , and in particular, wefocus on reconstructing the processing and degradation of soil-derived DOM as it transits along the soil-stream-river continuum. To do this, we first investigate the shifts in the optical, chemical and molecular composition of DOM that occurred along this continuum. We then use the resulting patterns in DOM composition to identify the soil-derived pools within the DOM that are selectively removed and likely degraded to C02 along this continuum, and the location where this
mineralization occurs. Finally, we derive a first order estimate of the potential contribution of these different soil-derived DOM pools to the observed stream C02
fluxes.
1.2 Methods and Material 1.2.1 Study Sites and Sampling
Forty streams of Strahler order 1 to 4 were sampled in the Côte-Nord region in Québec, Canada from July 10 to 28, 2013 (Table 81). The region is dominated by Precambrian rocks (no lithological source of inorganic carbon), Ferro-Humic Podzolic soil and is well drained. Catchments were dominated by black spruce (Pincea mariana) with some small shrubs (Salix spp., Poaceae spp.) and mosses growing on river banks (Rasilo et al., 2017). The sampling period corresponded to one of the driest summers in the past 50 years and precipitation was minimal before and during the sampling period. As a result, our study captured summer base-flow discharge that was among the lowest recorded for the region (see example hydrograph in Figure S 1).
At 30 of the streams sampled, soil water (shallow groundwater) samples were col-lected in the riparian zone (30 to 80 cm to the adjacent stream) with piezometers