This project is funded by the European Union under the 7th Research Framework Programme (theme SSH) Grant agreement nr 290752. The views expressed in this press release do not necessarily reflect the views of the European Commission.
Working Paper n° 45
The changing trade specialization and poverty in Brazil
Instituto de Economia – Universidade Federal do Rio de Janeiro
Marta R.Castilho ; Alexis Saludjian
1 The changing trade specialization and poverty in Brazil1
Marta R.Castilho Alexis Saludjian Instituto de Economia – Universidade Federal do Rio de Janeiro
1. Introduction
Until the beginning of the 2000s, Brazil was one of the most unequal countries in the world, displaying a considerably high incidence of poverty: in 2001, the country’s Gini index was 0.60, while 59 million Brazilians were affected by poverty and 25.5 million people lived in conditions of extreme poverty. During the 2000s, social indicators showed significant improvement, and by the end of the decade a remarkable shift in poverty and income inequality was seen. In 2012, 30.4 million Brazilians were considered poor while extreme poverty touched 10.1 million individuals, and the Gini index decreased to 0.53.2
The reduction in poverty as well as the improvement on income distribution—both unparalleled in Brazilian history—are attributable to a number of events such as the several social policies adopted in the period and the growth experienced by the Brazilian economy during the first decade of the 21st century.
A contributing factor—during part of the decade at least—to this economic dynamism was the good performance of Brazilian exports, boasting an average growth of 13% per year between 2000 and 2012, from US$55 billion to US$ 243 billion. The Brazilian export sector outperformed global trade growth. Also, the country’s export coefficient increased in comparison to previous decades, peaking at 14.6% in 2004, its highest level since 1950.This growth was accompanied of a shift in the country's export pattern: even though exports of manufactured goods increased throughout the decade, the rise in primary goods exports was far superior, thanks to changing global demand and international commodity prices. That is to say, the remarkable surge in Brazilian exports was accompanied of a structural change, showcasing a trend of “primarization” of the exports pattern3.
1We thank Kaio Glauber da Costa for the excellent research assistance. The students Eduardo Maxnuck Soares and
Vinicius Santos also collaborated in the work.
2
The Gini indices were calculated by IPEA and data on poverty were obtained from PNAD/IBGE.
3This process regards solely export flows and is a distinct phenomenon from deindustrialization, which is linked to
industrial production. In the Brazilian case, despite the increasing expansion of the export coefficient throughout the decade, the change in its composition did not have a significant impact on the domestic production structure as we can see form the difference of both evolution and structure of exportand national production.
2 In this context, one can ask what role exports played in the evolution of employment during the 2000s.This study aims at investigating to which degree the creation of employment was impacted by recent structural changes in the Brazilian international trade sector, in view of its vigorous growth rates and changing pattern. The evolution of employment is assessed quantitatively—by estimation of the number of jobs associated with exports—as well as qualitatively—through indicators that summarize certain characteristics of sectoral employment, signaling the “quality” of job positions created by the export sector.
The analysis of employment generated by exports is one possible approach to addressing the issue of globalization impacts on poverty. The transmission channel of international trade to poverty through the labor market is thus emphasized, since it plays a material role in the Brazilian case. As demonstrated by Soares [2012], Lavinas [2013] and Hoffman [2013], the labor market accounted for a significant part of poverty and income inequality reduction in Brazil in recent years by virtue of the continuous rise in employment, especially in formal employment, and the increase in workers’ income, especially lowest-paid ones.
Poverty is a multidimensional and dynamic phenomenon, as it has been assessed by this project4.In the case of recent developments in Brazil, the authors mentioned above have described the main factors that explain the evolution of poverty in the country. However, as demonstrated by a vast theoretical and empirical literature, it is also known that one of the most usual questions in economics regards the effects of trade flows on the income of individuals. Therefore, this report sets out to closely examine the relationship between exports and poverty.
From the standpoint of traditional trade theory, countries gain in specializing in sectors in which they have comparative advantages and, in light of the convergence of factor prices in a world of liberalized trade, their most abundant factors will see their remuneration rise. These predictions by neoclassical trade models have already been challenged (Rodrik, 1997; McMillan; Rodrik, 2011) by numerous theoretical and empirical works that demonstrate that other factors—such as the occurrence of economies of scale, product differentiation, technology change and outsourcing—
4For a discussion of concepts and methodologies of poverty measurement, see the works developed within Working
3 should be taken into consideration in order to explain the effects of trade flows on the social outcomes of a country5.
Within Latin American economies, the structuralist economics theory—whose origins date back the work of the UN Economic Commission for Latin America in the 50’s—did not use to see in foreign trade a source of sustainable economic growth nor of improvement of workers’ conditions. On one hand, the international specialization of these economies—exporting primary products and importing manufactured goods—did not contributed to their development because of the unfavorable evolution of terms of trade. On the other hand, these economies presented a very heterogeneous social and production structure, marked by great inequality and by the coexistence of a modern export-led sector along with an archaic one, the latter targeting the domestic market and absorbing most of the labor force. The vast gap between the two sectors prevented benefits from exports—already limited by the unfavorable evolution of terms of trade—to be spread throughout the whole economy, thereby restraining economic growth and hindering the reduction of inequalities. The structuralist theory thus advocated the development of a diversified domestic industry as a means of overcoming the conditions of underdevelopment.
Despite these different theoretical approaches giving sometimes divergent diagnoses, they all do suggest that the performance of a country in foreign trade influences the income of individuals—and, consequently, its distribution—within a given economy.
This study aims to analyze the relationship between globalization and poverty from the perspective of the labor market, by investigating if and how did exports created employment and then if and how it contributed to the reduction of poverty levels. Well aware that the job market is but one of the transmission channels between the external sector and poverty as well as of the relatively low degree of Brazil’s openness to trade, the authors intend not to attach too much importance on exports as a determinant of poverty evolution in the country. However, besides the already mentioned importance of the labor market in explaining recent developments of poverty and income inequality in Brazil, the structural differences between the export pattern and domestic production may help to elucidate the weak link found between exports and employment in the country.
The strong surge in exports was a phenomenon experienced by most Latin American countries as well as other developing regions, as a result of the commodities market evolution during the first decade of the 21st century. In this sense, the conclusions drawn from the connection between
5According to Castilho, Menendez and Sztulman (2012, p.821), “recent research concludes that we need to go beyond the
4 globalization/trade and employment/poverty in this article could be useful for case analysis in other countries.
This report comprises three sections, as well as this introduction. The first section provides a brief overview of the Brazilian economy development between 2000 and 2012, emphasizing the evolution of the volume and composition of Brazilian exports as well of several social indicators. The second one presents the methodology and data used in the calculations of the labor content of exports, and also in the assessment of “quality” of employment created. In the third section the findings are evaluated from the standpoint of possible impacts arising from the Brazilian increased export openness in the 2000s on the job market and, indirectly, on poverty.
2. Brazilian economy: evolution of socio-economic indicators during the 2000s
The Brazilian economy, just as the world economy, has gone through a period of high dynamism during the 2000s.Such dynamism was observed both in the domestic realm in terms of production, consumption and investment, and in the external sector, which displayed a continuous increase in trade flows6. The socio-economic indicators also signal a positive progress of Brazilian economy in the realms of the job market, poverty and income inequality. Some of these indicators are presented below.
The average real GDP growth between 2001 and 2012 was 3.5% per year, a considerably high rate when compared to the two previous decades7 (Figure 1). The agriculture, industry and service sectors have all advanced, with agriculture exhibiting the highest average growth (4% per year) and industry the lowest one (2.7% per year).
During this period, three sub-periods with distinguishing characteristics can be identified. Between 2001 and 2003, the GDP recorded a real average growth of 1.7% per year, led mainly by the good performance of agriculture, which grew at an average 6.2% yearly rate. External factors—related to the outcomes of the 2001 attacks in the USA and the Argentinean crisis—as well as internal ones— such as the electricity shortages in 2000 and the uncertainties prior to the 2012 elections—have contributed to these low growth rates. Over the following years, an acceleration of growth was observed, interrupted only by the financial crisis of 2008. Real growth between 2004 and 2010 averaged 4.5% per year. During this period, 2009 presented a negative growth rate (-0.3%) and in the following year (2010) growth achieved its highest rate in the period (7.5%), driven by a strong
6The trade flows are calculated by the sum of imports and exports. 7
5 expansion of the industry sector (10%). As it will be presented below, the country benefited from a rising external demand for its products as well as from an increase in income and domestic consumption. In the last biennium 2011-2012, the Brazilian economy showed signs of a slowdown, featuring an average growth rate of 1.8% per year, under the negative impacts from the poor performance of both the agricultural and industrial sectors.
Figure 1. Rate of real GDP variation per year and per key sectors between 2001 and 2012 - (in %)
Source: Own elaboration based on data of IBGE.
An analysis of GDP components from the perspective of demand shows how different factors influenced GDP fluctuation over the decade (Figure 2). Between 2000 and 2003, a moderate nominal GDP growth (2.3% per year) resulted from the poor performance by almost all components of GDP. Uncertainties related to the presidential elections of 2002 resulted in a significant decline in investments, producing a fall in gross fixed capital formation in 2002 and 2003. Exports started to show a positive and growing contribution to GDP from 2002 onwards, when a growth cycle of (external) demand and commodity prices began.
Since 2004, there has been a significant change in the pattern and level of growth of the Brazilian economy, featuring accelerated growth rates. Almost all GDP components contributed positively to its good performance except for imports, which progressively stepped up their negative contribution to GDP growth. Household consumption, however, was the component that stood out most during this period, showing a steady growth of 2.9% per year between 2004 and 2012. Household consumption continued to grow even in 2009 under the effects of the international financial crisis on
-0,08 -0,06 -0,04 -0,02 0,00 0,02 0,04 0,06 0,08 0,10 0,12
6 the Brazilian. The following year, in 2010, consumption started growing again and exhibited its largest annual variation (4.2%), as a result of governmental policies to encourage demand through the expansion of household credit and tax cuts for businesses. After the strong growth seen over 2010, all components except household consumption significantly lowered their growth rates in 2011-2012.
Figure 2. Annual real fluctuation of Gross Domestic Product components from 2000 to 2012 (in %)
Source: Own elaboration based on data of the National Accounts System/IBGE.
The contribution of exports to GDP growth throughout the decade—except in 2009—was a positive one. The average contribution was 0.8% between 2000 and 2012; however, it became more significant between 2003 and 2005. On the imports side, the contribution was negative: -1% on average. The years displaying the greatest (negative) impact of imports to GDP growth were also those of greatest economic growth—namely, 2007 and 2010. This illustrates the high income elasticity of Brazilian imports, which sharply soars in times of economic expansion.
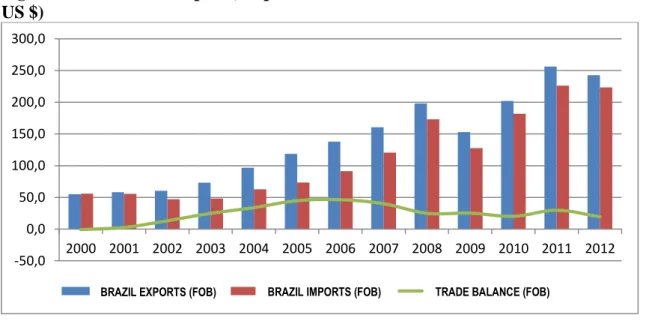
The Brazilian foreign trade was significantly intensified during the 2000s, driven by a combination of internal and external demand growth (Figure 3). Between 2000 and 2012, Brazilian trade value jumped from US $ 110 billion to US $ 465 billion, which represented a growth rate of 320%.In the
-5,00 -3,00 -1,00 1,00 3,00 5,00 7,00 2000 2001 2002 2003 2004 2005 2006 2007 2008 2009 2010 2011 2012 Gross Fixed Capital Formation Government
Household Exports
Imports GDP
7 first half of the decade, the intensification of Brazilian trade was driven by export growth, which benefited from increased external demand and commodity prices8.From 2006 onwards, the trade flow expansion became more influenced by imports, whose growth rate rose to surpass that of exports. The increase in imports was due to the upsurge of domestic economy in a context of an appreciated exchange rate. As a consequence of these developments, the trade balance kept growing until 2006, when it peaked at US $ 46 billion. From then, the trade balance showed a downward trend, eventually reaching $ 19 billion in 20129.
Figure 3. Evolution of exports, imports and trade balance between 2000 and 2012 - (in million US $)
Source: Own elaboration based on data of SECEX/MDIC.
The good performance of Brazilian exports in the 2000s was accompanied by a significant change in its composition. A phenomenon of "primarization" of exports can be observed, in which the agricultural and mining products have gained importance in the Brazilian export pattern. As can be seen below (Figure 4), exports of these products increased their share of total exports from 23% in 2000 to 47% in 2012. On the import side, the composition of imports remained relatively stable.
8For a more detailed analysis of the Brazilian export pattern evolution in the 2000s and of the factors determining its
evolution, see Castilho (2011).
9
The data for 2013 indicate a strong reduction of the trade balance to mere US $ 2.8 billion (SECEX/MDIC). -50,0 0,0 50,0 100,0 150,0 200,0 250,0 300,0 2000 2001 2002 2003 2004 2005 2006 2007 2008 2009 2010 2011 2012 EXP BRASIL (FOB)BRAZIL EXPORTS (FOB) IMP BRASIL (FOB)BRAZIL IMPORTS (FOB) SALDO COMERCIAL (FOB)TRADE BALANCE (FOB)
8 Figure 4. Evolution of the composition of Brazilian exports and imports per aggregated factor 2000-2012 (in %)
Source: Own elaboration based on data of SECEX/MDIC.
Both mining and agricultural products benefited from a substantial price raise and significantly expanded their export volume, as can be seen in Table 1, which details the evolution of total exports according to each sector. Between 2000 and 2012, exports of mining products rose from 7% to 22% respectively, driven by growth in iron ore exports, in particular to China. The growth of agricultural products exports was also quite high, since their share in total exports doubled between 2000 and 2012. In addition to these sectors, it is worth calling attention to the advancement of food products, beverages, and tobacco exports, which together still hold an important share of Brazilian exports and have also benefited from the upsurge of global trade.
Given the increase in the exports of these goods, other industrial sectors have lost ground in foreign trade. The two largest export industries, second only to the food industry—namely, transport equipment and steelmaking/metallurgy—saw their shares shrink respectively from 17% to 9% and from 12% to 9% of total Brazilian exports between 2000 and 2012.It is worth noting that exports of these products did grow over the same period, but at a rate well below that of agricultural, mining and food products. Incidentally, Brazilian manufactured goods have not lost their share of the global market during this period: their shares remained stable (albeit low) while the market share by
9 primary and mining products advanced.10Textiles, clothing, leather/footwear, and electronics have all lost share in total exports, mainly due to competition from Asian countries (particularly China). Anyway, these important changes in the composition of exports are not mirrored in the domestic production structure. Despite the declining importance of industry to exports, as mentioned above, the sector presented a smaller reduction in its total output share. This fact—along with the relative stability of agriculture’s GDP share—attests that there is a relative decoupling between exports and domestic production. The importance of the domestic market, as evidenced by the contributions of household consumption and investment to GDP growth, largely explains this disconnection. This is a relevant point when looking at the importance of foreign trade to the growth of both the domestic economy and labor market, as will be demonstrated below.
Table 1. Brazilian exports by economic activity between 2000 and 2012 - (in %)
Economic Activity 2000 2005 2009 2012
Agriculture, livestock farming and fisheries 7.7 7.5 12.0 13.8 Food products, beverages and tobacco
products 15.8 18.6 22.3 19.4
Rubber and plastic products 1.7 1.4 1.5 1.3
Fuels 3.2 4.7 4.6 3.2
Mining and quarrying 6.7 10.6 15.8 22.5
Machinery and equipment, domestic
appliances 7.7 8.1 6.6 7.0
Transport equipment 17.2 15.4 9.9 8.6
Electronic and communication equipment 4.1 3.3 1.8 0.4
Furniture and other manufactured goods 1.5 1.2 1.4 0.7
Wood and pulp products, newspapers 7.3 5.5 4.4 3.6
Non-metallic mineral products 1.5 1.5 1.0 0.8
Chemical products 6.8 5.7 5.8 5.3
Steelworks and metallurgy 12.2 12.0 9.9 9.2
Textile, wearing apparel, leather and shoes 6.5 4.5 2.8 1.9
Other activities 0.0 0.0 0.0 2.3
Total 100.0 100.0 100.0 100.0
Source: Own elaboration based on data of IBGE.
10According to data from COMTRADE, Brazil maintained a relatively stable share (albeit a low one) in global exports of
manufactured goods from the middle of the 1990s onwards, showcasing a slight increase from 2005, and averaging 1% between 1995 and 2012.
10 In the social sphere, the decade was equally marked by important changes, recording a positive evolution of various social indicators both in the labor market as elsewhere. This trend is obviously linked to economic growth, for it not only comprises one of the drivers boosting household consumption expansion but is also a consequence of a buoyant production. Below we present some indicators related to income distribution, poverty and changes in the labor market.
For one of the most unequal countries in the world, Brazil’s improvement during the 2000s in terms of income distribution and poverty reduction is remarkable. From the beginning of the decade, the Gini index11 displayed a continuous and uninterrupted decline, dropping from 0.60 in 2001 to 0.53 in 2012. The ratio between the average income of the richest 10% and the income of 40% poorest12 fell from 23 in 2001 to 15 in 2012, which reaffirms the ongoing process of income deconcentration (Figure 5).
Figure 5. Income inequality in Brazil: Gini Index and Ratio between the income of the richest 10% and the 40% poorest, 2001-2012
Source: Elaboration of IPEA based on data of PNAD/IBGE.
11
The Gini index measures the degree of inequality in the distribution of per capita household income among a group of individuals. The highest its value, the more unequal is the population.
12As explained by IPEADATA, it is “a measurement of the inequality found in the distribution of individuals according
to their per capita household income. It compares the average income of individuals from the richest 10% in income distribution with the average income of individuals belonging to the 40% poorest according the same distribution.”
0,00 5,00 10,00 15,00 20,00 25,00 0,48 0,50 0,52 0,54 0,56 0,58 0,60 2001 2002 2003 2004 2005 2006 2007 2008 2009 2011 2012 R atio b e tw e e n in co m e s Gi n i In d e x
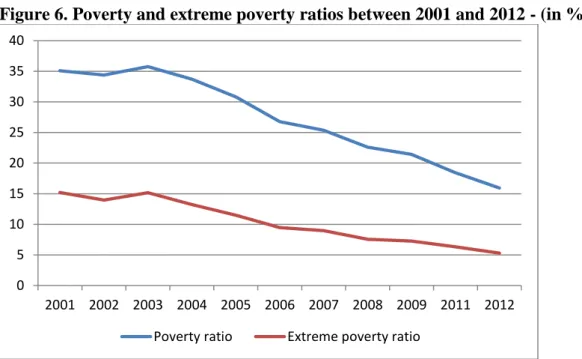
11 The improvement in income distribution did not occur in isolation: the reduction in poverty and extreme poverty was also substantial13. The percentage of poor in total population decreased from 35% in 2001 to 16% in 2012, while the percentage of people living in extreme poverty fell from 15% of total population in 2001 to 5% in 2012. The number of people who moved out of poverty and extreme poverty situations approximately amounts to 28 and 15 million respectively (Figure 6).
Figure 6. Poverty and extreme poverty ratios between 2001 and 2012 - (in %)
Source: Own elaboration based on data of IPEA.
The factors that explain this reduction in inequality and poverty are numerous: the improvement of the labor market in terms of employment and income; cash transfers promoted by social programs (especially Bolsa Família); and further tax transfers through pension and benefits for the elderly and low-income disabled population. Several articles14 have estimated the contribution of these factors to the reduction of poverty and inequality, and are unanimous in stating that revenues from the labor market are mainly responsible for this development. As regards other factors, tax and social transfers were decisive for the improvement in social indicators of poverty and income distribution, although their contribution remained much inferior to that of the labor market itself. It is worth noting that cash transfer programs contributed most strongly to the reduction of inequality than of poverty, due
13According to IPEADATA, “the poverty line considered in this case corresponds to the double of the extreme poverty
line, which is an estimate value of the food basket containing the minimum amount of calories needed to properly feed a person, as recommended by FAO and WHO.”
14
Hoffman (2013), Lavinas (2013) and Soares (2012). 0 5 10 15 20 25 30 35 40 2001 2002 2003 2004 2005 2006 2007 2008 2009 2011 2012 Poverty ratio Extreme poverty ratio
12 to the low values of benefits granted. Income from employment has been the single most important source of income inequality15 and also poverty reduction.
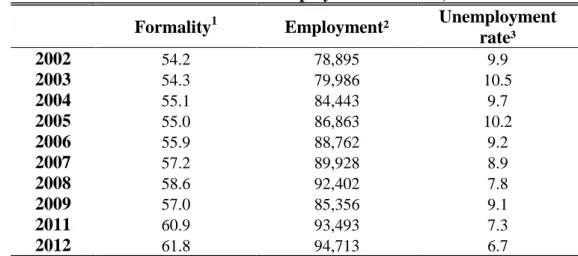
In the job market, there was a positive evolution in terms of employment and of the income earned by workers. With regard to employment (Table 2), the number of employed persons increased by 20% between 2002 and 2012, reflecting the continued growth in employment during this period, which was only halted in 2009. As a result, the unemployment rate fell from 10% to 6.7% during the same period. In addition, the number of formal jobs and their share in total employment increased significantly, as shown by the figures on the share of formal employees in total employed population, which reached 62% in 2012.
Table 2. Evolution and characteristics of employment in Brazil, 2002-2012
Formality 1 Employment² Unemployment rate³ 2002 54.2 78,895 9.9 2003 54.3 79,986 10.5 2004 55.1 84,443 9.7 2005 55.0 86,863 10.2 2006 55.9 88,762 9.2 2007 57.2 89,928 8.9 2008 58.6 92,402 7.8 2009 57.0 85,356 9.1 2011 60.9 93,493 7.3 2012 61.8 94,713 6.7
Notes:¹Ratio between formal employees and total employment.² Persons aged 10 or more, employed on the week of reference.³ Percentage of persons who have sought but could not find professional compensating occupation over total persons considered active aged 10 or more that were looking for a job or working in the week of reference.
Source: Own elaboration based on data of PNAD/IBGE.
During this period, the average income of workers also increased: its variation in real terms was 32% between 2001 and 2012, as shown by data on the average income from main job (Table 3). This information indicates the existence of differences between the level and evolution of labor incomes in metropolitan and rural areas. However, since rural incomes grew faster than metropolitan ones— accumulated growth rates in real terms were respectively 18% and 84% between 2001 and 2012— the gap between rural and urban income was significantly reduced.16This evolution illustrates an ongoing convergence of labor earnings and is linked to the current policy of minimum wage
15Including regional figures (see Silveira Neto and Arzoni, 2013).
16The data pertaining to per capita income by education level (IPEA, based on data of PNAD/IBGE) also indicate a larger
13 valuation17.
Table 3. Average income from main job in Brazil per region, 2001-2012
Metropolitan Areas Non-metropolitan
Areas Rural Areas TOTAL
BRL $ Oct/2009 Growth (%) BRL $ Oct/2009 Growth (%) BRL $ Oct/2009 Growth (%) BRL $ Oct/2009 Growth (%) 2001 1,527 888 384 1,088 2002 1,473 -3.5 867 -2.3 365 -5.1 1,057 -2.9 2003 1,341 -9.0 832 -4.1 395 8.4 989 -6.4 2004 1,331 -0.8 846 1.6 402 1.8 995 0.6 2005 1,397 5.0 874 3.4 410 1.9 1,039 4.4 2006 1,471 5.3 964 10.2 459 11.8 1,123 8.1 2007 1,517 3.2 997 3.5 509 10.9 1,162 3.4 2008 1,515 -0.1 1,039 4.2 531 4.4 1,192 2.6 2009 1,564 3.2 1,060 2.0 551 3.7 1,221 2.4 2011 1,727 10.4 1,165 9.9 640 16.2 1,347 10.4 2012 1,805 4.5 1,255 7.7 706 10.2 1,432 6.3
Source: Elaboration of IPEA based on data of PNAD/IBGE.
The positive evolution of social indicators bears a close relation to the economic performance presented at the beginning of this section. On the one hand, economic growth was fueled by improvements in income, and a significant group of the population was granted access to the consumer market. As seen above, one of the factors that contributed the most to GDP growth was household consumption, which reiterates the importance of the domestic market to recent economic developments in Brazil. Moreover, this same economic dynamism positively affected the labor market and income generation by increasing the demand for jobs and enabling a rise in workers’ average income. In short, the effects of public policies cannot be minimized, particularly those aimed at upgrading the minimum wage.18Raises in the minimum wage have had a positive impact not only on the income of lowest paid workers but also on other welfare benefits—such as pensions and the BPC Continuous Cash Benefit, among others—aimed at the low-income population, as assessed by Saboia (2007).
17According to the series on the Real Minimum Wage elaborated by IPEA, its value grew by 70% between December
2001 and December 2012, minus the inflation assessed by the INPC (National Consumer Prices Index) of IBGE.
18
Saboia and Kubrusly (2013) affirm that government actions in “monitoring labor relations” have also played a positive role in the regularization of employees and labor formality, particularly in less developed regions and sectors of the country.
14 3. The effects of trade on employment generation: methodological aspects
This study is aimed to analyze whether the growth in Brazilian exports and changes in the exports pattern had any effects on the quantity and quality of employment, thereby contributing to poverty alleviation in Brazil during the 2000s. For this purpose, first the labor content of Brazilian exports was estimated. Then, the evolution of employment was assessed quantitatively as well as qualitatively in order to examine the “quality” of job positions created by the export sector. Sections 3.1 and 3.2 cover the methodology procedures for the calculation of indicators, and section 3.3 presents the source of data.
3.1 Calculation of labor content associated with changes in trade
The calculation of the labor content associated with foreign trade consists in an estimation of the number of jobs created within export sectors as well as those lost due to competition with imported goods. The calculation was carried out using employment multipliers estimated as the ratio between domestic employment and production (jobs per monetary unit produced). These multipliers are then applied to the trade flows of a specific country19.
The procedure for the calculation is based on decomposition techniques of employment. Building on the accounting identities 𝐶 = 𝑄 − (𝑋 + 𝑀)and 𝑃 = 𝑄 𝐸⁄ , where the variables represent consumption (C), production (Q), exports (X), imports (M), productivity (P) e employment (E) for a given sector i (not shown), it is known that ∆𝐸 = (1 𝑃
0
⁄ ) [∆𝐶 + (∆𝑋 − ∆𝑀) − 𝐸0∆𝑃]. In order to
evaluate the impact of trade on employment, we assume that consumption and productivity do not change. We therefore obtain that a change in employment corresponds to a change in net trade balance weighted by the employment multiplier (inverse of productivity). This methodology, as discussed below, has several limitations: for instance, it assumes there is no interaction between the various terms of the first equality20.
In order to estimate the total employment generated by exports, direct jobs naturally have to be taken into account, and also all jobs created by intermediate consumption and by the provision of services within each exporting sector, which are obtained by the technical coefficients found on input-output tables. In the calculation of employment multipliers, it must be taken into account not only direct
19 It may be applied to recorded exports values or hypothetical values obtained from simulations and/or counterfactual
analyses (simulated data for trade liberalization scenarios, to assess what would happen if trade intensity ratios remained constant over a given time period, like it was done by Kucera and Milberg [2000] and Castilho [2005], among others).
20
15 employment within a certain sector producing final goods, but also the employment generated by the intermediate consumption of these final goods, which is also obtained through the technical coefficients provided by the input-output tables.
In terms of input-output matrix analysis, the effects of trade structural changes on employment can be calculated from the following relationship:
𝑌 = 𝑌 + 𝐹 ∴ 𝑌 = [𝐼 − 𝐴]−1𝐹
where𝐴 is the matrix of technical coefficients, 𝒀 is a vector of total output, 𝑭 is the vector of final demand and [𝐼 − 𝐴]−1is the Leontief inverse matrix. The multiplication of the Leontief inverse with
the final demand vector gives the vector of domestic production necessary to deliver the final demand (Miller, Blair, 2009). In equation (1), as shown in Kucera and Roncolato (2012), we can introduce trade and employment in the input-output model by pre-multiplying the [𝐼 − 𝐴]−1𝑋 term
by 𝐸̂, i.e.
𝐿 = 𝐸̂[𝐼 − 𝐴]−1𝑋 (2)
Where L is the vector of changes in total employment associated with changes in the structure of foreign trade; Ê is the diagonal matrix of employment coefficients; I is an identity matrix; A is the matrix of technical coefficients; and X is the vector of trade expansion. This way one obtains the
employment generated in each sector by the exports of the various sectors (Castilho, 2005). In other
words, each row of the final vector represents the number of jobs created in each sector by overall exports21. In this case, the value for each sector corresponds to employment instead of exports.
According to Kucera and Milberg (2003), Kucera and Roncolato (2012), and Jiang (2013), since exports comprise the final demand of a country, then multiplying it with the inverse Leontief matrix will give the total amount of domestic output that is driven by the demand for exports, X. Moreover, the coefficient of labor shows how much labor is necessary to produce one unit of product, so that by multiplying [𝐼 − 𝐴]−1 with 𝐸̂we obtain the amount of labor—both direct and indirect—resulting
from the exports vector22, 𝑿.
3.2 Indicators of the quality of employment
21 The first line of the final vector represents jobs created in agriculture as consequence of exports from agriculture itself
and all remaining sectors that use agricultural products as input.
22
This method was first introduced by Chenery e Watanabe (1958) and further extended by Lydall (1975). Kucera and Milberg (2003) and Jiang (2013) apply this method to the study of effects from structural changes in trade on employment.
16 Once the sectoral results in terms of jobs created were found, we sought to examine to what extent they had progressed. To this end, an indicator on the “quality of employment” was built, based on a methodology developed by Saboia and Kubrusly (2013). In order to assess the evolution of employment quality in Brazil between 2003 and 2011, the authors developed a synthetic indicator which adopts a format similar to the UN Human Development Index (HDI) and makes use of several variables regarding unemployment, income and labor market entry23. For each variable, the following index is calculated:
𝐼𝑖 =
(𝐸𝑖 − 𝐸𝑖𝑚𝑖𝑛) (𝐸𝑖𝑚𝑎𝑥− 𝐸𝑖𝑚𝑖𝑛)
where𝐸𝑖is the value of the chosen variable; 𝐸𝑖𝑚𝑎𝑥, the maximum value assumed by the variable, and 𝐸𝑖𝑚𝑖𝑛 its minimum value. According to Saboia and Kubrusly (2013), the indicator 𝐼𝑖 is built from variables that present a positive perfomance or some improvement during the period in question.24 The final indicator corresponds to a weighted average of the indicators calculated for each variable. In this case, this methodology was applied to three pertinent indicators in order to assess the quality of employment by sector: average income, share of skilled workers (with over twelve years of schooling), and level of employment formality (measured by the share of registered workers) within each sector. The final synthetic indicator is the result of a simple average of all the three 𝐼𝑖 indices for each year and sector.
4. Direct and indirect employment associated with Brazilian exports during the 2000s Employment supported by exports in Brazil not only represented a relatively small share of total employment (Table 4) but also displayed a downward trend throughout the decade. On average, direct jobs associated with exported goods amounted to 4% of total employment during the 2000s, while indirect jobs added up to 7% of total employment in the same period. Indirect jobs linked to exports are more numerous than direct ones; nevertheless, the gap between the amount of direct and indirect employment dropped consistently. This reduction was due to the declining importance of exports of industrial goods, which show stronger backward linkages and therefore generate relatively more indirect jobs.
23
Variables used in the calculation were the following: unemployment rate, long-term unemployment, unemployment of heads of family, average real income, employment, sub-remuneration, formality and years of schooling.
24
For those variables that present negative performance or a worsening within the time period being analyzed, indicator Ij corresponds to: Ij=(E(Ej−Eimax)
17 Table 4. Direct and indirect employment generated by Brazilian exports, 2000-2009 (in number of jobs)
2000 2001 2002 2003 2004 2005 2006 2007 2008 2009
Total employment 78,972,347 79,544,412 82,629,067 84,034,981 88,252,473 90,905,673 93,246,963 94,713,909 96,232,609 96,647,139 Direct employment
associated with exports 2,756,181 3,411,648 3,662,433 3,702,979 4,442,937 4,146,611 3,979,403 3,887,217 3,756,592 3,789,099
Share 3.5% 4.3% 4.4% 4.4% 5.0% 4.6% 4.3% 4.1% 3.9% 3.9%
Indirect employment
associated with exports 3,987,749 4,923,124 5,970,511 6,201,999 7,088,568 5,689,600 6,811,558 6,289,003 5,952,485 5,280,074
Share 5.0% 6.2% 7.2% 7.4% 8.0% 6.3% 7.3% 6.6% 6.2% 5.5%
Direct and indirect employment
associated with exports 6,743,930 8,334,772 9,632,944 9,904,978 11,531,505 9,836,212 10,790,961 10,176,220 9,709,078 9,069,174
Share 8.5% 10.5% 11.7% 11.8% 13.1% 10.8% 11.6% 10.7% 10.1% 9.4%
Notes: expressed in number of jobs and % of total employment (number of employed people). Source: SECEX, IBGE. Own elaboration.
18 When the ratio between jobs supported by exports and total employment in the economy is compared to the export coefficient—namely, the ratio between exports and total value of goods produced—it becomes clear that the latter outweighs the former. The ratio between jobs created by exports and total employment averaged 10.8% between 2001 and 2009, while the export coefficient reached an average 17%, when considering exports and production of goods (services excluded).25 That is to say, the export coefficient is higher than the share of jobs supported by exports in total employment, indicating that exports generate proportionally less jobs than the production oriented towards the domestic market.
Information regarding the evolution of production, exports and jobs reinforces the idea that exports have contributed little to the positive performance of the job market. The evolution of total employment in the Brazilian economy and the number of export-driven jobs (Figure 7) over the 2000s shows a similar trajectory to that of exports and production value, respectively26. Exports and export-supported jobs have showed strong growth rates until the middle of the decade, followed by a drop exacerbated in 2009 as a result of the international financial crisis. The fluctuations in the employment level are less important than those of exports; nevertheless both followed a similar trend.
In relation to total production and total employment, growth was continuous with only a slight drop in production in 2009. These divergent trajectories demonstrate that not only the share of jobs supported by exports is a small one, as shown above, but also that total production continued to grow and create jobs during the second half of the decade; contrastingly, a shift in export performance is seen in the same period, consequently also impacting the number of export-oriented jobs. This pattern emphasizes the perception that production oriented towards the domestic market has indeed been responsible for the expansion of employment, and that exports have not contributed in a significant manner to domestic jobs creation.
25 If we take the exports of goods in relation to total production of goods and services, the export
coefficient would much smaller, and also inferior to the ratio between jobs supported by exports and total employment of the economy. The coefficient averaged 7%, having dropped to 6% in 2009. Given that here we work solely with exports of goods, we believe that adopting the first coefficient makes more sense when drawing a comparison between the amount of export production with the share of jobs driven by exports.
26 The values of exports and production, supplied in current BRL $ in the National Accounts (IBGE) were
deflated here in order to express them in 2009 prices. For this purpose, the GDP deflator was used (National Accounts, IBGE).
19 As showed above, imports have displayed a rising trend since the mid-2000s, resulting from the increased import penetration rate in the domestic market of goods, especially in the post-crisis period. Despite the expansion in imports, domestic employment maintained an upward trend. That is to say, had imports that compete against domestic products not recorded such an accelerated rate of growth, it is reasonable to assume that total employment would have grown further.
Figure 7. Evolution of employment, Gross Production Value, and Exports in Brazil, 2002-2009 (base 2000=100)
Source: own elaboration based on data of SECEX/IBGE and PNAD/IBGE.
The assessment of data on export-driven jobs generated within large economic sectors produced information on: different evolution paths across sectors; how exports from each sector contributed to job creation; and, finally, the existing gap between the structures of export-oriented jobs and total employment (Table 5).
90 110 130 150 170 190 210 2000 2001 2002 2003 2004 2005 2006 2007 2008 2009 Employment Direct and Indirect Jobs - Exports Exports (2009 BRL $) Production Value (2009 BRL $)
20 Table 5. Evolution of employment associated with exports and total employment by large economic sectors (total and % employed)
Direct and indirect employment
associated with exports Total employment (jobs)
2002 2005 2009 2002 2005 2009 Agriculture 4,928,688 5,543,603 4,821,428 17,353,605 18,980,620 16,777,825 Mining Industry 121,491 150,376 144,217 248,402 275,704 296,198 Manufacturing 2,351,826 2,817,973 2,038,900 9,650,550 11,673,764 12,255,785 Services 2,158,305 1,289,552 2,009,784 55,376,510 59,975,585 67,317,331 TOTAL 9,560,310 9,801,504 9,014,330 82,629,067 90,905,673 96,647,139
Direct and indirect employment associated with exports / Total employment (%)
Agriculture 28,4 29,2 28,7 - - -
Mining Industry 48,9 54,5 48,7 - - -
Manufacturing 24,4 24,1 16,6 - - -
Services 3,9 2,2 3,0 - - -
TOTAL 11,6 10,8 9,3 - - -
Expansion rate of employment associated with exports and of total employment (in %)
2002-2005 2005-2009 2002-2005 2005-2009 Agriculture - 12.5 -13.0 - 9.4 -11.6 Mining Industry - 23.8 -4.1 - 11.0 7.4 Manufacturing - 19.8 -27.6 - 21.0 5.0 Services - -40.3 55.9 - 8.3 12.2 TOTAL - 2.5 -8.0 - 10.0 6.3
Notes: expressed in number of jobs and % of total employment (number of employed people). Source: own elaboration based on data of SECEX/IBGE.
The main reason behind the different levels of employment generated by exports across sectors is the labor intensity—both direct and indirect—of these sectors. Most jobs driven by exports of goods are associated to agriculture, cattle farming and fisheries—amounting to about 53% of total jobs supported by exports in 2009. This is due primarily to the high labor intensity of these activities, since they account for only 12% of overall exports in 2009. Export-driven job creation accounted for about 29% of total employment in these sectors, featuring a slight decline in absolute terms over the decade. This declining trend can also be observed in total employment, and it is linked to an ongoing mechanization process in agriculture.
In the case of mining products, which in 2009 amounted to 16% of total Brazilian exports, the creation of jobs is extremely low since this industry is not labor intensive. In 2009, they accounted for 1.6% of total employment. There was an increase in employment in this sector over the decade, and the jobs associated to exports amount to an important share of total jobs in the sector (48.7% in 2009), but the overall contribution of the mining industry to the total number of jobs created in the economy is very low.
21 The second largest generator of export-driven jobs is the manufacturing sector, which represented 22.6% of total employment generated by exports in 2009. This share is by far superior to the sector’s share in total employment, recording 12.7% in 2009. Nevertheless, the number of export-supported jobs as well as the percentage of employment driven by exports in the industrial sector dropped significantly across the decade27.
The share of jobs from the service sector—which are by definition indirect jobs since we are only taking into account exports of tradable goods—is quite high. In 2009, services accounted for 22.3% of total jobs supported by exports. The number of jobs associated with exports in the service sector fell over the decade, as opposed to the trend observed in overall employment.
The sectoral composition of employment associated with exports differs strongly from that of overall jobs (total employment). In the case of total employment, the service sector is the most important employer—in 2009, it generated 69.7% of overall jobs—while the manufacturing industry made up for 12.7%, and mining for 0.3%. Even though this work only considers exports of goods, it is worth mentioning that the weight of services in export-driven employment is well inferior to the weight of this sector in total employment.
With regard to employment trends in the various sectors, while there was an increase in employment associated with exports in agriculture, mining and manufacturing during the first half of the decade, the trend was reversed in the second half. Only the service sector showed an opposite trend, with an initial decrease followed by expansion. The evolution of export-supported jobs differs from what occurred in total domestic employment, which grew in all sectors during both periods, except for the decline shown in agriculture over the second half of the decade.
That is to say, as it has been shown by the aggregate data for the economy, total employment still went up regardless of the smaller contribution of exports to employment over the decade and of the higher penetration of imports in the domestic market. Besides the quantitative aspect, which shows how exports contributed little to
27 The industry sector shows higher productivity levels than the remaining sectors, since its share in total
employment and in export-driven jobs is considerably smaller than its share in both production value and exports.
22 job creation in Brazil even during a period of such strong growth in foreign sales, it is worth examining what kind of employment was generated. For this purpose, we elaborated a synthetic indicator based on selected characteristics of the labor market in order to disclose the "quality" of employment in each sector. The chosen features were years of schooling, average income and formality of employment. The higher the share of skilled workers, the average income, and the share of formal workers in a given industry, the better the jobs should be in that particular sector.
In order to assess the quality of jobs generated by exporting sectors, two different selections were made: the first was based on the growth rate of exports for the 2002-2009 period, and the second one according to the share in the exports pattern of 2009.
The five sectors featuring the highest export growth rates (measured here as the variation in the share of exports) in the 2002-2009 period were: ethanol, cattle farming, oil, iron ore and pharmaceuticals (see Table 6). In 2009, these sectors together amounted to 16.7% of total Brazilian exports and 5.6% of total employment. Also, they comprise 9.6% of all export-supported jobs. Out of these, 8.6% belong to the cattle-raising and fishing sectors, whose exports—especially meat products—steadily increased throughout the 2000s. However, they also show particularly low levels of the Employment Quality Index (EQI), standing out in comparison to other sectors. At the other extreme, the five sectors with the lowest rate of change in their share in exports during the period were: furniture, leather and shoes, wood products, electronic and communication equipment, and wearing apparel. These sectors totaled 5% of overall Brazilian exports in 2009 and a little over 4% of total employment as well as export-supported jobs. The EQI suggests that only the electronic and communication equipment sector presents more positive characteristics in terms of employment quality; nevertheless, both its shares of total employment and of export-supported jobs fall below 2%.
When the selection is carried out in terms of share in exports (in 2009), the top performing sectors are: food and beverages, agriculture, iron ore, oil, and steelmaking and steel products (Table 7). The first two sectors in 2009 accounted for 32% of exports and 50.9% of jobs supported by exports, due to the strong contribution of agriculture. However, these two sectors present a very low EQI, which demonstrates that most jobs created by exports are low quality ones. The remaining three sectors display EQIs
23 between 0.7 and 0.9; however, their contribution in terms of employment is very low. Among the five sectors with the smaller share—domestic appliances, paints and coatings, wearing apparel, newspapers and magazines, and cement—the EQI ranges from 0.2 to 0.7 without a set pattern. Moreover, the contribution of these sectors to export-supported jobs creation is low. The results suggest that not only exports do not create many jobs, but also these jobs are mostly poor quality ones, as indicated by the EQI.
24 Table 6. Characteristics in terms of exports, production value, employment, and quality of employment of five Brazilian export sectors
with higher and lower export growth rates in the 2002-2009 period
Cumulative growth 2002-2009 (in %) Share in 2009 – (in %)
Five export sector with higher growth (in %) Exports Production value Occupation Labor content of exports1 average EQI (2002-2009)
Exports Occupation Labor content
of exports1
Ethanol 3.1 1.2 2.1 2.7 0.6 0.9 0.1 0.3
Cattle farming and fisheries 3.0 1.0 0.8 0.9 0.1 0.4 5.2 8.6
Oil and natural gas 2.1 1.1 1.8 2.3 0.9 5.9 0.1 0.3
Iron ore 1.8 1.2 1.5 1.9 0.7 8.7 0.0 0.4
Pharmaceuticals 1.5 1.0 1.0 1.3 0.7 0.8 0.1 0.1
SUBTOTAL 16.7 5.6 9.6
Five export sector with lower growth (in %)
Furniture and other manufactured goods 0.5 0.9 1.0 0.6 0.3 0.8 0.9 0.7
Leather products and shoes 0.4 0.6 0.9 0.6 0.4 1.7 0.6 1.8
Wood products – excluding furniture 0.4 0.7 0.9 0.5 0.3 1.1 0.5 1.4
Electronic and communication equipment 0.4 0.6 0.9 0.6 0.7 1.3 0.1 0.2
Wearing apparel and accessories 0.4 0.9 1.0 0.5 0.2 0.1 2.0 0.3
SUBTOTAL 5.0 4.1 4.3
25 Table 7. Characteristics in terms of exports, production value, employment, and quality of employment of five Brazilian export sectors
with higher and lower shares in overall Brazilian exports in 2009
Cumulative growth 2002-2009 (in %) Share in 2009 - (in %)
Five export sectors with higher shares (in
% total) Exports Production value Occupation Labor content of exports1 average EQI (2002-2009)
Exports Occupation Labor content
of exports1
Food products and beverages 1.1 1.0 1.2 1.3 0.4 20.4 2.5 6.0
Agriculture, forestry, lumber 1.4 0.9 0.8 1.1 0.0 11.6 12.1 44.9
Iron ore 1.8 1.2 1.5 1.9 0.7 8.7 0.0 0.4
Oil and natural gas 2.1 1.1 1.8 2.3 0.9 5.9 0.1 0.3
Steel products 0.8 0.9 1.1 1.0 0.7 5.2 0.1 0.5
SUBTOTAL 51.9 14.8 52.1
Five export sectors with lower shares (in % total)
Domestic appliances 0.7 1.5 1.4 0.6 0.7 0.2 0.1 0.0
Paints, varnishes, lacquers and enamels 1.1 1.0 1.1 0.8 0.7 0.1 0.0 0.0
Wearing apparel and accessories 0.4 0.9 1.0 0.5 0.2 0.1 2.0 0.3
Newspapers, magazines, records 0.6 0.8 1.0 0.9 0.6 0.1 0.4 0.2
Cement 1.0 1.1 1.4 1.3 0.4 0.0 0.0 0.0
SUBTOTAL 0.6 2.5 0.6
26 To the purpose of assessing how the quality of employment generated by exports has evolved and comparing it with the trend in the quality of total domestic employment, we calculated an average EQI indicator for all sectors weighted, on the one hand, by direct and indirect jobs generated by exports and, secondly, by total employment (Table 8)28. The average index obtained for employment supported by exports fell from 2002 to 2005, and then underwent a significant recovery until 2009, reaching a value close to the initial level. Compared to the weighted indicator for sectoral output, the EQI for employment linked to exports is much lower. Moreover, the evolution of production-EQI has shown a marked improvement trend over the whole period.
Table 8.Evolution of the quality of total employment and employment supported by exports, measured by the average sectoral EQI.
2002 2005 2009
Exports QEI 0.227 0.215 0.226
Production EQI 0.303 0.306 0.321
Source: SCN/IBGE; PNAD/IBGE; SECEX.
28 The exports-EQI is calculated from a sectoral EQI average, weighted by direct and indirect jobs
associated with exports for each year. The production-EQI is similar to the former, differing only in the weight applied, which in this case is domestic employment by sector. The EQI used in this work is the average of the three years for each sector.
27
27 5. Conclusions
Brazil went through a period marked, on the one hand, by intense growth in export volumes combined with a major change in the exports pattern. On the other, social indicators pointed towards an improvement in income distribution and a decline in poverty levels. The contribution of exports to Brazilian economy growth throughout the 2000s was a significant one, as demonstrated in the second part of this report. In light of these events and of the international debate over globalization effects on national economies, this study sought to examine the extent to which the rapid growth of external trade contributed to the improvement of the labor market. Although the job market is but one of the possible transmission channels of trade effects to poverty, it seems to play a central role in recent Brazilian history, since labor market expansion represented in the last decade the main source of poverty reduction and improvements in income distribution when compared to other sources of income (especially cash transfers and social programs).
In this paper, the direct and indirect labor content of exports was estimated in order to assess how the number of jobs supported by exports has evolved. Subsequently, an indicator for the "quality" of employment, based on information on workers’ income, schooling, and employment formality, was elaborated.
The "primarization" trend seen in Brazilian exports has brought about changes in the type of jobs associated with trade. Productive sectors are linked to different amounts of direct and indirect labor, according to their production chains. Therefore, the expansion of agricultural and mining products exports exerted opposite effects on the number of direct jobs: while agriculture is the most labor intensive activity of the economy, mineral extraction has one of the lowest labor to output coefficients. In terms of indirect employment, both sectors present low backward linkages and hence do not generate high amounts of indirect labor as in the case of manufactured products.
Additionally, over time there was a generalized reduction in the amount of work required for the production of goods. In agriculture, for example, mechanization was responsible for a significant reduction in the sector’s labor coefficient. In other sectors, productivity gains stemming from organizational or technological changes led to the same trend.
28
28 The estimated employment generated by exports corresponded to about 10% of Brazil's total employment until 2008 ( the international financial crisis had significantly altered the outcome in 2009). Of these 10%, 4% are direct jobs and 6%, indirect jobs.
Despite the nearly continuous growth in exports between 2000 and 2009, employment generated by exports did not follow the same trajectory. Up to 2004, when exports— including industrial—presented an upper trend, indirect employment (and consequently total employment) was also in the rise. From 2005 on, when exports growth was driven mainly by agricultural and mining products, the quantity of indirect jobs shrank, returning to the level recorded in the beginning of the decade.
The exports-related type of employment displayed a very different profile from that observed in the overall Brazilian job market. This is explained by the country’s export pattern, increasingly concentrated in agricultural and mineral commodities. The indicator used to proxy/approach/measure quality employment, the EQI, synthesizes information on three relevant characteristics that can vary according to sectors— namely, workers' income, years of schooling and the level of employment formality. The agricultural sector presented the lowest index, which suggests that this sector offers positions of inferior "quality". In turn, the mining industry showed a higher EQI than agriculture, reflecting the good performance of the oil and gas sector in terms of quality of employment. However, unlike agriculture, this sector doesn’t generate a large number of jobs.
In comparison, the "quality" of overall domestic employment is higher than that of export-driven jobs. Moreover, the indicator of job quality in exports over the decade has not followed the same pace of the indicator used for domestic production, which has grown steadily during the period.
Our findings therefore suggest that the export growth in the 2000s did not contribute substantially to the improvement of employment associated with trade. First, no significant increase in jobs supported by exports was recorded: on the contrary, there has been a decrease in export-driven jobs. Second, the jobs supported by exports exhibit worse "average quality" levels than those driven by domestic production. In this regard, the contribution of exports to poverty alleviation seems to be a limited one—at least, in regard to the labor market transmission channel. The reduction in poverty seems to
29
29 result rather from domestic economic growth combined to the adoption of certain public policies that positively impacted the labor market (namely, the policy of minimum wage raises and the incentives towards employment formality). Income transfer policies, whether within the framework of pensions and other benefits or whether under social programs (such as Bolsa Familia), have also had a positive influence in poverty alleviation, but to a lesser extent.
The fact that emerges from this set of findings is that the export sector—heavily concentrated in primary products—has had a weak impact on the improvement of social indicators and poverty alleviation. This is due, on the one hand, to the characteristics of the Brazilian export pattern. On the other hand, it is attributable to the high importance of the Brazilian domestic market, whose dynamism—in combination with various public policies—accounted for the positive performance of the labor market in recent years, which in turn gave rise to advancement in poverty reduction.
30
30 ANNEX
The data set shows the evolution and composition of the Gross Domestic Product (GDP) and gross fixed capital formation from 1991 to 2009. The data source of these variables was the Brazilian Institute of Geography and Statistics (IBGE). Values were utilized at constant and current prices. The data cover the three main economic sectors: agriculture, industry and services. The foreign trade data come from the Bureau of Foreign Trade (SECEX / IBGE) and the System of National Accounts (SCN), covering the period from 2000 to 2012. The data from the System of National Accounts are limited to 2000-2009. As data for later years are not yet available, it was not possible to provide estimates on labor content for the post-2009 period.
Data on the Value of production, Exports, Imports and Employment for 2000 to 2009 were used to estimate the labor content associated with foreign trade, and were obtained from the System of National Accounts, IBGE, at current values.
The indicators concerning characteristics of employment were constructed for the years 2002, 2005 and 2009 from the National Household Sample Survey (PNAD), which incorporates workers aged 10 or older. As expected, it was necessary to harmonize different levels of aggregation of the values obtained from the System of National Accounts (value of production, exports and imports) and National Household Survey (employment). In concept, the average revenue utilizes the ratio of (salary + mixed income) / occupations, while the average income per main job comprises gross monthly cash revenues received from the main job during the reference month adopted by the PNAD/IBGE. The average income data used for the Employment Quality Indicator (EQI) are expressed in current values; however, as they are compared solely across sectors, there is no need for applying deflation.
The sectorial classification utilized in the calculations of labor content is the one adopted in the System of National Accounts - Level 50 (IBGE), which lists sectors as follows (56 sectors in total). Table 1 of the report presents an aggregation elaborated by the authors, based on this classification.
31
31
101 Agriculture, forestry, lumber 324 Machinery and equipment, including maintenance
102 Cattle farming and fisheries 325 Household appliances
201 Oil and natural gas 326 Machinery for offices and IT equipment 202 Iron ore 327 Electric machinery, devices and materials 203 Other mining sectors 328 Electronic material and communication
equipment
301 Food and beverages 329 Medical/hospital measurement and optic tools/devices
302 Tobacco products 330 Cars, small trucks and utility vehicles 303 Textiles 331 Trucks and buses
304 Wearing apparel and accessories 332 Parts and accessories for motor vehicles 305 Leather products and shoes 333 Other transport equipment
306 Wood products – exclusive furniture 334 Furniture and misc. products
307 Pulp and paper products 401 Electricity and gas, water, sanitation, urban cleaning
308 Newspapers, magazines, records 501 Construction 309 Oil refining and coke 601 Commerce
310 Ethanol 701 Transport, storage and mail 311 Chemical products 801 Information services
312 Elastomer and resin manufacturing 901 Financial intermediates and insurance 313 Pharmaceutical products 1001 Real estate services and rent
314 Agricultural pesticides 1101 Services of maintenance and repairs 315 Perfumery, hygiene and cleaning products 1102 Accommodation and catering services 316 Paints, varnishes, lacquers and enamels 1103 Provision of services to companies 317 Misc. chemical products and preparations 1104 Commercial education
318 Rubber and Plastic products 1105 Commercial healthcare
319 Cement 1106 Other services
320 Other non-metallic products 1107 Household services 321 Steelmaking and steel products 1201 Public education 322 Metallurgy of non-ferrous metals 1202 Public healthcare 323 Metal products – exclusive machinery
and equipment
32
32 References
Bielschowsky, R. Cinqüenta anos de pensamento na CEPAL: uma resenha. In: ______. (org). Cinqüenta anos de pensamento na CEPAL. R. Janeiro e São Paulo: Record, 2000. p.137-178.
Campello, T. and Neri, M. C. (Orgs.). Programa Bolsa Família: uma década de
inclusão e cidadania. Brasília: Ipea; MDS, 2013.
Castilho, M. Integración Regional y Mercado de Trabajo: Repercusiones en Brasil. Revista de la CEPAL, v. 87, p. 151-170, 2005.
Castilho, M. A Inserção do Brasil em um Mundo Fragmentado: Uma análise da estrutura de comércio exterior brasileiro. In: Luciana Acioly e Marcos Antonio Macedo Cintra. (Org.). Inserção Internacional Brasileira: temas de economia internacional. 1ed.Brasilia: IPEA, 2010, v. 2, p. 369-396.
Castilho, M., Menendez, M. and Sztulman, A. (2012) Trade liberalization, inequality, and poverty in Brazilian states, World development 40 (4), 821-835
Chenery, H. and Watanabe, T. International Comparisons of the Structure of Production. In: Econometrica, 26(4): 487-521, 1958.
Cruz, L. E. Emprego e comércio industrial brasileiro: 1980-1993. Rio de Janeiro: PUC, 1996 (Dissertação de Mestrado).
Hoffman (2013) Transferências de renda e desigualdade no Brasil (1995-2011). In: Campello, T. and Neri, M. (Orgs). Programa Bolsa Família: uma década de inclusão e cidadania. Brasília: Ipea.
Jiang, X. Capturing the jobs from globalization: trade and employment in the global value chains. 2013. Disponívelem: http://www.capturingthegains.org/pdf/ctg-wp-2013-30.pdf
Kucera, D. and Milberg, W. Trade and the Loss of Manufacturing Jobs in the OECD: New Factor Content Calculations for 1978-1995.In: Review of World Economics,139(4), 2003.
Kucera, D. and Roncolato, L. Trade liberalization, employment and inequality in India and South Africa.International Labour Review, 150(1-2), 1–41, 2011.
Lavinas, L. (2013) 21st century welfare.New Left Review, 84 nov-dec, p. 5-40.
Lydall, H. Trade and employment: A study of the effects of trade expansion on employment in developing and developed Countries. Geneva, ILO, 1975.
McMillan, M. and Rodrik, D. Globalization, structural change and productivity growth. NBER Working Paper No. 17143, 2011.
Miller, R.E., and Blair, P.D. Input-Output Analysis: Foundations and Extensions. Cambridge: Cambridge University Press, 2009.
Rodrik, D. Has globalization gone too far? Washington, DC: Institute for International Economics, 1997.
Saboia, J, Efeitos do Salário Mínimo sobre a Distribuição de Renda no Brasil no Período 1995/2005, Econômica, v. 9, n. 2, Dezembro de 2007.