DOCUMENT DE TRAVAIL
WORKING PAPER
N°08-22.RS
RESEARCH SERIES
NO CONTAGION,
ONLY GLOBALIZATION AND FLIGHT TO
QUALITY
Marie BRIERE
Ariane CHAPELLE
Ariane SZAFARZ
Avenue F.D. Roosevelt, 50 - CP-140 l B-1050 Brussels l Belgium
DULBEA l’Université Libre de Bruxelles
No contagion,
only globalization and flight to quality
M. Brière1,2, A. Chapelle1, and A. Szafarz 1,3
November 2008
Abstract
In this article, tests for globalization and contagion are separated using an ex ante definition of crises, and contagion tests are neutralized with respect to globalization effects. A large database is constructed to study the stability of correlation matrices for four asset classes: equities, government bonds, and corporate bonds – investment grade and high yield – in four geographical zones. Overall, the results confirm the instability of correlations and point to a combination of globalization and flight to quality, while emphasizing that contagion on the equity markets appears as an artifact due to globalization.
Keywords: contagion, globalization, flight to quality, international financial markets. JEL: G15, G11, F36, F21
1
Centre Emile Bernheim,
Solvay Business School, Université Libre de Bruxelles Av. F.D. Roosevelt, 50, CP 145/1, 1050 Brussels, Belgium. 2
Crédit Agricole Asset Management, 90 bd Pasteur, Paris, France
3
DULBEA, Université Libre de Bruxelles
Comments can be sent to [email protected]
The authors thank Hei-Hung Chan and Pierre Philippe for their contribution to this study, and Michel Aglietta, Jan Annaert, Virginie Coudert, Michel Dacorogna, and Kim
A. Introduction
The interdependence of financial markets is a serious concern for investors looking to diversify their portfolios internationally. Yet, recent articles have observed an uptrend in correlations among financial centers – a major warning signal. Two analytical frameworks exist side by side on this issue. Some see economic globalization, coupled with the growing integration of financial markets, as the main reason for these developments. Others attribute the empirical findings to market contagion during crises.
On the one hand, the globalization phenomenon, i.e. the general increase of correlations within asset classes and across geographical areas over the past decades, is well documented, both for equities (Berben and Jansen (2005)) and for government bonds (Hunter and Simon (2004)) On the other hand, crises can be transmitted to markets other than those in which they originate, leading to a contagion effect. Empirical studies (Lin et al. (1994); De Santis and Gérard (1997); Corsetti et al. (2005); Wälti (2003)) found that correlations increased in equity markets during hectic periods, pointing to the presence of contagion. However, according to Hartmann et al. (2004), equity markets are twice as likely as bond markets to crash simultaneously.
Besides, correlations across different asset classes are shown to decrease in times of crises, creating potential for diversification through asset allocation (Smith (2002); Hunter and Simon (2004)). This is particularly the case for correlations between bonds and equities (Connolly et al. (2005)). The contrast between the global increase within each asset class and the correlation decrease across asset classes seems to be explained
funds towards safer assets, leading to “decoupling”: higher correlations within the equity markets but negative correlations between government bonds and equities (Gulko (2002)). The decrease in equity and bond correlations during crises, attributable to flight to quality effects, may be present whether associated or not with contagion.
Contagion can be confused with globalization since both have a tendency to increase correlations among assets, especially during periods of high volatility coupled with bear markets (Longin and Solnik (1995), (2001); Silvapulle and Granger (2001); Chesnay and Jondeau (2001)). In a theoretical paper, Calvo and Mendoza (2000) show that globalization may promote contagion by weakening incentives for gathering costly information. On empirical grounds, Forbes and Rigobon (2002) deny the existence of contagion as such. They exhibit a high level of market co-movement in all periods, not only crises– a phenomenon they refer to as interdependence. Similar results are found by Flavin and Panopoulou (2008). Our paper attempts to go further in dissociating globalization and contagion phenomena by testing them separately while including all market and banking crises from 1978 to 2007.
Contagion and globalization are not necessarily mutually exclusive, but they are difficult to separate econometrically (Bekaert et al. (2005)). One major problem consists in identifying precisely what constitutes a crisis period. For investors, though, the practical consequences will be different depending on whether these developments are attributable to increasing market globalization or to crisis contagion. In the first case, a gradual but unstoppable movement can be expected. In the second, investors will have to be especially careful when international volatility is high, because increased risk will
be compounded by a decline in diversification protection. Optimal portfolio management depends on proper identification of the effects at work.
This article makes use of the tests for correlation stability that were laid down by Jennrich (1970) and refined by Goetzmann et al. (2005) through new advances in asymptotic theory. We propose an original empirical study that is broadly scoped in terms both of geographical coverage and of asset classes. We abide by established crisis definitions to avoid a personal classification that might be tainted by endogeneity.
Although most research has concentrated on equity markets, we broaden our scope to include government and corporate bonds, the latter being almost completely uncharted in the literature on globalization and contagioni. We also distinguish between investment grade (IG) and high yield (HY) bonds, so as to segment bond products according to whether they are primarily dependent on interest rate risk or on default risk. Furthermore, we simultaneously analyze the impact of 15 crises on asset markets between 1978 and 2007. Securities are divided into 15 categories depending on their financial characteristics and geographical zone.
Our results confirm the presence of globalization, with several nuances. In particular, the bond market segments do not appear to be greatly affected. By contrast, contagion effects are not corroborated by the data when corrected for globalization. In addition, our findings suggest that the tendency towards flight to quality dominates during crisis periods.
The remainder of the article is organized as follows. Section 2 presents the tests for correlation stability that will be used in the empirical section. Section 3 describes the database used. Sections 4 and 5 form the heart of the article, proposing globalization tests followed by contagion tests. In the latter case, the definition of crises necessitates some documentary research, which we describe in Appendix 1. Section 7 concludes.
B. Testing the stability of correlations between financial series
Correlations among financial data series are a key tool in portfolio management and risk control. Markowitz's classic model is based on knowledge of the entire variance-covariance matrix of returns, and hence of all correlations within the set of securities analyzed. The assumption that these parameters remain stable over time guarantees the consistency of forecasts based on past data. But this stability has recently been challenged by a large body of econometric research.
In recent years, analyses of the stability of second-order parameters, i.e. variances, covariances and correlations, have developed considerably from a theoretical perspective and have been tested empirically many times. Regime-switching tests could be a simple option in this regard. Unfortunately, testing the existence of two correlation regimes may prove difficult. The main problem lies in identifying the observation dates corresponding to each of the two possible states. Crises are generally identified by high volatility in one or more asset classes that are being tested for correlations. But splitting
It is nevertheless possible to test the stability of correlations versus the onset of contagion during crises provided that crises are delineated beforehand. Therefore, we identify crises based on their fundamental determinants and not on equity or bond volatility (see Appendix 1). Once crises periods have been precisely delineated, we test the null hypothesis of equality between all correlations across assets during both crisis and normal periods.
The test, proposed by Jennrich (1970), is based on the chi-square distance between two correlation matrices. Its validity is established under the normality assumption. The null hypothesis is the equality of the correlation matrices and of the asymptotic variance-covariance matrices, which represents a significant restriction. In particular, because crises occur relatively infrequently, there is a greater possibility of measurement error for correlations during turbulent periods. The Jennrich (1970) test has been applied by Kaplanis (1988) and Annaert et al. (2006), among others.
Goetzmann, Li and Rouwenhorst (2005) (GLR) employ the same test statistic as Jennrich (1970), but draw on knowledge of the asymptotic variance-covariance matrix, denoted Ω, developed in Browne and Shapiro (1986) and Neudecker and Wesselman (1990). Consider two sub-periods of lengths n and 1 n , along with correlation matrices 2 p×p measured in the two corresponding sub-samples, denoted R and 1 R . In a case 2
where the asymptotic variance-covariance matrices are identical (Ω = Ω = Ω ), GLR 1 2 obtain the following resultii:
(
1 2)
1 2 1 1 0, vec R R N n n ⎛ ⎛ ⎞ ⎞ − → ⎜⎜ ⎜ + ⎟Ω⎟⎟ ⎝ ⎠ ⎝ ⎠. (1)The test statistic is asymptotically distributed as 2
(
1)
2 p p− ⎛ ⎞ χ ⎜ ⎟ ⎝ ⎠ and is written:(
)
(
)
1 2 1 2 1 2 1 2 1 1 ' vec R R vec R R n n − ⎡⎛ ⎞ ⎤ χ =⎡⎣ − ⎤⎦ ⎢⎜ + ⎟Ω⎥ ⎣⎡ − ⎤⎦ ⎝ ⎠ ⎣ ⎦ , (2)where the asymptotic matrix Ω may be determined analytically when observations are assumed to come from i.i.d. p-variate distributions with finite fourth-order moments. Although it simultaneously tests the equality of correlation matrices and asymptotic variance-covariance matricesiii, the GLR method remains the most effective way of dealing with the case of p-variate distributions where p>2.
C. Data
The database includes weekly returns to indices for equities, government bonds and corporate bonds, based on geography and, in the case of bond indices, on ratings. The series are the longest we could find for each asset class since the purpose is to study the impact of globalization which is, by definition, a long-term phenomenon.
Our analysis focuses on four geographical areas: the U.S.A., the Eurozone, Japan and the U.K. For equities, we use the indices constructed and supplied by Datastream (DS indices) for the period from August 1978 to May 2007. These indices are denominated in local currencies and include dividends. They are weighted and cover at least 75% of the total capitalization of the markets they represent.
bellwether, generally the last bond issued by the country's Treasury in a given maturity. Factors such as liquidity, issue size and coupons are also taken into account when choosing the index components. Weekly data are available from January 1980 onwards, except for Japan, where the series begins in January 1984. Accordingly, the period under review goes from January 1984 to May 2007.
For corporate bonds, we use two categories: investment grade, with ratings between AAA and BBB-, and high yield, rated from BB+ to CCC. The indices are denominated in local currencies and include coupon returns. Convertible bonds are excluded. The weekly data cover the period between July 1998 and May 2007. They are sourced from Merrill Lynch (i.e. bids quoted by traders at the ML desk) at the market closev. All indices have been hedged in dollars.
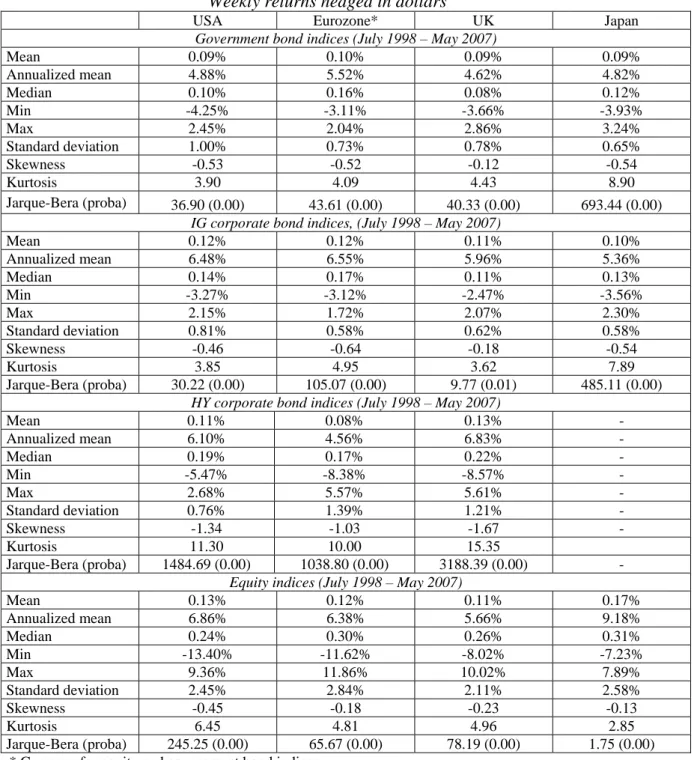
As some data series (equities) are longer than others (HY bonds), the descriptive statistics in Table I have been established on the common observation period stretching from July 1998 to May 2007 (except for Japanese HY corporates) to allow for comparisons. Unsurprisingly, the government bonds are the assets with the lowest annualized return, while IG corporate bonds display returns that are higher than those on HY bonds and similar to equity returns. This is typical of a period characterized by decreasing long-term interest rates, like the one markets have experienced until recently. More interesting is the low level of standard deviations of HY bond returns over the period. The reason lies probably in the decorrelation between the interest rate component and the credit risk component, which evolve in opposite directions when the economic situation changes. This creates a compensating effect in HY bond portfolios, decreasing the overall volatility at index level. This effect is found partly, although to a much lesser extent, in corporate bonds.
Skewness takes a negative value for all the assets under review. Kurtosis exceeds the reference value of the normal distribution (equal to 3) for all countries and asset classes. This leptokurticity is typical of financial data series. The non-normality of returns is confirmed by the Jarque-Bera test. Phillips-Perron tests (not reported here) confirm that all the series are stationary.
[Insert Table I here]
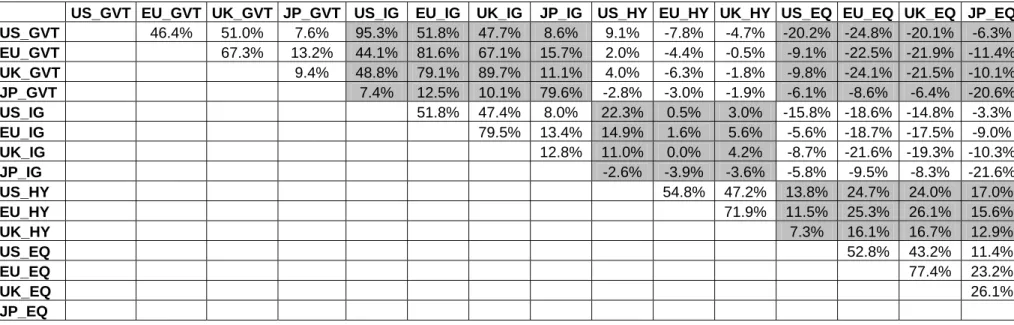
Table II shows all the correlations for the same period, marked by high equity market volatility, the "tech bubble" and a string of crises in bond markets and emerging economies. Broadly, correlations are negative between equities and government and IG bonds in all countries. By contrast, the correlations between high yielders and equities are positive. This last result is consistent with the findings of several authors (Fama and French, 1993; Alexander et al., 2000). Co-movements between low-rated bonds and equities are commonly attributed to the importance of the credit risk component in HY bonds – a factor shared with equity returns. Likewise, correlations between HY and IG bonds are generally close to zero or even negative. Within the same asset class, the strongest geographical correlations are found between the Eurozone and the U.K., with a maximum of 86% for equity markets; and the weakest are those for Japan, as other research has shown (Hunter and Simon (2004); Berben and Jansen (2005)).
D. Globalization tests
The recent literature tends to suggest that geographical correlations within asset classes have increased over the last 20 years. This is true for equities and government bonds. This situation is linked to the rise of globalization.
Relying on the methodological analysis presented in Section 2, we test the equality of correlation matrices using the GLR (2005) test. The sample is broken into two sub-periods of equal length. The break date thus varies according to the dataset under consideration. Since the aim of the test is to detect an evolving phenomenon, the precise break date is not vital. Moreover, the results are not affected if the date is shifted slightly. We have therefore opted for a symmetrical choice, which is more accurate.
[Insert Table III here]
Table III summarizes the globalization tests performed with our database according to the econometric setting in (1) and (2). The result of the test carried out on all asset classes (16 indices, minus Japanese HY bonds, for which data are unavailable) is given in the first row of Table III. It shows that the differences in correlation between the two sub-periods are significant for all asset classes under consideration, thus confirming the impact of globalization on market interdependence during the previous decade.
But this finding, which confirms those established previously for international equity markets (Berben and Jansen (2005); Chesnay and Jondeau (2001)), should be treated
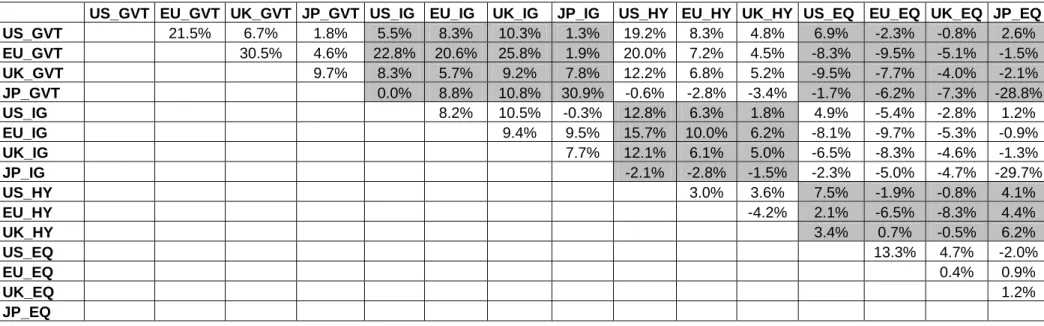
with caution. This is because the GLR test is bilateral, and the statistic measures the correlation differences, both positive and negative, between sub-periods. To give a clearer picture of the impact for each asset category, we have shown the correlation differences in Table IV: Δρij =ρij(period 2)−ρij(period 1).
If all the correlations had increased, the table would show positive items only. But this is certainly not the case. Taking a closer look, however, we can see that the negative items in Table IV mainly concern the correlations between different types of asset. For example, the correlation between US Treasuries and European equities fell 2.3%. Interpreting this type of observation is obviously problematic and the link with the intuitive idea of globalized financial marketsvi remains vague.
We therefore ran a second set of intra-asset class tests using the three 4 X 4 matrices and the 3 X 3 matrix from the lower rows of Table III. The results point clearly to a globalization effect in the equity and government bond market but none whatsoever in the corporate bond markets (HY and IG, separately). Accordingly, there appears to be no globalization in these two bond market segments.
In terms of methodology, there is a major difference between the first test and the last four. Whereas the statistics from the former set mix geographical and inter-class globalization, the latter take account of purely geographical correlations only. In sum, our results point to globalization in equity markets combined with decorrelation between equities and bonds. The data for same-type geographical corporate bonds lead us not to dismiss the stable correlation hypothesis.
It has been observed that Japan plays little part in financial globalization. Even today, the Japanese market is only loosely correlated with other world markets. The last column in Table IV, which shows Japanese equities, stands out singularly from the other columns showing the equity markets of the other three regions.
[Insert Table IV here]
E. Contagion tests
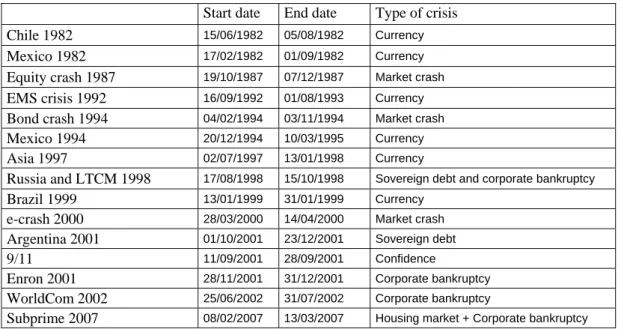
Our definition of "crisis" is broad. It encompasses five types of movement: currencies, sovereign debt, events arising from a bond or equity crash, corporate bankruptcies or loss of confidence (Enron, WorldCom), and other crises of confidence, such as terrorist attacks. We have deliberately omitted crises of a purely banking nature unless they are related either to currency crises, where the impact on financial assets is more diffuse, or to economic crises such as recessions or oil shocks. The real difficulty lies in establishing precise timeframes for the crises we have selected.
The start and end dates used in this article (Table V) have been chosen solely on the basis of previous papers (Appendix 1), thereby avoiding, at least partiallyvii, the problem of endogeneity raised in Section 2. Admittedly, while the onset of a crisis is usually easy to identify, the end date is much harder to pinpoint. This awkward problem is highlighted by the Asian crisis (Appendix 1), which several authors have studied.
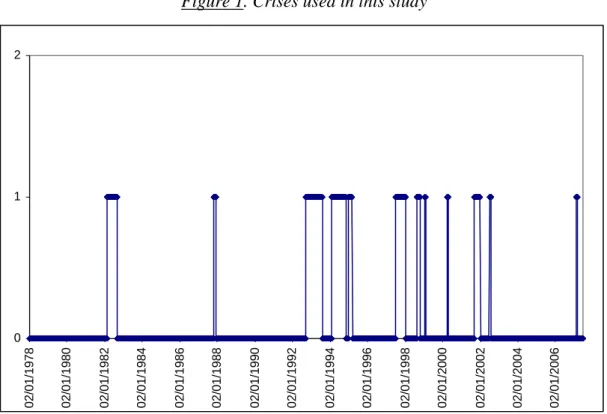
Figure 1 plots the dates of the crises, regardless of type, and shows that the majority occurred from the 1990s onwards. This may be due to pure randomness or to a short-sighted choice of turbulent periods, i.e. a tendency to choose only the most recent crises.
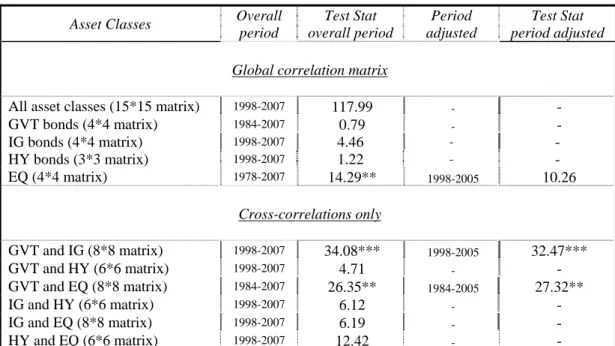
The GLR (2005) contagion test consists in comparing correlations among all markets, segregating crisis periods from other periods. Table VI gives the results of those tests. The results of the first four rows show that contagion is observed neither globally nor in the bond segments of the world markets.
[Insert VI here]
Contagion in the equity market is significantly detected at the 5% level, but not at the 1% level. In light of this result, we wanted to rule out the possibility that globalization could spill over to contagion. Financial globalization at world levelviii, which basically corresponds to the closer synchronization of economic cycles, can manifest itself in different ways. If, in addition, there is a contagion effect, this compounds the globalization effect. Since the crises identified earlier, shown in Table V and Figure 1, are over-represented in the second half of the sample period, there is indeed a risk that globalization will be confused with contagion.
To overcome the awkward problem of identification, we adjust the time periods to ensure that, for the entire period tested, crises no longer appear systematically at the beginning or the end of the sample. If the crises are spread evenly over the time interval under consideration, then the globalization effect will be "neutralized". As reported in Table VI (last two columns), adjusting the intervals in the cases does indeed affect the equity contagion result. Indeed, taking into account the adjusted sample period, contagion in the equity market is no longer significant, even at the 10% level. We therefore conclude that the contagion primarily detected in the unadjusted (full) sample
period actually appears to be an artifact caused by globalization. This observation probably explains the confused interpretation of some of the results presented in the literature.
The mixed case of the equity-bond link is harder to deal with because, by nature, it cannot be segregated in a specific correlation matrix, since the matrix always includes geographical correlations between equities and bonds as well. Therefore, we adapt the GLR test to partial correlation matrices by isolating the cross-correlations only, i.e. correlations between assets of different categories. For instance, in the first reported test of this category (see Table VI, second part, first row) the correlations between the U.S. sovereign and EU IG bonds are taken into account because the assets belong to different classes, while the correlations between the U.S. and EU sovereign bonds (same class assets) are excluded. In other words, these additional tests pick only on the pairs of securities that could generate flight to quality effects and rule out the ones that are more likely to be associated with contagion.
Among the six possibilities, only two lead to significant differences in correlation: GVT bonds/IG bonds and GVT bonds/equities. Moreover, these findings are not affected by the correction for globalization. Thus, crises do indeed affect the bond markets, but through cross-correlations, not through intra-class correlations. Moreover, the presence of a flight to quality in times of crisis is observed with no doubt. Scared by turbulence, investors pull out of the markets they consider too risky and seek safety in reliable bond issuers, especially governments. This flight to quality effect drives risk premia higher and reduces the correlations – some being already deeply negative – between asset
differences between crisis and quiet periods for the two pairs of assets which tested positively for this effect.
In conclusion, to prepare for crisis periods, diversifying between equities and bonds while employing an appropriate fixed income management strategy is just as important, if not more so, as managing the portion of the portfolio reserved for equities, even global equities. In this respect, there is good news for investors: even though equity volatility rises during periods of turmoil, it is offset – at least partially – by a steep fall in correlations with high quality bonds. The flight-to-quality phenomenon acts as an antidote to the perverse effects of crises on the global financial markets. Detecting it should therefore help to prevent the harmful effects of stock market crises.
[Insert Table VII here]
F. Conclusions
The recent empirical literature on market financing contains a strong message with major practical implications for risk management, namely that correlations on markets are broadly unstable. Two main factors are usually cited to explain regime breaks in correlations: economic globalization and crisis contagion. Structurally, the two factors are very different. Confusing them would then have a harmful impact on portfolio management.
effects, without considering the possibility that the results could be misinterpreted. To avoid that pitfall, we have used a sequential process that considers, firstly, the possibility of globalization and, secondly, overlying contagion.
Empirically, the data examined in this study are original in two regards: the asset classes covered and the number of market crisis analyzed. There is a vast literature on the behavior of international correlations in equity markets and, to a lesser extent, in the government bond market, but very little has been written about corporate bonds. We have split corporate bonds into IG and HY in order to measure more accurately the flight-to-quality that occurs in periods of high volatility – an occurrence that market practitioners are thoroughly familiar with. Although the literature on this subject is evolving rapidly, we are not aware of any other articles that address this topic in such a general framework.
Our second contribution is the exhaustive nature of our crisis study. We have not limited ourselves – as is often the case in the literature – to one or two crises, such as Russia, Asia, LTCM or Enron. Instead, we have dealt simultaneously with all identifiable crises in an effort to test as exhaustively as possible the assumption that asset correlations change during periods of turmoil. We selected the start and end dates of these periods with the utmost care, drawing on previous research but without using our database. In this way, we have been able to avoid the distorting effects of endogeneity, which would have arisen had we used realized volatilities to establish the dates.
In sum, our results confirm that globalization is present in all markets, with the exception of the corporate HY bond segments (IG bonds being borderline), where correlations are stable.
We therefore look for contagion, first disregarding the results of the globalization tests and then factoring them in. Contagion is immediately rejected for the fixed income assets. Concerning equities, contagion is detected at the 5% level in the first test irrespective of globalization bias, but disappears when the appropriate correction is incorporated. Therefore, we confirm the results obtained by Forbes and Rigobon (2002) and conclude that the initially detected contagion is an artifact caused by globalization.
Our conclusion rests heavily on the assumption that globalization is checked for before contagion, and not the reverse. Among the motivations for this assumption are the different natures of the two phenomena. While globalization is a permanent technologically - and economically- sensible financial driver, contagion is often thought of as an easy way to represent the excess financial movements, i.e. those for which no fundamental explanatory variables have yet been found, as testified by the literature on speculative bubbles (Adam and Szafarz (1993); Sornette and Malevergne (2001); Salge (1997)). So, by taking into account globalization first, we reduce as much as possible the residual volatility to be attributed to contagion.
Methodwise, the GLR (2005) test consists in opposing the null hypothesis of equal correlation matrices and the alternative of separate matrices, whatever the sign of the differences between entries. Conversely, the highly restrictive view states that globalization/contagion on a market must be characterized by an increase in correlations
for any pair of securities in that market. A middle approach would be to introduce an asymmetric GLR-type test that makes it possible to consider only increases in correlations. Thus, a “signed” matrix generalization of the test used in this article would open up new horizons for investigating both globalization and contagion. Moreover, non-normality distortions could be taken into account (see, e.g., Campbell et al. (2008)).
Finally, the flight to quality effect has been shown to remain after globalization has been taken into account. This observation is good news for investors, who can partially hedge against the crises by benefiting from a decorrelation between risky assets and safer bonds. While the amplitude of this hedge deserves further investigation, the effect might decrease as traders will realize that fleeing all risky assets when a crisis is feared is not the best option. In this respect, the flight to quality, like other market anomalies, is bound to disappear precisely because it has been identified. However, as pointed out by the behavioral finance stream of literature, some anomalies can prove self-fulfilling and persist much longer than expected under the rationality assumption. If indeed the flight to quality appears to be a consequence of irrational fears rather than of smart hedging attitudes during crises, then it will presumably last a long time.
Appendix: Crises selected for study
In this study, we examine five types of crisis: (1) currency crises , (2) sovereign debt crises, (3) crises triggered by an equity or bond crash, (4) corporate bankruptcies or loss of confidence (e.g. the collapse of Enron), and (5) crises of confidence arising from severe external events (e.g. 9/11).
Currency crises
Mexico 1976
The onset of the Mexican crises is usually dated to August 31, 1976, when the authorities decided to allow the peso to float (Bordo and Schwartz, 1996). That decision sparked a dramatic rise in inflation. According to the authors, the crisis ended on October 26, 1976, when the authorities devalued the peso by 27% against the dollar.
Chile 1982
The Chilean crisis began on June 15, 1982, when the government devalued the peso by 18% (Bordo and Schwartz, 1996). The end of the crisis is generally dated to August 5, 1982, when the currency was left to float freely (De Gregorio, 1999; Cowitt, 1984).
Mexico 1982
The second Mexican crisis began on February 17, 1982, when the authorities announced a 30% devaluation of the peso. On 12 August 1982, the Mexican finance minister informed the chairman of the U.S. Federal Reserve, the Treasury Secretary and the
managing director of the IMF that the country would be unable to meet its debt payments. The crisis then spread to other parts of Latin America, and by October 1983, 27 countries, including Brazil, Argentina and Venezuela, had either rescheduled their debt or were in the process of doing so. According to Bordo and Schwartz (1996), the crisis ended on September 1, 1982, when Mexico nationalized the banking system and imposed currency controls.
European Monetary System 1992
The EMS crisis began on September 16, 1992 when the Bank of England raised the base lending rate from 10% to 12% and announced the intention of raising it to 15% the next day (which it did not do). As a result, sterling dropped below its EMS floor rate. On September 19, the pound was ejected permanently from the exchange rate mechanism (ERM), followed by the Italian lira. In the aftermath, the currencies of Sweden, France, Spain and Portugal came under attack. The crisis ended with the adoption of an exchange rate mechanism very similar to a system of floating exchange rates, with the authorized fluctuation bands broadened to 15% (Bordo and Schwartz, 1996).
Mexico 1994
The crisis began on December 20, 1994 when Mexico decided to widen the peso's fluctuation band against the dollar. The end is generally dated to March 10, 1995 and the announcement of an austerity plan (Bordo and Schwartz, 1996; Whitt 1996). However, Candelon et al. (2005) say the crisis ended on December 31, 1994.
According to the IMF, Chakrabarti and Roll (2002), and Dungey et al. (2004, 2006), the crisis began on July 2, 1997 when Thailand decided to allow the baht to float after it had come under attack on May 14 and 15. The Philippines, Hong Kong, South Korea, Malaysia, Indonesia and Singapore were caught in the downdraft. According to Kaminsky and Schmukler (1999), the end of the crisis can be dated to January 13, 1998, when investors were reassured by the announcement of government reforms in Indonesia and a merger between two Singapore banks, as well as by upbeat comments from Morgan Stanley strategists about the "end of the Asian bear market". Candelon et
al. (2005) examined the Hong Kong crisis, which they situate in the period from
October 17 to 31, 1997, while Caporale et al. (2005) deal with the entire Asian crisis. Lastly, Ball and Torous (2006) consider three possible durations for the crisis period: 1 year, 2 years and 3 years.
Brazil 1999
Dungey et al. (2006) say that the crisis began on January 13, 1999 with the devaluation of the real. It is hard to establish an end date because no landmark events occurred. However, the crisis is generally referred to as the "January 1999 Brazilian crisis". We have therefore taken the final date to be the end of January 1999.
Sovereign debt crises
Russia 1998
The Russian crisis began on August 17, 1998, when the country defaulted on its debt, and continued until September of that year, when another crisis was triggered by the
collapse of the hedge fund LTCM. We have therefore considered these two crises jointly, setting the end date for both at the end of the LTCM crisis.
Argentina 2001
The crisis began on November 1, 2001 when Argentina announced a debt restructuring plan. On December 5, the IMF refused to release funds to help the country, and the Argentine president was forced to resign on December 20. On December 23, 2001 the country announced that it was in default. For investors, the announcement marked the end of the crisis, and emerging spreads began to narrow (BIS, 2002).
Crashes
1987 equity crash
The steep drop in prices that occurred on October 19, 1987 lasted just one day, but it took several months to return to pre-crash levels. It is therefore difficult to set a precise end date. We have assumed that the crisis lasted until December 7, 1987, the day that prices troughed but before the market began to rally.
1994 bond crisis
On February 4, 1994 the US Federal Reserve announced it was increasing its policy rate, taking the bond market by surprise (BIS, 1995). The announcement triggered a wave of panic and resulted in a massive bond sell-off in all industrial countries. We have dated the end of the crisis to November 3, 1994 when the steep rise in long-term interest rates came to an end (by which time, 10-yr yields in the USA had reached 8%).
2000 E-crash
Triggered by the crash in tech stocks, the equity meltdown began on March 28, 2000. We have dated the end of the crisis to April 14, 2000 when prices stopped falling. Thereafter, the market entered a period of stagnation.
Corporate bankruptcies and crises of confidence
LTCM 1998
The hedge fund Long Term Capital Management (LCTM) collapsed on September 23, 1998. Dungey et al. (2004) consider that the crisis ended when the US Federal Reserve decided to cut interest rates in order to contain the fallout. The Fed's decision was taken unexpectedly between two FOMC meetings on October 15, 1998.
Enron 2001
The onset of the crisis can be dated to November 28, 2001 when Moody's Investor Services decided to downgrade Enron, taking it from investment grade to high yield. Although it was Moody's decision that sparked the mood of wariness which spread to all financial markets, signs that Enron was in trouble had emerged much earlier. On October 16, 2001 the company lowered its earnings guidance (BIS, 2002), and on November 8 it announced a retroactive adjustment to all its results since 1997. Enron filed for bankruptcy on December 2. It is extremely difficult to set a precise end date, and we consider that the crisis lasted throughout December.
WorldCom 2002
The crisis related to the bankruptcy of WorldCom began on June 25, 2002 when the company revealed accounting inaccuracies concealing losses of $3.8 billion in 2001 and 2002; it also announced 17,000 job cuts, equivalent to 20% of the workforce. WorldCom filed for bankruptcy on July 11, and its shares fell 80% over the next four months. Once again it is very hard to establish an end date because the loss of confidence was exacerbated by fears relating to terrorist attacks in May and June 2002 and to political tensions between India and Pakistan. According to the BIS (2002a), the most significant crisis-related market movements occurred between July 10 and 23. We therefore consider that the crisis lasted until end-July 2002.
Subprime 2007
The subprime crisis started on February 8, 2007 when HSBC announced the extra provisioning of funds to cover non-performing loans on subprime portfolios (BIS, 2007). The announcement was followed by the failure of a number of subprime lenders. The spreads on this market segment widened to 200 bp in two days. But since March 13, 2007 credit spreads have contracted again, signaling a decrease in market fears. This date has been taken as the end of the first episode of the subprime crisis, until June 2007, where our data sample ends.
Other crisis of confidence
9/11
The terrorist attacks on the USA on September 11, 2001 sparked a crisis of confidence across markets worldwide. It is hard to say precisely when the crisis ended, but we have considered that it lasted for the whole of September.
References
Adam, M.C. and A. Szafarz 1993, Speculative bubbles and financial markets, Oxford
Economic Papers, 44, 626-640.
Alexander, G.J., A.K. Edwards, and M.G. Ferri 2000, What does Nasdaq's high-yield bond market reveal About bondholder-stockholder conflicts?, Financial Management, 29, 1, 23-39.
Annaert, J., A.G.P. Claes, and M.J.K. De Ceuster 2006, Intertemporal stability of the European credit spread co-movement structure, European Journal of Finance, 12, 1, 23-32.
Ball C.A. and W.N. Torous 2006, Contagion in the presence of stochastic interdependence, Available at SSRN: http://ssrn.com/abstract=930640.
Baur, D. and B.M. Lucey 2006, Flight-to-quality or contagion? An empirical analysis of stock-bond correlations, IIIS Discussion Paper No. 122 Trinity College, Dublin.
Bekaert, G., C.R. Harvey, and A. Ng 2005, Market integration and contagion, Journal
of Business, 78, 39-69.
Berben, R.-P and W.J. Jansen 2005, Comovement in international equity markets: A sectoral view, Journal of International Money and Finance, 24, 832-857.
BIS 1995, Bond market turbulence, 65th Annual Report, chap. 5, 104-130.
BIS 2002, Quarterly Review, March.
BIS 2002a, Quarterly Review, September.
BIS 2007, Financial Markets, 77th Annual report, chap. 6, 98-118.
Bordo, M.D., and A.J. Schwartz 1996, Why clashes between internal and external stability goals end in currency crises, 1797-1994, Open Economies Review, 7, 437- 468.
Boyer, B.H., M.S. Gibson, and M. Loretan 1999, Pitfalls in tests for changes in correlations, Board of Governors of the Federal Reserve System, International Finance Discussion Paper N°597.
Browne, M.W. and A. Shapiro 1986, The asymptotic covariance matrix of sample correlation coefficients under general conditions, Linear Algebra and Its Applications, 82, 169-176.
Candelon B., A. Hecq, and W.F.C. Verschoor 2005, Measuring common cyclical features during financial turmoil: Evidence of interdependence not contagion, Journal
of International Money and Finance, 24, 8, 1317-1334.
Calvo G.A. and E.G. Mendoza 2000, Rational contagion and the globalization of securities markets, Journal of International Economics, 51, 1, 79-113.
Campbell R.A.J., C.S. Forbes, K.G. Koedijk, and P. Kofman 2008, Increasing correlations or just fat tails?, Journal of Empirical Finance, 15, 2, 287-309.
Caporale, G.M., A. Cipollini and N. Spagnolo 2005, Testing for contagion: A conditional correlation analysis, Journal of Empirical Finance, 12, 476-489.
Chakrabarti, R. and R. Roll 2002, East Asia and Europe during the 1997 Asian collapse: A clinical study of a financial crisis, Journal of Financial Markets, 5, 1-30.
Chesnay, F. and E. Jondeau 2001, Does correlation between stock returns really increase during turbulent periods?, Economic Notes, 30, 1, 53-80.
Connolly R., C. Stivers, and L. Sun 2005, Stock market uncertainty and the stock-bond return relation, Journal of Financial and Quantitative Analysis, 40, 1, 161-194.
Corsetti, G., M. Pericoli, and M. Sbracia 2005, Some contagion, some interdependence: More pitfalls in tests of financial contagion, Journal of International Money and
Finance, 24, 8, 1177-1199
Cowitt, P. P., Ed. 1984, World Currency Yearbook, Currency Data and Intelligence, Inc., Brooklyn, New York.
De Gregorio J. 1999, Exchange rate policy in Chile since 1960: Political economy and the choice of regime, Inter American Development Bank Working Paper N°377.
De Santis, G. and B. Gérard 1997, International asset pricing and portfolio diversification with time-varying risk, Journal of Finance, 52, 1881-1912.
Dungey M., R. Fry, and V.L. Martin 2004, Currency market contagion in the Asia-Pacific Region, Australian Economic Papers, 43, 4, 379-395.
Dungey R., R. Fry, B. Gonzalez-Hermosillo, and M. Vance 2006, Contagion in international bond markets during the Russian and the LTCM crises, Journal of
Financial Stability, 2, 1, 1-27.
Eichengreen, B., G. Hale, and A. Mody 2001, Flight-to-quality: Investor Risk Tolerance and the Spread of Emerging Market Crises, in S. Claessens and K.J. Forbes (Eds.),
International Financial Contagion, Kluwer Academic Publishers, MA, 129-155.
Fama, E.F. and K.R. French 1993, Common risk factors in the returns on stocks and bonds, Journal of Financial Economics, 33, 3-56.
Flavin, T. and E. Panopoulou, E. 2008, On the robustness of international portfolio diversification benefits to regime-switching volatility" Journal of International Money
Forbes and Rigobon 2002, No contagion, only interdependence: Measuring stock market co-movements, Journal of Finance, 57, 2223–2261.
Goetzmann, W.N., L. Li and K.G. Rouwenhorst 2005, Long-term global market correlations, Journal of Business, 78, 1, 1-38.
Gulko, L. 2002, Decoupling, Journal of Portfolio Management, 28, 3, 59-67.
Hartmann, P. S. Straetmans and C.G. de Vries 2004, Asset market linkages in crisis periods, The Review of Economics and Statistics, 86, 1, 313-326
Hunter, D.M.and D.P. Simon 2004, Benefits of international bond diversification,
Journal of Fixed Income, 13, 57-72.
Jennrich, R.I. 1970, An asymptotic chi-square test for the equality of two correlation matrices, Journal of the American Statistical Association, 65, 330, 904-912.
Kaplanis, E.C. 1988, Stability and forecasting of the comovement measures of international stock market returns, Journal of International Money and Finance, 7, 1, 63-75.
Kaminsky G.L. and S.L. Schmulker 1999, What Triggers Market Jitters? A Chronicle of the Asian crisis, Journal of International Money and Finance, 18, 537-560.
Kim J. and C.C. Finger 2000, A stress test to incorporate correlation breakdown,
Journal of Risk, 2, 3.
Lin, W.L., R.F. Engle, and T. Ito 1994, Do bulls and bears move across borders? International transmission of stock returns and volatility, Review of Financial Studies, 7, 507-538.
Longin F. and B. Solnik (1995), Is the Correlation in International Equity Returns Constant: 1960-1990 ?, Journal of International Money and Finance, 14, 1, 3-26.
Longin F. and B. Solnik 2001, Extreme correlation of international equity markets,
Journal of Finance, 56, 2, 649-675.
Neudecker, H., and A.M. Wesselman 1990, The asymptotic variance matrix of the sample correlation matrix, Linear Algebra and Its Applications, 127, 589-599.
Ragea V. 2003, Testing correlation stability during hectic financial markets, Financial
Markets and Portfolio Management, 17, 3, 289-308.
Salge, M. 1997, Rational Bubbles, Springer-Verlag, Berlin.
Silvapulle, P., and C.W.J. Granger 2001, Large returns, conditional correlation and portfolio diversification: A Value-at-Risk approach, Quantitative Finance, 1, 1-10.
Smith K.L. 2002, Government bond market seasonality, diversification and cointegration: International evidence, Journal of Financial Research, 25, 2, 203-221.
Sornette, D. and Y. Malevergne 2001, From rational bubbles to crashes, Physica A, 299, 40-59.
Wälti, S. (2003), Testing for contagion in international financial markets: Which way to go?, FAME Working Paper No. 92.
Whitt, J.A. Jr, 1996, The Mexican peso crisis, Economic Review, Federal Reserve Bank of Atlanta, 81, 1-20.
Table I. Descriptive statistics for the indices under study Weekly returns hedged in dollars
USA Eurozone* UK Japan
Government bond indices (July 1998 – May 2007)
Mean 0.09% 0.10% 0.09% 0.09% Annualized mean 4.88% 5.52% 4.62% 4.82% Median 0.10% 0.16% 0.08% 0.12% Min -4.25% -3.11% -3.66% -3.93% Max 2.45% 2.04% 2.86% 3.24% Standard deviation 1.00% 0.73% 0.78% 0.65% Skewness -0.53 -0.52 -0.12 -0.54 Kurtosis 3.90 4.09 4.43 8.90 Jarque-Bera (proba) 36.90 (0.00) 43.61 (0.00) 40.33 (0.00) 693.44 (0.00)
IG corporate bond indices, (July 1998 – May 2007)
Mean 0.12% 0.12% 0.11% 0.10% Annualized mean 6.48% 6.55% 5.96% 5.36% Median 0.14% 0.17% 0.11% 0.13% Min -3.27% -3.12% -2.47% -3.56% Max 2.15% 1.72% 2.07% 2.30% Standard deviation 0.81% 0.58% 0.62% 0.58% Skewness -0.46 -0.64 -0.18 -0.54 Kurtosis 3.85 4.95 3.62 7.89 Jarque-Bera (proba) 30.22 (0.00) 105.07 (0.00) 9.77 (0.01) 485.11 (0.00)
HY corporate bond indices (July 1998 – May 2007)
Mean 0.11% 0.08% 0.13% - Annualized mean 6.10% 4.56% 6.83% - Median 0.19% 0.17% 0.22% - Min -5.47% -8.38% -8.57% - Max 2.68% 5.57% 5.61% - Standard deviation 0.76% 1.39% 1.21% - Skewness -1.34 -1.03 -1.67 - Kurtosis 11.30 10.00 15.35 Jarque-Bera (proba) 1484.69 (0.00) 1038.80 (0.00) 3188.39 (0.00) -
Equity indices (July 1998 – May 2007)
Mean 0.13% 0.12% 0.11% 0.17% Annualized mean 6.86% 6.38% 5.66% 9.18% Median 0.24% 0.30% 0.26% 0.31% Min -13.40% -11.62% -8.02% -7.23% Max 9.36% 11.86% 10.02% 7.89% Standard deviation 2.45% 2.84% 2.11% 2.58% Skewness -0.45 -0.18 -0.23 -0.13 Kurtosis 6.45 4.81 4.96 2.85 Jarque-Bera (proba) 245.25 (0.00) 65.67 (0.00) 78.19 (0.00) 1.75 (0.00)
* Germany for equity and government bond indices.
Table II. Correlation matrix for all asset classes, Weekly returns hedged in dollars, July 1998 – May 2007
US_GVT EU_GVT UK_GVT JP_GVT US_IG EU_IG UK_IG JP_IG US_HY EU_HY UK_HY US_EQ EU_EQ UK_EQ JP_EQ
US_GVT 100.0% 46.4% 51.0% 7.6% 95.3% 51.8% 47.7% 8.6% 9.1% -7.8% -4.7% -20.2% -24.8% -20.1% -6.3% EU_GVT 46.4% 100.0% 67.3% 13.2% 44.1% 81.6% 67.1% 15.7% 2.0% -4.4% -0.5% -9.1% -22.5% -21.9% -11.4% UK_GVT 51.0% 67.3% 100.0% 9.4% 48.8% 79.1% 89.7% 11.1% 4.0% -6.3% -1.8% -9.8% -24.1% -21.5% -10.1% JP_GVT 7.6% 13.2% 9.4% 100.0% 7.4% 12.5% 10.1% 79.6% -2.8% -3.0% -1.9% -6.1% -8.6% -6.4% -20.6% US_IG 95.3% 44.1% 48.8% 7.4% 100.0% 51.8% 47.4% 8.0% 22.3% 0.5% 3.0% -15.8% -18.6% -14.8% -3.3% EU_IG 51.8% 81.6% 79.1% 12.5% 51.8% 100.0% 79.5% 13.4% 14.9% 1.6% 5.6% -5.6% -18.7% -17.5% -9.0% UK_IG 47.7% 67.1% 89.7% 10.1% 47.4% 79.5% 100.0% 12.8% 11.0% 0.0% 4.2% -8.7% -21.6% -19.3% -10.3% JP_IG 8.6% 15.7% 11.1% 79.6% 8.0% 13.4% 12.8% 100.0% -2.6% -3.9% -3.6% -5.8% -9.5% -8.3% -21.6% US_HY 9.1% 2.0% 4.0% -2.8% 22.3% 14.9% 11.0% -2.6% 100.0% 54.8% 47.2% 13.8% 24.7% 24.0% 17.0% EU_HY -7.8% -4.4% -6.3% -3.0% 0.5% 1.6% 0.0% -3.9% 54.8% 100.0% 71.9% 11.5% 25.3% 26.1% 15.6% UK_HY -4.7% -0.5% -1.8% -1.9% 3.0% 5.6% 4.2% -3.6% 47.2% 71.9% 100.0% 7.3% 16.1% 16.7% 12.9% US_EQ -20.2% -9.1% -9.8% -6.1% -15.8% -5.6% -8.7% -5.8% 13.8% 11.5% 7.3% 100.0% 52.8% 43.2% 11.4% EU_EQ -24.8% -22.5% -24.1% -8.6% -18.6% -18.7% -21.6% -9.5% 24.7% 25.3% 16.1% 52.8% 100.0% 77.4% 23.2% UK_EQ -20.1% -21.9% -21.5% -6.4% -14.8% -17.5% -19.3% -8.3% 24.0% 26.1% 16.7% 43.2% 77.4% 100.0% 26.1% JP_EQ -6.3% -11.4% -10.1% -20.6% -3.3% -9.0% -10.3% -21.6% 17.0% 15.6% 12.9% 11.4% 23.2% 26.1% 100.0%
Table III. Results of the GLR (2005) globalization test
Asset Classes Test periods Test Stat
All asset classes (15*15 matrix) 1998-2002 & 2002-2007 148.07***
GVT bonds (4*4 matrix) 1984-1995 & 1995-2007 89.6***
IG bonds (4*4 matrix) 1998-2002 & 2002-2007 10.69*
HY bonds (3*3 matrix) 1998-2002 & 2002-2007 1.91
EQ (4*4 matrix) 1974-1992 & 1992-2007 78.84***
Table IV. Correlation differences Δρij =ρij(2003 to 2007)−ρij(1998 to 2003)
Weekly returns hedged in dollars
US_GVT EU_GVT UK_GVT JP_GVT US_IG EU_IG UK_IG JP_IG US_HY EU_HY UK_HY US_EQ EU_EQ UK_EQ JP_EQ
US_GVT 0.0% 21.5% 6.7% 1.8% 5.5% 8.3% 10.3% 1.3% 19.2% 8.3% 4.8% 6.9% -2.3% -0.8% 2.6% EU_GVT 21.5% 0.0% 30.5% 4.6% 22.8% 20.6% 25.8% 1.9% 20.0% 7.2% 4.5% -8.3% -9.5% -5.1% -1.5% UK_GVT 6.7% 30.5% 0.0% 9.7% 8.3% 5.7% 9.2% 7.8% 12.2% 6.8% 5.2% -9.5% -7.7% -4.0% -2.1% JP_GVT 1.8% 4.6% 9.7% 0.0% 0.0% 8.8% 10.8% 30.9% -0.6% -2.8% -3.4% -1.7% -6.2% -7.3% -28.8% US_IG 5.5% 22.8% 8.3% 0.0% 0.0% 8.2% 10.5% -0.3% 12.8% 6.3% 1.8% 4.9% -5.4% -2.8% 1.2% EU_IG 8.3% 20.6% 5.7% 8.8% 8.2% 0.0% 9.4% 9.5% 15.7% 10.0% 6.2% -8.1% -9.7% -5.3% -0.9% UK_IG 10.3% 25.8% 9.2% 10.8% 10.5% 9.4% 0.0% 7.7% 12.1% 6.1% 5.0% -6.5% -8.3% -4.6% -1.3% JP_IG 1.3% 1.9% 7.8% 30.9% -0.3% 9.5% 7.7% 0.0% -2.1% -2.8% -1.5% -2.3% -5.0% -4.7% -29.7% US_HY 19.2% 20.0% 12.2% -0.6% 12.8% 15.7% 12.1% -2.1% 0.0% 3.0% 3.6% 7.5% -1.9% -0.8% 4.1% EU_HY 8.3% 7.2% 6.8% -2.8% 6.3% 10.0% 6.1% -2.8% 3.0% 0.0% -4.2% 2.1% -6.5% -8.3% 4.4% UK_HY 4.8% 4.5% 5.2% -3.4% 1.8% 6.2% 5.0% -1.5% 3.6% -4.2% 0.0% 3.4% 0.7% -0.5% 6.2% US_EQ 6.9% -8.3% -9.5% -1.7% 4.9% -8.1% -6.5% -2.3% 7.5% 2.1% 3.4% 0.0% 13.3% 4.7% -2.0% EU_EQ -2.3% -9.5% -7.7% -6.2% -5.4% -9.7% -8.3% -5.0% -1.9% -6.5% 0.7% 13.3% 0.0% 0.4% 0.9% UK_EQ -0.8% -5.1% -4.0% -7.3% -2.8% -5.3% -4.6% -4.7% -0.8% -8.3% -0.5% 4.7% 0.4% 0.0% 1.2% JP_EQ 2.6% -1.5% -2.1% -28.8% 1.2% -0.9% -1.3% -29.7% 4.1% 4.4% 6.2% -2.0% 0.9% 1.2% 0.0%
Table V. Crises used in this study
Start date End date Type of crisis
Chile 1982 15/06/1982 05/08/1982 Currency
Mexico 1982 17/02/1982 01/09/1982 Currency
Equity crash 1987 19/10/1987 07/12/1987 Market crash
EMS crisis 1992 16/09/1992 01/08/1993 Currency
Bond crash 1994 04/02/1994 03/11/1994 Market crash
Mexico 1994 20/12/1994 10/03/1995 Currency
Asia 1997 02/07/1997 13/01/1998 Currency
Russia and LTCM 1998 17/08/1998 15/10/1998 Sovereign debt and corporate bankruptcy
Brazil 1999 13/01/1999 31/01/1999 Currency
e-crash 2000 28/03/2000 14/04/2000 Market crash
Argentina 2001 01/10/2001 23/12/2001 Sovereign debt
9/11 11/09/2001 28/09/2001 Confidence
Enron 2001 28/11/2001 31/12/2001 Corporate bankruptcy
WorldCom 2002 25/06/2002 31/07/2002 Corporate bankruptcy
Table VI. Results of the GLR (2005) contagion test (all crises)
Asset Classes Overall period Test Stat overall period Period adjusted Test Stat period adjusted Global correlation matrix
All asset classes (15*15 matrix) 1998-2007 117.99 - -
GVT bonds (4*4 matrix) 1984-2007 0.79 - - IG bonds (4*4 matrix) 1998-2007 4.46 - - HY bonds (3*3 matrix) 1998-2007 1.22 - - EQ (4*4 matrix) 1978-2007 14.29** 1998-2005 10.26 Cross-correlations only GVT and IG (8*8 matrix) 1998-2007 34.08*** 1998-2005 32.47*** GVT and HY (6*6 matrix) 1998-2007 4.71 - - GVT and EQ (8*8 matrix) 1984-2007 26.35** 1984-2005 27.32** IG and HY (6*6 matrix) 1998-2007 6.12 - - IG and EQ (8*8 matrix) 1998-2007 6.19 - - HY and EQ (6*6 matrix) 1998-2007 12.42 - -
Table VII. Correlation differencesΔ =ρij ρij(crisis)−ρij(no crisis),
Weekly returns hedged in dollars, July 1998 – May 2007
US_IG EU_IG UK_IG JP_IG US_EQ EU_EQ UK_EQ JP_EQ US_GVT -8.8% 4.8% 4.4% 15.7% -6.4% -3.4% -5.3% -1.6% EU_GVT 9.2% 5.2% 6.5% 5.5% 0.8% -19.3% -20.3% -3.5%
UK_GVT 3.6% -1.6% -2.4% 18.6% -15.8% -20.1% -23.3% -4.9%
Figure 1. Crises used in this study 0 1 2 02/01/ 1978 02/01/ 1980 02/01/ 1982 02/01/ 1984 02/01/ 1986 02/01/ 1988 02/01/ 1990 02/01/ 1992 02/01/ 1994 02/01/ 1996 02/01/ 1998 02/01/ 2000 02/01/ 2002 02/01/ 2004 02/01/ 2006
i
with the exceptions of Annaert et al. (2006), Hunter and Simon (2004) and Smith (2002)
ii
Where the vecR ii
(
=1, 2)
vectors include only relevant elements, i.e. those in the upper off-diagonal part,since the Ri’s are correlation matrices.
iii
Following Kim and Finger (2000), Ragea (2003) suggests broadening the range of possible distributions during crises and normal periods, using a mixture of normal distributions. In this setting, the paired returns of different assets are drawn at random from multivariate Gaussian distributions corresponding either to a "quiet" period or a "hectic" period. Unfortunately, the author confines his study to a bivariate case where the stability of one correlation coefficient is tested. Another possibility is to work from variance-covariance matrices rather than from correlation matrices. This would mean adding the problem of correlation stability to the wider problem of all second-order parameters. However, as Kaplanis (1988) and d'Addona and Kind (2006) have noted, this entails a massive rejection owing to the considerable variability of variances.
iv
For Eurozone, we use the German bond index. v
The indices have minor differences. For IG indices, we selected a maturity of 7 to 10 years. However, for HY indices, maturity was not proposed as a selection parameter, so there are small differences in durations.
vi
In fact, the literature focuses mainly on the increasing correlations between equity markets. To our knowledge, the expected impact of globalization on inter-class correlations has not been addressed.
vii
The reference to earlier paper does not fully protect our results from endogeneity biases, as the way other authors have dealt with this issue might well have consequences on our results. Nevertheless, as far as volatility tests are concerned, no full protection against endogeneity does exist currently. Moreover, endogeneity pushes toward the acceptance of contagion (if crises are determined on the basis of high correlations, then the test statistic which measures the difference between quite-time and crisis correlation matrices will tend to be biased upwards). Therefore, the fact that this paper ends up rejecting contagion testifies against the presence of any significant endogeneity bias.
viii
DULBEA Working Paper Series
2008N°.08-22.RS Marie Brière, Ariane Chapelle and Ariane Szafarz « No contagion, only globalization and flight to quality», November 2008.
N°.08-21.RS Leila Maron and Danièle Meulders « Les effets de la parenté sur l’emploi », November 2008.
N°.08-20.RS Ilan Tojerow « Industry Wage Differential, Rent Sharing and Gender in Belgium », October 2008.
N°.08-19.RS Pierre-Guillaume Méon and Ariane Szafarz « Labor market discrimination as an agency cost », October 2008.
N°.08-18.RS Luigi Aldieri « Technological and geographical proximity effects on knowledge spillovers: evidence from us patent citations », September 2008. N°.08-17.RS François Rycx, Ilan Tojerow and Daphné Valsamis « Wage differentials across
sectors in Europe: an east-west comparison », August 2008.
N°.08-16.RS Michael Rusinek and François Rycx « Quelle est l’influence des négociations d’entreprise sur la structure des salaires ? », July 2008.
N°.08-15.RS Jean-Luc De Meulemeester « Vers une convergence des modèles ? Une réflexion à la lumière des expériences européennes de réforme des systèmes d’enseignement supérieur », July 2008.
N°.08-14.RS Etienne Farvaque and Gaël Lagadec « Les promesses sont-elles des dettes ? Economie Politique des promesses électorales », June 2008.
N°.08-13.RS Benoît Mahy, François Rycx and Mélanie Volral « L’influence de la dispersion salariale sur la performance des grandes entreprises belges », May 2008.
N°.08-12.RS Olivier Debande and Jean-Luc Demeulemeester « Quality and variety competition in higher education », May 2008.
N°.08-11.RS Robert Plasman, Michael Rusinek and Ilan Tojerow « Les différences régionales de productivité se reflètent-elles dans la formation des salaires ? » April 2008.
N°.08-10.RS Hassan Ayoub, Jérôme Creel and Etienne Farvaque « Détermination du niveau des prix et finances publiques : le cas du Liban 1965-2005 », March 2008. N°.08-09.RS Michael Rusinek and François Rycx « Rent-sharing under Different Bargaining
N°.08-07.RS Abdeslam Marfouk « The African Brain Drain: Scope and Determinants », March 2008.
N°.08-06.RS Sîle O’Dorchai « Pay inequality in 25 European countries », March 2008. N°.08-05.RS Leila Maron and Danièle Meulders « Having a child: A penalty or bonus for
mother’s and father’s employment in Europe? », February 2008.
N° 08-04.RR Robert Plasman, Michael Rusinek, François Rycx, Ilan Tojerow « Loonstructuur in België », January 2008.
N° 08-03.RS Caroline Gerschlager « Foolishness and Identity: Amartya Sen and Adam Smith », January 2008.
N° 08-02.RS Michele Cincera « Déterminants des oppositions de brevets: une analyse micro-économique au niveau belge », January 2008.
N° 08-01.RR Robert Plasman, Michael Rusinek, François Rycx, Ilan Tojerow « La structure des salaires en Belgique », January 2008.
2007
N° 07-22.RS Axel Dreher, Pierre-Guillaume Méon and Friedrich Schneider « The devil is in the shadow Do institutions affect income and productivity or only official income and official productivity », November 2007.
N° 07-21.RS Ariane Szafarz « Hiring People-like-Yourself: A Representation of Discrimination on the Job Market », November 2007.
N° 07-20.RS Amynah Gangji and Robert Plasman « Microeconomic analysis of unemployment in Belgium », October 2007.
N° 07-19.RS Amynah Gangji and Robert Plasman « The Matthew effect of unemployment: how does it affect wages in Belgium », October 2007.
N° 07-18.RS Pierre-Guillaume Méon, Friedrich Schneider and Laurent Weill « Does taking the shadow economy into account matter to measure aggregate efficiency», October 2007.
N° 07-17.RS Henri Capron and Michele Cincera « EU Pre-competitive and Near-the-market S&T Collaborations », October 2007.
N° 07-16.RS Henri Capron « Politique de cohésion et développement régional », October 2007.
N° 07-15.RS Jean-Luc De Meulemeester « L’Economie de l’Education fait-elle des Progrès ? Une Perspective d’Histoire de la Pensée Economique », October
N° 07-14.RS Jérôme de Henau, Leila Maron, Danièle Meulders and Sîle O’Dorchai « Travail et Maternité en Europe, Conditions de Travail et Politiques Publiques », October 2007.
N° 07-13.RS Pierre-Guillaume Méon and Khalid Sekkat «Revisiting the Relationship between Governance and Foreign Direct Investment», October 2007.
N° 07-12.RS Robert Plamsan, François Rycx and Ilan Tojerow « Wage Differentials in Belgium : The Role of Worker and Employer Characteristics », October 2007. N° 07-11.RS Etienne Farvaque, Norimichi Matsueda and Pierre-Guillaume Méon« How
committees reduce the volatility of policy rates », July 2007.
N° 07-10.RS Caroline Gerschlager «Adam Smith’s Account of Self-Deceit and Informal Institutions », May 2007.
N° 07-09.RS Marie Pfiffelmann « Which optimal design for lottery linked deposit », May 2007.
N° 07-08.RS Marc Lévy « Control in Pyramidal Structures », May 2007.
N° 07-07.RS Olga Bourachnikova «Weighting Function in the Behavioral Portfolio Theory»,
May 2007.
N° 07-06.RS Régis Blazy and Laurent Weill « The Impact of Legal Sanctions on Moral Hazard when Debt Contracts are Renegotiable », May 2007.
N° 07-05.RS Janine Leschke «Are unemployment insurance systems in Europe adapting to new risks arising from non-standard employment? », March 2007.
N° 07-04.RS Robert Plasman, Michael Rusinek, Ilan Tojerow « La régionalisation de la négociation salariale en Belgique : vraie nécessité ou faux débat ? », March 2007.
N° 07-03.RS Oscar Bernal and Jean-Yves Gnabo « Talks, financial operations or both? Generalizing central banks’ FX reaction functions », February 2007.
N° 07-02.RS Sîle O’Dorchai, Robert Plasman and François Rycx « The part-time wage penalty in European countries: How large is it for men? », January 2007.
N° 07-01.RS Guido Citoni « Are Bruxellois and Walloons more optimistic about their health? », January 2007.
N° 06-14.RS Robert Plasman, François Rycx, Ilan Tojerow « Industry wage differentials, unobserved ability, and rent-sharing: Evidence from matched worker-firm data, 1995-2002»
N° 06-13.RS Laurent Weill, Pierre-Guillaume Méon « Does financial intermediation matter for macroeconomic efficiency? », October 2006.
N° 06-12.RS Anne-France Delannay, Pierre-Guillaume Méon « The impact of European integration on the nineties’ wave of mergers and acquisitions », July 2006. N° 06-11.RS Michele Cincera, Lydia Greunz, Jean-Luc Guyot, Olivier Lohest « Capital
humain et processus de création d’entreprise : le cas des primo-créateurs wallons », June 2006.
N° 06-10.RS Luigi Aldieri and Michele Cincera « Geographic and technological R&D spillovers within the triad: micro evidence from us patents », May 2006.
N° 06-09.RS Verena Bikar, Henri Capron, Michele Cincera « An integrated evaluation scheme of innovation systems from an institutional perspective », May 2006. N° 06-08.RR Didier Baudewyns, Benoît Bayenet, Robert Plasman, Catherine Van Den
Steen, « Impact de la fiscalité et des dépenses communales sur la localisation intramétropolitaine des entreprises et des ménages: Bruxelles et sa périphérie», May 2006.
N° 06-07.RS Michel Beine, Pierre-Yves Preumont, Ariane Szafarz « Sector diversification during crises: A European perspective », May 2006.
N° 06-06.RS Pierre-Guillaume Méon, Khalid Sekkat « Institutional quality and trade: which institutions? which trade? », April 2006.
N° 06-05.RS Pierre-Guillaume Méon « Majority voting with stochastic preferences: The whims of a committee are smaller than the whims of its members », April 2006.
N° 06-04.RR Didier Baudewyns, Amynah Gangji, Robert Plasman « Analyse exploratoire d’un programme d’allocations-loyers en Région de Bruxelles-Capitale: comparaison nternationale et évaluation budgétaire et économique selon trois scénarios », April 2006.
N° 06-03.RS Oscar Bernal « Do interactions between political authorities and central banks influence FX interventions? Evidence from Japan », April 2006.
N° 06-02.RS Jerôme De Henau, Danièle Meulders, and Sile O’Dorchai « The comparative effectiveness of public policies to fight motherhood-induced employment
N° 06-01.RS Robert Plasman, Michael Rusinek, and François Rycx « Wages and the Bargaining Regime under Multi-level Bargaining : Belgium, Denmark and Spain », January 2006.
2005
N° 05-20.RS Emanuele Ciriolo « Inequity aversion and trustees’ reciprocity in the trust game », May 2006.
N° 05-19.RS Thierry Lallemand, Robert Plasman, and François Rycx « Women and Competition in Elimination Tournaments: Evidence from Professional Tennis Data », November 2005.
N° 05-18.RS Thierry Lallemand and François Rycx « Establishment size and the dispersion of wages: evidence from European countries », September 2005.
N° 05-17.RS Maria Jepsen, Sile O’Dorchai, Robert Plasman, and François Rycx « The wage penalty induced by part-time work: the case of Belgium », September 2005. N° 05-16.RS Giuseppe Diana and Pierre-Guillaume Méon « Monetary policy in the presence
of asymmetric wage indexation », September 2005.
N° 05-15.RS Didier Baudewyns « Structure économique et croissance locale : étude économétrique des arrondissements belges, 1991-1997 », July 2005.
N° 05-14.RS Thierry Lallemand, Robert Plasman, and François Rycx « Wage structure and firm productivity in Belgium », May 2005.
N° 05-12.RS Robert Plasman and Salimata Sissoko « Comparing apples with oranges: revisiting the gender wage gap in an international perspective », April 2005. N° 05-11.RR Michele Cincera « L’importance et l’étendue des barrières légales et
administratives dans le cadre de la directive ‘Bolkestein’ : Une étude comparative entre la Belgique et ses principaux partenaires commerciaux », April 2005.
N° 05-10.RS Michele Cincera « The link between firms’ R&D by type of activity and source of funding and the decision to patent », April 2005.
N° 05-09.RS Michel Beine and Oscar Bernal « Why do central banks intervene secretly? Preliminary evidence from the Bank of Japan », April 2005.
N° 05-08.RS Pierre-Guillaume Méon and Laurent Weill « Can Mergers in Europe Help Banks Hedge Against Macroeconomic Risk ? », February 2005.
Establishment-N° 05-06.RS Khalid Sekkat and Marie-Ange Veganzones-Varoudakis « Trade and Foreign Exchange Liberalization, Investment Climate and FDI in the MENA », February 2005.
N° 05-05.RS Ariane Chapelle and Ariane Szafarz « Controlling Firms Through the Majority Voting Rule », February 2005.
N° 05-04.RS Carlos Martinez-Mongay and Khalid Sekkat « The Tradeoff Between Efficiency and Macroeconomic Stabilization in Europe », February 2005.
N° 05-03.RS Thibault Biebuyck, Ariane Chapelle et Ariane Szafarz « Les leviers de contrôle des actionnaires majoritaires», February 2005.
N° 05-02.RS Pierre-Guillaume Méon « Voting and Turning Out for Monetary Integration: the Case of the French Referendum on the Maastricht Treaty », February 2005. N° 05-01.RS Brenda Gannon, Robert Plasman, Ilan Tojerow, and François Rycx «
Interindustry Wage Differentials and the Gender Wage Gap : Evidence from European Countries », February 2005.
Apart from its working papers series, DULBEA also publishes the Brussels Economic Review-Cahiers Economiques de Bruxelles.
Aims and scope
First published in 1958, Brussels Economic Review-Cahiers Economiques de Bruxelles is one of the oldest economic reviews in Belgium. Since the beginning, it publishes quarterly the Brussels statistical series. The aim of the Brussels Economic Review is to publish unsolicited manuscripts in all areas of applied economics. Contributions that place emphasis on the policy relevance of their substantive results, propose new data sources and research methods, or evaluate existing economic theory are particularly encouraged. Theoretical contributions are also welcomed but attention should be drawn on their implications for policy recommendations and/or empirical investigation. Regularly the review publishes special issues edited by guest editors.
Authors wishing to submit a paper to be considered for publication in the Brussels Economic
Review should send an e-mail to Michele Cincera: [email protected], with their manuscript as an attachment. An anonymous refereeing process is guaranteed.
Additional instructions for authors and subscription information may be found on the Brussels
Economic Review’s website at the following address:
Brussels Economic Review
University of Brussels DULBEA, CP140 Avenue F.D. Roosevelt, 50 B-1050 Brussels Belgium ISSN 0008-0195