Preference Heterogeneity in
Monetary Policy Committees
Alessandro Riboni and Francisco J. Ruge-Murcia
Revised: October 2007
Abstract
This short paper employs individual voting records of the Monetary Policy Com-mittee (MPC) of the Bank of England to study heterogeneity in policy preferences among committee members. The analysis is carried out using a simple generalization of the standard Neo Keynesian framework that allows members to di er in the weight they give to output compared with in ation stabilization and in their views regarding optimal in ation and natural output. Results indicate that, qualitatively, MPC mem-bers are fairly homogeneous in their policy preferences, but that there are systematic quantitative di erences in their policy reaction functions that are related to the nature of their membership and career background.
JEL Classi cation: E4, E5, D7
Key Words: Committees, reaction functions, Bank of England.
Both authors: Departement de sciences economiques, Universite de Montreal. Work on this research project was carried out while the second author was Visiting Scholar at the Dutch National Bank. The nancial support of the Social Sciences and Humanities Research Council of Canada is gratefully acknowl-edged. Correspondence: Francisco J. Ruge-Murcia, Departement de sciences economiques, Universite de Montreal, C.P. 6128, succursale Centre-ville, Montreal (Quebec) H3C 3J7, Canada.
1
Introduction
This short paper uses the individual voting records of the Monetary Policy Committee (MPC) of the Bank of England to study the extent and nature of preference heterogeneity among committee members. Understanding committees is important because many central banks use a committee structure to formulate policy. This is the case, for example, in 79 out of the 88 central banks in Fry et al. (2000). At the theoretical level, we use a simple generalization of the standard Neo Keynesian framework that allows members to di er in the relative weight they attach to output versus in ation stabilization and in their views regarding optimal in ation and natural output. Under the assumption of sincere voting, individual reaction functions are derived and estimated for each member and for the committee as a whole. The model implies that, given the economy parameters and private-sector expectations, committee members agree on their reaction to the expected output gap and demand shocks and disagree on their reaction to expected in ation and supply shocks. In addition, members will di er systematically in their preferred interest rate even if they share the same in ation target and estimate of the natural output rate.
A rst snapshot of the MPC voting records reveals that disagreement is frequent at the policy meetings of the Bank of England. In about two thirds of meetings between June 1997 and June 2006 decisions were not unanimous. Summary statistics like those computed, for example, by Gerlach-Kristen (2003) and Spencer (2006) are suggestive of heterogeneous pref-erences over policy. Both studies conclude that external members appear to have di erent voting patterns than internal ones, tend to dissent more frequently and, when they dissent, are more likely to vote for a lower interest rate. These results mirror the ones obtained by the literature on the Federal Open Market Committee (FOMC), which usually nds that Board members appear to prefer more expansionary policy than the Reserve Bank presi-dents (see Belden, 1989, Gildea 1990, Havrilesky and Schweitzer, 1990, and Havrilesky and Gildea, 1991). The aforementioned literature uses dissenting votes only and analyses di er-ences in the voting behavior of the two groups by comparing dissenting frequencies. Tootell (1991, 1999), whose approach is followed here, uses instead all votes and investigates hetero-geneity within the FOMC by comparing coe cients of individual policy reaction functions. Contrary to the previous literature, he nds no evidence of a systematic di erence in voting patters between Board members and Bank presidents. Individual reaction functions are also estimated by Chappell et al. (2005). The literature has also considered other factors that may have an e ect on FOMC voting behavior, such as career backgrounds (see, Havrilesky and Schweitzer, 1990, and Gildea, 1990) and regional a liations. For example, Meade and Sheets (2005) nd that regional unemployment rates have a statistically signi cant e ect on
the voting patterns of Bank presidents and Board members alike.
The main empirical results are the following. First, committee members behave in agree-ment with economic theory in the sense that i) they generally favor higher (lower) interest rates when in ation (unemployment) is expected to increase and ii) the overidenti cation restrictions of the model are not rejected by the data. Thus, in qualitative terms, MPC members are fairly homogeneous in their policy preferences. Second, the joint hypothesis that individual reaction function coe cients are equal to those of the committee is rejected by the data. Hence, in quantitative terms, there is heterogeneity in policy reaction func-tions. Third, this heterogeneity appears to be systematic in that individuals who favor a strong response to expected in ation or unemployment do so regardless of the forecasts horizon. Fourth, systematic heterogeneity appears to be related to the nature of the mem-bership (whether external or internal) and individual career background (whether academia, private sector or Bank of England). These two characteristics are not independent because most academics and individuals with private sector experience are external members. In general, we nd that external members reacts more strongly to unemployment than internal members, but that there is no clear pattern regarding their reaction to in ation.
The paper is organized as follows: Section 2 describes the model that motivates the empirical speci cation, Section 3 reports empirical results, and Section 4 concludes.
2
The Model
Consider a monetary policy committee composed of N members. Assume that members have heterogeneous policy preferences in the sense that they may attach di erent relative weights to output versus in ation stabilization and may have di erent views regarding the optimal in ation rate and the true natural output level. The payo of member n2 f1; 2; : : : ; Ng in each period is Un( t; xt) = (1=2)(( t n;t) 2 + n(xt xn;t) 2 ); (1)
where t is the in ation rate, xt is an output measure, n;t and xn;t are, respectively, the
optimal in ation rate and the natural level of xt according to member n; and n> 0 is the
relative weight that member n attaches to output stabilization. Normalizing the in ation weight to one entails no loss of generality. The special case where members agree on a (possibly time-varying) in ation target corresponds to n;t = t for all n. The di erence between member n's estimate of the natural rate and its true value is assumed to be well approximated by
where n;t is an exogenous autocorrelated disturbance with zero mean and constant
condi-tional variance. This formulation allows the special cases where all members share the same estimate of the natural rate when n;t= t for all n.1
The behavior of the private sector is summarized by
xt = xt (it Et t+1) + Et(xt+1 xt+1) + "t; (3) t = (xt xt) + Et t+1+ t; (4)
where itis the nominal interest rate, ; ; > 0 are constant parameters, Etdenotes the
pub-lic's expectations conditional on information available at time t, and "tand t are exogenous
autocorrelated disturbances with zero mean and constant conditional variance. The public is assumed to form expectations rationally and its information set at time t includes current and previous realizations of all model variables and shocks. Equation (3) is an IS curve and equation (4) is the Neo Keynesian Phillips curve. The IS curve may be derived from a linearized Euler equation for consumption and the resource constraint (see, McCallum and Nelson, 1999). The Neo Keynesian Phillips curve may be derived from the linearized pricing decision of a pro t-maximizing monopolistic competitor in a sticky-price environment.
Committee members are assumed to sincerely cast their vote. In each period and under discretion,2 the policy maker n computes x
t and t to maximize Et 1 X =0 Un( t+ ; xt+ )
subject to the aggregate supply curve and the IS curve. Given the optimal values of t and
xt, the interest rate preferred by member n is determined by Equation (3). Since private
sector expectations are taken as given by policy makers, future in ation and output are not a ected by current decisions and the rst-order condition reads
( t n;t) + n(xt xn;t) = 0: (5)
Using (5), (2) and the aggregate relations (3) and (4), one can write
in;t = ( n+ 2) ! n;t+ 1 + ( n+ 2) ! Et t+1+ 1! Et(xt+1 xt+1) (6) + ( n+ 2) ! t+ n ( n+ 2) ! n;t+ 1! "t;
1It is easy to generalize the model to the case where member n's estimate of the natural rate di ers
systematically from its true value by introducing a member-speci c constant in Equation (2). This gen-eralization does not change the reduced-form of the reaction function estimated below but it changes the structural interpretation of its intercept.
2The model is solved under discretion because the view taken here is that in ation targeting, as it is
actually practiced in the United Kingdom and other countries, is not a rule in the classical sense. Bernanke and Mishkin (1997) argue that \in ation targeting . . . contains a considerable degree of what most economists would de ne as policy discretion."
where in;t is member n's preferred interest rate.
Given the economy parameters and private-sector expectations, three empirical implica-tions follow from Equation (6). First, committee members agree on their policy reaction to the expected output gap and demand shocks. To see this, note that the coe cients of Et(xt+1 xt+1) and "t are both equal to 1= ; which is the inverse of the slope of the IS
curve. Second, committee members disagree in their reaction to expected in ation and supply shocks. This follows from the observation that the coe cients of Et t+1 and t
depend on the idiosyncratic preference parameter n: Finally, even if members share the
same in ation target and estimate of the natural rate (meaning that n;t = t and n;t= t
for all n), they would disagree in their preferred interest rate because the coe cients of n;t and n;t also depend on n:
The reason why members agree in their response to demand shocks but disagree in their response to supply shocks is the following. In the Neo Keynesian model, the e ect of demand shocks on the output gap may be o set directly by changes in the nominal interest rate (see Eq. (3)). However, o setting the e ect of supply shocks on in ation requires a monetary-policy-induced change in the output gap and, consequently, committee members face a trade-o between in ation and output stabilization.
3
Empirical Analysis
3.1
Data
The voting data consists of the preferred interest rates stated by each member of the Mone-tary Policy Committee (MPC) of the Bank of England in all the meetings held between June 1997 and June 2006. The sample starts with the rst meeting of the MPC and ends at the time the data was collected. We use both assenting and dissenting votes. This is possible because the Minutes record the names of members in favor of the Governor's proposal and the names and preferred policy options of dissenting members. If a member assents, we attribute to that member the policy adopted by the committee. If a member dissents, we attribute to that member his/her declared policy preference as stated in the Minutes.3 The
underlying assumption is that committee members cast their votes sincerely.
3In this sense, we treat assents and dissents symmetrically. The same approach is followed in Tootell (1991,
1999). Chappell et al. (2005) also use all votes but argue that a dissent favoring a move to, say, tighten is \behaviorally di erent from an assent that concurs with a committee move to tighten." In their empirical speci cation, dissents only arise when disagreement is su ciently acute. Recent game-theoretical models of dissent (see, Seidmann, 2006, and Groseclose and Milyo, 2006) point out that the choice of dissenting or assenting may also depend on strategic considerations (for example, on the probability of being pivotal).
The MPC consists of nine members of which ve are internal, that is, chosen from within the ranks of bank sta , and four are external appointees. Internal members are nominated by the Governor, while external members are appointed by the Chancellor. Meetings are chaired by the Governor of the Bank of England and take place monthly, usually on the Wednesday and Thursday after the rst Monday of each month. Decisions are made by simple majority on a one-person, one-vote basis. As of June 2006, twenty-four individuals have been members of the MPC but six of them have voting records that are too short to allow meaningful empirical analysis.4 After excluding these individuals, the sample reduces to 901 votes stated by eighteen MPC members during 109 meetings.5
For the estimation of reaction functions, we also use the time series of in ation, unem-ployment, industrial production, and money growth. Monthly observations of the Retail Price Index (RPI), the Retail Price Index excluding mortgage-interest payments (RPIX), the Consumer Price Index (CPI), the unemployment rate and the Index of Industrial Production were taken from the Web site of the U.K. National Statistics (www.statistics.gov.uk). The stock of money is measured by the end-of-month value of outstanding M4 and was taken from the Web site of the Bank of England (www.bankofengland.co.uk).
3.2
Econometric Strategy
The reaction function of member n may be written in reduced-form as
in;t = an+ bnEt t+1+ cnEt(xt+1 xt+1) + wn;t; (7) where an = ( n+ 2) ! t; bn = 1 + ( n+ 2) ;
4Of these six, four are very recent members of the MPC and, as of June 2006, they had participated in
only twelve (D. Walton), eight (J. Gieve), four (D. Blanch ower), and one (T. Besley) meetings. H. Davies was a member in the original MPC committee but participated only in two meetings on 6 June and 10 July 1997. A. Budd was member from December 1997 to May 1999 but his voting record consists of only 14 observations.
5Prior to November 1998, minutes reported whether dissenting members favored tighter or looser policy,
but not the interest rates they voted for. This means that a total of 23 dissenting votes from the period June 1997 to October 1998 could not be used for the estimation of the individual reaction functions of ve members. They are M. King (3 votes), A. Budd (4 votes), W. Buiter (8 votes), C. Goodhart (3 votes), and D. Julius (5 votes). Except for W. Buiter, the number of missing observations is relatively small compared with the total number of individual observations.
cn = 1 ; wn;t = ( n+ 2) ! t+ n ( n+ 2) ! n;t+ 1! "t:
Since the Bank of England follows an in ation targeting policy, the de nition of the intercept, a; explicitly assumes that committee members share the same in ation target. However, notice that because a also depends on the preference parameter, n; the intercept in the
reaction function is member speci c. For the same reason, the in ation coe cient, b, and the variance of the disturbance term are member speci c as well. In principle, the output coe cient, c, should be the same for all members, but the approach that we will follow here is to estimate an unrestricted version of the reaction function that allows c to vary across members and then statistically test whether c is constant or not. Following most of the literature, lagged realizations of the interest rate are added to the right-hand side of (7) in order to capture interest-rate smoothing and the serial correlation of the error term.6
The assumption of rational expectations on the part of the public means that
t+1 = Et t+1+ t+1; (8)
xt+1 xt+1 = Et(xt+1 xt+1) + t+1; (9)
where t+1 and t+1 are forecast errors uncorrelated with information available at time
t: Then, substituting (8) and (9) into (7) delivers
in;t= an+ bn t+1+ cn(xt+1 xt+1) + un;t; (10)
where the reduced-form disturbance un;t = wn;t bn t+1 cn t+1 now includes the forecast
errors. Since t+1 and xt+1 xt+1 are respectively correlated with t+1 and t+1; and hence
with un;t, Ordinary Least Squares (OLS) would yield biased and inconsistent parameter
estimates. For this reason, we use instead an Instrumental Variables (IV) procedure to estimate the reaction function of each member and of the committee as a whole. In particular, we use e cient Generalized Method of Moments (GMM). As it is well known, GMM is statistically more e cient than the standard IV and Two-Stage Least Squares (2SLS) because it exploits the heteroskedasticity and serial correlation of the residuals in an initial 2SLS regression to construct the optimal weighting matrix.7 We construct the weighting matrix
6An alternative approach would be to explicitly incorporate an interest-rate-smoothing motive in the
payo function (1), as in Woodford (2003). However, this strategy makes the model more di cult to solve because the committee member's problem becomes dynamic and its optimal solution requires her to forecast the preferred policies of other members.
7Since the dependent variable is discrete, an alternative strategy would be to use a Logit or Probit
regression. We abstained from following that approach because addressing the endogeneity of expectations is much more di cult in that setup.
using the Newey-West estimator with a Barlett kernel.
Instruments are the in ation target, and one lag of the nominal interest rate, RPI, CPI and RPIX in ation rates, the rate of money growth, the unemployment rate and the Index of Industrial Production (IIP), the latter two detrended in the manner described below. (We use a one-period lag because publication delays mean that contemporaneous observations may not actually form part of the public's information set at time t.) These instruments are both valid and relevant. The instruments are valid because, as part of the public's information set at time t; they are uncorrelated with the forecasts errors t+1 and t+1;
and are uncorrelated with the structural shocks in wn;t because the latter are exogenous by
assumption. This means that the instruments are uncorrelated with the error term, un;t:
The instruments are relevant because they are strongly correlated with the variables they are meant to instrument for.8
In the reaction function, in ation is measured by the annual percentage change in the RPIX,9 and the output gap is measured by the deviation of the unemployment rate from
a Hodrick-Prescott trend computed recursively using a window of 120 observations.10 The
change in the in ation target is modeled by allowing a break in the intercept term after December 2003 but, in order to preserve degrees of freedom, we restrict the size of the break to be equal to the actual target change.
3.3
Results
Table 1 reports benchmark results based on a forecast horizon of twelve months. This horizon is motivated by the observation that monetary policy a ects output and in ation
8The R2s for the rst-stage regressions vary from 0.66 to 0.92, and the p-values of the F test that the
instrument coe cients are all equal to zero are below 0.063.
9Prior to 10 December 2003, the in ation target applied to the twelve-month change in the RPIX.
Thereafter, it applies to the change in the CPI. Results using the RPIX for the sample until December 2003 and the CPI after that are similar to the ones reported below and support the same conclusions but they unfortunately require a speci c assumption as to when the public switched from forecasting RPIX to forecasting CPI in ation.
10We also considered using other output measures but few are available at the monthly frequency. The
National Institute for Economic and Social Research produces a monthly GDP index dating back to April 1984 but the series pre- and post- April 1995 are not comparable. The Bank of England compiles an index of capacity utilization based on survey data, but it is not available for the complete sample. In preliminary empirical work, we used the detrended IIP as output gap measure but found the reaction function coe cients to be statistically equal to zero in almost all cases and frequently of sign opposite to that predicted by theory. This result is perhaps not surprising because manufacturing accounts (as of 2003) for only 16% of national output and 13% of employment in the United Kingdom and, consequently, it is a relatively poor proxy for aggregate output.
with a long lag.11 Tables 2 and 3 report results using other forecast horizons, namely nine
(Table 2) and six (Table 3) months. These two Tables serve to assess the robustness of the results to di erent forecast horizons.12
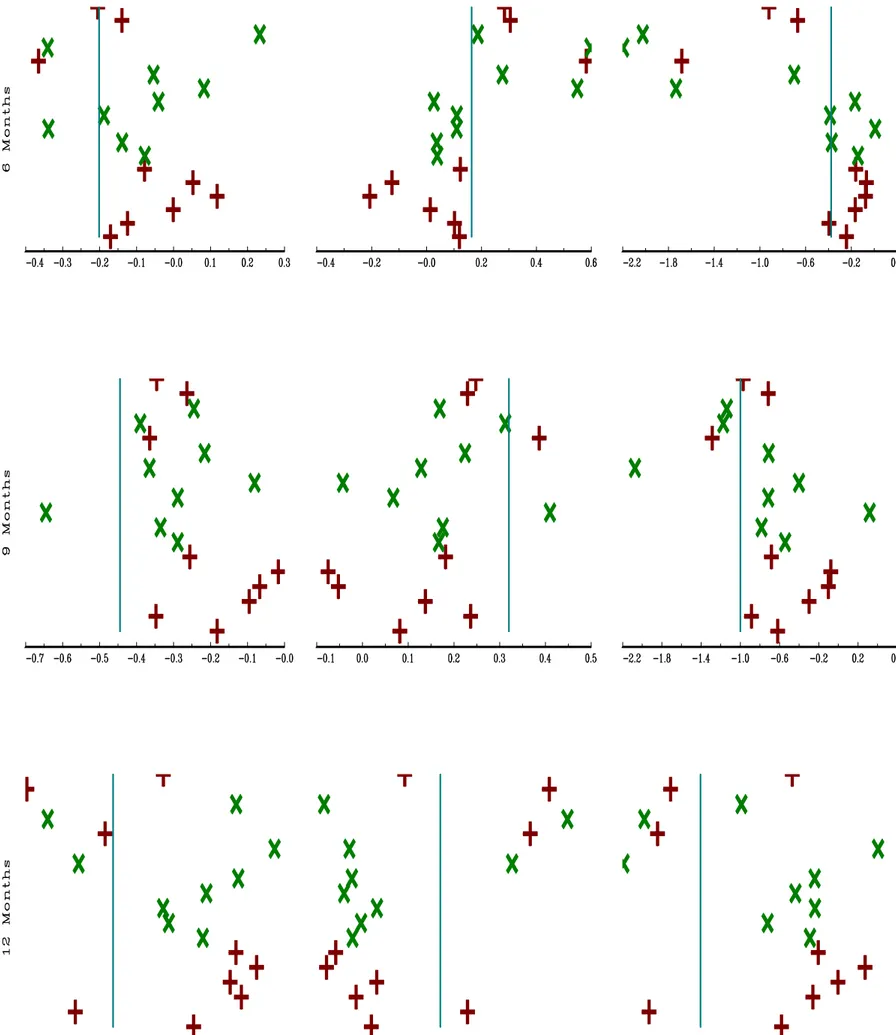
Panel A in Table 1 reports estimates of individual and committee reaction functions. These results indicate that the voting behavior of individual MPC members is generally consistent with the theory. First, point estimates of the in ation (unemployment) coe cients are usually positive (negative) and statistically signi cant meaning that members tend to vote to raise (lower) the Repo rate when in ation (unemployment) twelve-months ahead is expected to increase. In this and other Tables, there are occasional exceptions to this general observation but exceptions are usually characterized by numerically small and statistically insigni cant coe cients. Second, the overidentifying restrictions of the model cannot be rejected for any committee member nor for the committee as a whole. To see this, note that the p-values of J tests reported in the last column of Panel A in Table 1 are all above standard signi cance levels. Comparing these results with those in Panel A in Tables 2 and 3 indicates that these conclusions are robust to the forecast horizon. The reaction function coe cients are also graphically reported in Figure 1 where \pluses" are coe cients of internal members, \crosses" are coe cients of the external members, and vertical lines are the coe cients of the committee as a whole. Overall, results in Panel A and Figure 1 suggest that, in qualitative terms, MPC members have fairly homogeneous their policy preferences.
However, these results also indicate than, in quantitative terms, the reaction coe cients vary substantially across committee members. In order to examine whether this hetero-geneity is statistically signi cant, we perform Wald tests of the joint null hypothesis that the individual coe cients are equal to those of the committee and report results in Panel B of Table 1. For the complete sample of all committee members, the hypothesis can be rejected at the 5 percent signi cance level for the intercept and in ation coe cient but not for the unemployment coe cient. Although the latter result is marginal, it is in line with the implication of the model that members are more likely to disagree on their policy reaction to expected in ation than on their reaction to the expected output gap. Recall that in the model this was due to the fact that changes in expected in ation require a monetary-policy induced change in the output gap which leads to a trade-o between in ation and output stabilization, while changes in the expected output gap may be o set directly by adjusting
11Batini and Haldane (1999) evaluate the performance of forecast-based monetary policy rules with
dif-ferent forecast horizons and nd that the optimal horizon is around four quarters.
12The working paper version of this article (Authors, 2007) reports results using a di erent measure of
in ation, namely RPI in ation. Those results are very similar the ones reported here and indicate that our conclusions are also robust to the index used to compute in ation.
the nominal interest rate. From Panel B in Tables 2 and 3, it is clear that the rejection of the null hypothesis for the in ation coe cients is robust to the forecast horizon, but results concerning the unemployment coe cient are not. Overall, these statistical results suggest that individual policy responses within the MPC are heterogeneous.
Figure 2 plots the relation between the reaction function coe cients for all members for all possible pairwise comparisons. In all cases there is a positive and statistically signi cant relation across forecast horizons.13 This means that, in general, individuals who favor a strong response to expected in ation or unemployment do so regardless of the forecast horizons. Thus, the heterogeneity in individual policy responses within the MPC appears to be systematic.
There are at least two dimensions along which MPC members di er systematically. First, the nature of their appointment (whether internal or external to the Bank of England) and second, their career background (whether academic, private sector or Bank of England).14
Thus, we also perform the Wald test described above for subsamples of committee members. These results are reported in Panel B of Table 1 and show that the hypothesis that the individual in ation and unemployment coe cients are equal to those of the committee cannot be rejected for internal and Bank members, but is frequently rejected for external, academic, and private sector members.15 These results are not independent because most academic and private sector members in the MPC are also external appointees, while Bank members are internal members. Results are generally robust to the forecast horizon (see Panel B in Tables 2 and 3) and, as a whole, statistically con rm the idea that one important source of heterogeneity within the MPC is the nature of the individual membership.16 In order
to further explore this nding, Panel C in Tables 1 to 3 reports the median coe cients for all members and subsamples. Estimates indicate that the median external member tend to react more strongly to unemployment than the median internal member, but that there is no clear pattern regarding their reaction to in ation. The same result is observed when comparing academic and private sector members with Bank members. In general, reaction function coe cients increase with the forecast horizon, specially for academics.
Finally, Panel D in Table 1 reports the results of t tests that the committee reaction function coe cients are equal to the median of the individual coe cients. Since the p-values are above standard signi cance levels, the hypothesis cannot be rejected for the intercept,
13The slope parameters are not reported to save space but their t-statistics range from 2.21 to 5.27. 14For the classi cation of MPC members in terms of career background, we mostly rely on the information
contained in Spencer (2006).
15Note, however, that in some cases results are marginal in that the hypothesis would be rejected at the
5 but not the 10 percent signi cance level.
in ation, or unemployment. From Panel D in Tables 2 and 3, it is clear that this result is robust to the forecast horizon. Since the committee and median coe cients are (statistically) the same but the coe cients of committee and external members are (statistically) di erent, it follows that the median voter in the MPC is likely be an internal member.
4
Conclusions
This paper exploits the voting records of the Monetary Policy Committee (MPC) of the Bank of England to study preference heterogeneity among committee members. The analysis is motivated by the empirical observations that disagreement is frequent within the MPC and by summary statistics reported in earlier literature which suggest di erences in voting pat-terns. This research shows that, in qualitative terms, MPC members are fairly homogeneous in their policy preferences. That is, individual members tend to vote for an interest rate raise (decrease) when in ation (unemployment) is expected to increase, as one would expect. However, there are systematic quantitative di erences in their policy reaction functions that appear related to the nature of the membership and previous career background. These systematic di erences may be important in the decision-making process of the MPC and a ect the interest rate level selected by the committee.
Table 1. Benchmark Results (12-Month Horizon) A. Reaction Function Coe cients
Intercept In ation Unemployment J test Member Estimate s.e. Estimate s.e. Estimate s.e. (p-value) George 0:493 0:338 0:277 0:280 0:983 0:667 0:451 King 1:132y 0:686 0:768 0:505 2:334y 1:410 0:633 Lomax 0:233 0:063 0:199 0:059 0:661 0:215 0:738 Large 0:294 0:117 0:305 0:137 0:407 0:472 0:433 Tucker 0:151 0:099 0:049 0:066 0:129 0:300 0:382 Bean 0:263 0:201 0:096 0:078 0:607 0:553 0:150 Barker 0:442 0:213 0:182 0:092 0:692 0:600 0:429 Nickell 0:627 0:260 0:225y 0:131 1:124y 0:603 0:517 Allsopp 0:657 0:147 0:306 0:095 0:641 0:436 0:477 Bell 0:424 0:132 0:138y 0:074 0:840 0:281 0:567 Lambert 0:251 0:083 0:179 0:060 0:642 0:221 0:627 Buiter 1:114 0:389 0:996 0:357 2:592 1:095 0:152 Goodhart 0:055 0:298 0:166 0:250 0:003 0:651 0:292 Vickers 0:971 0:236 1:088 0:319 2:246 0:689 0:478 Julius 1:281 0:335 1:278 0:403 2:381 0:531 0:546 Wadhwani 0:262 0:236 0:036 0:129 1:391 0:308 0:524 Plenderleith 1:394y 0:788 1:185 0:755 2:113 1:368 0:932 Clementi 0:656y 0:368 0:448 0:308 0:871 0:817 0:524 Committee 0:927 0:628 0:630 0:467 1:808 1:308 0:576
B. Individual and Committee Coe cients are Equal (p-value) Intercept In ation Unemployment All members 0:002 0:003 0:053 External 0:020 0:034 0:077 Internal 0:050 0:170 0:284 Academic 0:262 0:055 0:501 Private 0:117 0:260 0:088 Bank 0:419 0:248 0:385
C. Median Coe cients
Intercept In ation Unemployment All members 0:468 0:251 0:856 External 0:442 0:182 0:840 Internal 0:493 0:305 0:871 Academic 0:814 0:537 1:685 Private 0:424 0:182 0:840 Bank 0:233 0:199 0:661
D. Committee Coe cients are Equal to the Median (p-value) Intercept In ation Unemployment
Table 2. Robustness to Forecast Horizon (9-Months) A. Reaction Function Coe cients
Intercept In ation Unemployment J test Member Estimate s.e. Estimate s.e. Estimate s.e. (p-value) George 0:182 0:127 0:081 0:116 0:621 0:279 0:357 King 0:348 0:156 0:237y 0:130 0:888 0:334 0:347 Lomax 0:096 0:075 0:137 0:111 0:301 0:127 0:307 Large 0:067 0:109 0:053 0:098 0:104 0:201 0:381 Tucker 0:017 0:100 0:075 0:064 0:078 0:200 0:573 Bean 0:256 0:100 0:181 0:072 0:685 0:272 0:649 Barker 0:289 0:118 0:167 0:124 0:555y 0:324 0:497 Nickell 0:336 0:116 0:175y 0:103 0:785 0:286 0:476 Allsopp 0:645 0:093 0:410 0:083 0:317 0:268 0:378 Bell 0:289 0:129 0:067 0:095 0:716 0:334 0:235 Lambert 0:081 0:089 0:043 0:149 0:403 0:129 0:338 Buiter 0:365 0:178 0:128 0:207 2:076 0:729 0:420 Goodhart 0:216 0:136 0:224 0:110 0:712 0:445 0:266 Vickers 0:365 0:242 0:386 0:287 1:288 0:410 0:334 Julius 0:390 0:173 0:312 0:248 1:176 0:400 0:334 Wadhwani 0:245 0:185 0:169 0:138 1:140 0:203 0:186 Plenderleith 0:265 0:127 0:229 0:165 0:717 0:267 0:360 Clementi 0:346y 0:192 0:248 0:204 0:974y 0:527 0:517 Committee 0:445 0:185 0:320 0:148 1:000 0:382 0:594
B. Individual and Committee Coe cients are Equal (p-value) Intercept In ation Unemployment All members 0:004 0:031 < 0:001 External 0:013 0:057 0:002 Internal 0:306 0:812 0:048 Academic 0:150 0:007 0:007 Private 0:342 0:909 0:012 Bank 0:308 0:435 0:159
C. Median Coe cients
Intercept In ation Unemployment All members 0:277 0:172 0:714 External 0:289 0:169 0:716 Internal 0:256 0:181 0:685 Academic 0:356 0:209 0:836 Private 0:289 0:167 0:716 Bank 0:182 0:137 0:621
D. Committee Coe cients are Equal to the Median (p-value) Intercept In ation Unemployment
Table 3. Robustness to Forecast Horizon (6-Months) A. Reaction Function Coe cients
Intercept In ation Unemployment J test Member Estimate s.e. Estimate s.e. Estimate s.e. (p-value) George 0:171y 0:099 0:119 0:098 0:244 0:203 0:195 King 0:125 0:082 0:101 0:076 0:396 0:176 0:168 Lomax 0:001 0:050 0:013 0:041 0:168y 0:100 0:276 Large 0:118 0:082 0:207 0:089 0:076 0:172 0:560 Tucker 0:052 0:087 0:127y 0:077 0:069 0:169 0:547 Bean 0:079 0:066 0:123 0:050 0:163 0:144 0:577 Barker 0:078 0:067 0:039 0:053 0:143 0:146 0:347 Nickell 0:140 0:089 0:037 0:069 0:372 0:166 0:576 Allsopp 0:339y 0:195 0:110 0:147 0:008 0:357 0:122 Bell 0:188 0:165 0:110 0:139 0:386 0:319 0:162 Lambert 0:041 0:070 0:026 0:079 0:169 0:129 0:433 Buiter 0:082 0:182 0:549 0:275 1:735 0:500 0:325 Goodhart 0:055 0:104 0:276 0:197 0:701 0:246 0:342 Vickers 0:366 0:304 0:581 0:374 1:683 0:567 0:328 Julius 0:341y 0:205 0:597 0:166 2:197 0:443 0:480 Wadhwani 0:233 0:142 0:186 0:177 2:026 0:350 0:715 Plenderleith 0:140 0:099 0:304y 0:185 0:670 0:315 0:132 Clementi 0:205y 0:122 0:283y 0:172 0:921 0:388 0:165 Committee 0:201 0:084 0:164 0:072 0:377 0:158 0:220
B. Individual and Committee Coe cients are Equal (p-value) Intercept In ation Unemployment All members 0:100 < 0:001 < 0:001 External 0:199 < 0:001 < 0:001 Internal 0:073 0:324 0:114 Academic 0:618 < 0:001 0:085 Private 0:026 0:040 < 0:001 Bank 0:165 0:182 0:382
C. Median Coe cients
Intercept In ation Unemployment All members 0:102 0:114 0:379 External 0:078 0:110 0:386 Internal 0:125 0:119 0:244 Academic 0:132 0:116 0:384 Private 0:078 0:110 0:386 Bank 0:055 0:119 0:244
D. Committee Coe cients are Equal to the Median (p-value) Intercept In ation Unemployment
Notes to all Tables: Internal members are George, King, Lomax, Large, Tucker, Bean, Vick-ers, Plenderleith and Clementi. The remaining members are external. King, Bean, Nickell, Allsopp, Buiter and Vickers have academic background. Large, Barker, Bell, Lambert, Julius and Clementi come from the private sector. The remaining members have been Bank of England sta or government o cials. See Spencer (2006) for additional details. The superscripts and y denote the rejection of the null hypothesis that the true coe cient is zero at the 5 and 10 percent signi cance levels.
References
[1] Batini, Nicoletta and Andrew, Haldane, (1999), \Monetary Policy Rules and In ation Forecasts," Bank of England Quarterly Bulletin, pp. 60-67.
[2] Belden, Susan, (1989), \Policy Preferences of FOMC Members as Revealed by Disenting Votes," Journal of Money, Credit and Banking 21, pp. 432-441.
[3] Bernanke, Ben S., and Frederic S. Mishkin, (1997), \In ation Targeting: A New Frame-work for Monetary Policy?," Journal of Economic Perspectives 11, pp. 97-116.
[4] Chappell, Henry W., Rob Roy McGregor, and Todd Vermilyea, (2005), Committee Decisions on Monetary Policy, Cambridge: MIT Press.
[5] Fry, Maxwell, DeAnne Julius, Lavan Mahadeva, Sandra Roger, and Gabriel Sterne, (2000), \Key Issues in the Choice of Monetary Policy Framework," in Monetary Frame-works in a Global Context, Lavan Mahadeva and Gabriel Sterne (eds), London: Rout-ledge.
[6] Gerlach-Kristen, Petra, (2003), \Insiders and Outsiders at the Bank of England," Cen-tral Banking 14, pp. 96-102.
[7] Gildea, John A., (1990), \Explaining FOMC Members' Votes," in The Political Economy of American Monetary Policy, Thomas Mayer (ed), pp. 211-228, Cambridge: Cambridge University Press.
[8] Groseclose, T. and J. Milyo, (2006), \A Rational-Choice, Formal-Theoretic Argument Against the Existence of Sophisticated Voting in Legislatures," UCLA, Mimeo.
[9] Havrilesky, Thomas M. and Robert L. Schweitzer, (1990), \A Theory of FOMC Dissent Voting with Evidence from the Time Series," in The Political Economy of American Monetary Policy, Thomas Mayer (ed), pp. 197-210, Cambridge: Cambridge University Press.
[10] Havrilesky, Thomas M. and John A. Gildea, (1991), \The Policy Preferences of FOMC Members as Revealed by Dissenting Votes: Comment," Journal of Money, Credit, and Banking 23, pp. 130-138.
[11] McCallum, Bennett and Edward Nelson, (1999), \An Optimizing IS-LM Speci cation for Monetary Policy and Business Cycle Analysis," Journal of Money, Credit and Bank-ing 31, pp. 296-316.
[12] Meade, Ellen and Nathan Sheets, (2005) \Regional In uences on FOMC Voting Pat-terns," Journal of Money, Credit, and Banking 37, pp. 661-677.
[13] Seidmann, Daniel, (2006), \A Theory of Voting Patterns and Performance in Private and Public Committees," Nottingham University, Mimeo.
[14] Spencer, Christopher, (2006), \The Dissent Voting Bahaviour of Bank of England MPC Members," University of Surrey, Discussion Paper 03/06.
[15] Tootell, Geo rey M. B., (1999), \Whose Monetary Policy Is It Anyway?" Journal of Monetary Economics 43, pp. 217-235.
[16] Tootell, Geo rey M. B., (1991), \Are District Presidents More Conservative than Board Governors?" New England Economic Review, pp. 3-12
[17] Woodford, Michael, (2003), \Optimal Interest-Rate Smoothing," Review of Economic Studies 70, pp. 861-886.