UNIVERSITÉ DE SHERBROOKE Faculté de génie
Département de génie mécanique
.
ANALYSES EXPÉRIMENTALE, NUMÉRIQUE ET
OPTIMISATION DE TRAITEMENTS ACOUSTIQUES
MULTICOUCHES À BASE DE MATÉRIAUX
VISCOÉLASTIQUES ET POREUX POUR RÉDUIRE LE
BRUIT À BORD DE L’AVION
Thèse de Doctorat Spécialité : génie mécanique
Esen Cintosun
Jury : Prof. Noureddine Atalla (directeur) Prof. Raymond Panneton
Prof. Franck C. Sgard Dr. Sebastian Ghinet
RÉSUMÉ
Ce projet de recherche est composé de trois parties principales : la première comprend l’analyse expérimentale et la simulation des performances vibratoires de matériaux avec amortissement viscoélastique, en tant que traitements acoustiques appliqués aux structures du fuselage d’un avion. La deuxième partie comprend l’analyse expérimentale et le calcul de la performance acoustique de ces matériaux amortissant en comparaison avec l’effet d’une masse équivalente. Enfin, la troisième partie est une étude paramétrique sur les effets de localisation, de la densité et de la taille d’un traitement massique.
Les systèmes d’isolation phoniques typiquement employés dans la construction des fuselages d’avions sont composés de matériaux poreux, avec ou sans des matériaux amortissant (matériaux viscoélastiques). La performance et donc l’utilité de ces traitements amortissant, en comparaison avec une couche de masse équivalente, reste une question largement ouverte. Dans ce travail on a comparé numériquement et expérimentalement les performances acoustiques d’un traitement amortissant avec celui d’une masse équivalente tous les deux incorporées dans le traitement phonique et ceci pour plusieurs types d’excitations. Deux structures représentant des fuselages, une en aluminium et la seconde en carbone composite, ont été sélectionnées pour cette étude ainsi que deux matériaux poreux couramment utilisés en aéronautique : une laine en fibre de verre et une mousse à cellules ouvertes. Deux types d’excitations ont été étudiés numériquement et expérimentalement. La première est une excitation acoustique (champ diffus) et la seconde mécanique (forces ponctuelles). Une troisième, excitation par couche limite turbulente a été étudié numériquement. Dans tous les cas, la perte par insertion du traitement acoustique est utilisée comme indicateur principal de la performance. D’autres indicateurs comme le coefficient d’absorption, le coefficient de perte par amortissement et la vitesse quadratique moyenne sont aussi utilisés pour mieux cerner et expliquer l’effet du traitement.
Il a été démontré que l’utilisation d’une couche de masse équivalente à un traitement viscoélastique conduit systématiquement à la meilleure performance acoustique et ceci pour les trois types d’excitations étudiées. En particulier, dans le cas classique où le traitement amortissant est appliqué directement au fuselage. Dans ce dernier cas, les effets de doubles parois créés par la couche massique, positionnée judicieusement loin du fuselage, augmentent la performance en moyennes et hautes fréquences. Les performances en basses fréquences restent limitées par la fréquence de résonance double parois. Et même l’effet amortissant des traitements viscoélastiques, théoriquement visible aux résonances et coïncidences du système, se trouve limité par l’amortissement ajouté par le montage et le traitement absorbants. Cependant, l’efficacité de la couche massique est compromise par les difficultés d’installations et en particulier pour les fibreux. Les résultats de cette thèse restent toutefois limités par notre choix de structures et de traitements étudiés.
Mots-clés: Vibroacoustique, Aeronautique, Bruit, Vibrations, Amortissement, Absorption,
SUMMARY
The project is made up of three main parts. The first part involves a comprehensive experimental and numerical analysis of viscoelastic damping materials as acoustic treatments to aircraft fuselage structures. The second part involves numerical and experimental acoustic comparison of viscoelastic damping material to equivalent mass. And the third part is a parametric study of equivalent mass for the effects of mass location, density and size. The goal of the project is to identify the vibroacoustic effect of viscoelastic material damping of fuselage skin, and develop possible alternatives to damping.
The insulation systems (typically used on aircraft) that are made up of porous materials with or without viscoelastic damping material or equivalent mass were called sound packages throughout this document. The viscoelastic damping material and equivalent mass both incorporated in sound packages were acoustically compared. Fiberglass and open cell foam were used as porous materials. The viscoelastic damping material used in this study is constraining layer damping and abbreviated as CLD. The equivalent mass was an impervious screen. Both representative Aluminum and carbon composite fuselage skin structures were treated with sound packages as part of the comparison.
The vibroacoustic performance indicators were used to characterize the sound packages. The indicators were airborne insertion loss (ABIL), structure borne insertion loss (SBIL), turbulent boundary layer insertion loss (TBLIL), average quadratic velocity (AQV), damping loss factor (DLF), absorption coefficient, and radiation efficiency. Diffuse field acoustic excitation was used to obtain the vibroacoustic indicators of ABIL and absorption coefficient. Mechanical excitation was used to obtain SBIL, AQV, DLF, absorption coefficient, and radiation efficiency. Turbulent boundary layer excitation was modeled to obtain TBLIL.
The numerical methods of finite element method (FEM) and transfer matrix method (TMM) were used to calculate all of the above vibroacoustic performance indicators. Experimentally, ABIL, SBIL, AQV, DLF and radiation efficiency were measured. Experimental modal analysis was also performed to characterize representative Aluminum and carbon composite fuselage skin structures.
Based on the numerical analysis, equivalent mass generated a double or multiple (in case of double wall layer configuration) wall effect and hence became an effective acoustic insulator as part of sound packages at mid to high frequencies. Even at coincidence frequencies (in case of the representative carbon composite fuselage skin), the equivalent mass layer was more effective than viscoelastic damping material. However, the drawback was the occurrence of the double wall resonance at lower frequencies which compromised the effectiveness. Nevertheless, the parametric study of equivalent mass revealed that equivalent mass is superior to viscoelastic damping material at reduced weight in term of vibroacoustic performance indicators of overall ABIL/SBIL/TBLIL in the frequency range of 100 to 6300 Hz and mean ABIL/SBIL/TBLIL in SIL (octave 1k, 2k, 4k Hz) frequency range.
Keywords: Vibroacoustics, Aeronautics, Noise, Vibrations, Damping, Absorption,
REMERCIEMENTS
I’d first like to thank my supervisors Prof. Noureddine Atalla and Dr. Tatjana Stecenko for their support for the collaborative research project between MTI Polyfab and the University of Sherbrooke that my dissertation became a part of. Their support, encouragement and perspective allowed the realization, progression and completion of the project. Their dedication to research is remarkable. Next, I’d like thank the jury members: Prof. F. C. Sgard, Dr. Sebastian Ghinet and Prof. Raymond Panneton for the detailed review of my thesis report and their encouragement. Beside Prof. Atalla, Dr. Maxime Bolduc was my main connection to the University of Sherbrooke. I’d like to thank him for helping me with administrative issues, testing, and analyzing the test results. Dr. Bolduc was always supportive and tremendous help in testing. I’d also like to thank (in no particular order) to Dr. Sebastian Ghinet for the introduction and warm welcome to UdeS during my visits, Dr. Celse Kafui Amédin for support in Nova and NovaFEM, Dr. Kamel Amichi for help with the use of NovaFEM, Abderrazak Mejdi for help with the use of Femap, Andrew Wareing for providing Bombardier panels, Chantal Simard for storing and locating the test samples, Dilal Rhazi for helping me with tests, Patrick Lévesque for building my panels, Rémy Oddo for help with testing, Eric Chen, Gina Deonarian, Satish Perera, and shop personnel for preparing my samples and Marcelo Santos, Prof. Arcanjo Lenzi and Fabio for the tests performed at the University of Florianopolis Acoustic and Vibration Laboratory, in Santa Catarina, Brazil.
TABLE DES MATIÈRES
RÉSUMÉ ... i
SUMMARY ...ii
REMERCIEMENTS... v
LISTE DES FIGURES ... ix
LISTE DES TABLEAUX... xix
Chapter 1 Introduction... 1
1.1 Aircraft TBL & engine noise sources... 3
1.2 Aircraft passive noise control overview ... 4
1.3 Objectives ... 5
1.4 Overview of dissertation... 6
Chapter 2 Literature review ... 9
2.1 Viscoelastic material damping ... 10
2.1.1 Effects of temperature ... 11
2.1.2 Effects of frequency ... 12
2.1.3 Effects of pre-stress and cyclic strain amplitude... 13
2.1.4 Other environmental effects... 13
2.1.5 Damping treatment design ... 13
2.2 Alternative methods to viscoelastic material damping... 14
2.3 Noise transmission loss through partition... 19
Chapter 3 Vibroacoustic performance indicators and testing methodologies ... 25
3.1 Vibroacoustic performance indicators... 25
3.1.1 Damping loss factor... 26
3.1.2 Airborne insertion loss... 28
3.1.3 Structure-borne insertion loss ... 30
3.1.4 Turbulent boundary layer excitation insertion loss ... 33
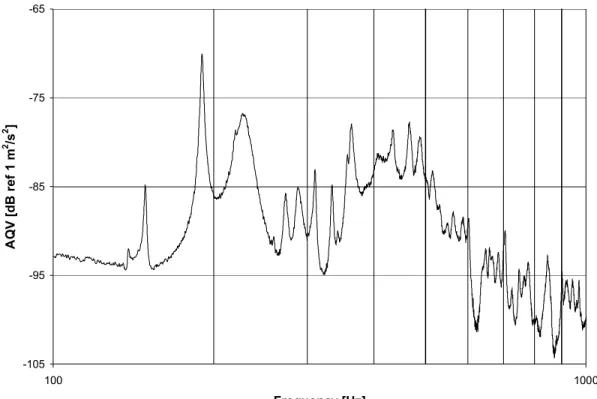
3.1.5 Average quadratic velocity ... 35
3.1.6 Radiation efficiency... 35
3.1.7 Absorption coefficient ... 36
3.1.8 Computational tools... 37
3.2 Testing Methodologies ... 38
3.2.1 DLF and AQV testing methodologies... 39
3.2.2 TL testing methodology... 44
3.2.3 SBIL and AQV testing methodologies... 50
3.2.4 Radiation efficiency testing methodology... 54
TABLE DES MATIÈRES viii
Chapter 4 Constrained layer damping vibration performance...59
4.1 Experimental AQV and DLF results and discussion ...61
4.1.1 Analysis of Al ribbed panel damping...65
4.1.2 Analysis of carbon composite ribbed panel damping ...78
4.2 Numerical AQV results and discussion...88
4.2.1 Description of Femap/Nastran model of Al ribbed panel ...88
4.2.2 Al ribbed panel FEM results...91
4.3 Conclusions...96
Chapter 5 Viscoelastic material damping versus equivalent mass layer...99
5.1 Experimental and numerical results obtained using Al panels & discussion...107
5.1.1 Bare ribbed Al panel results ...108
5.1.2 Ribbed Al panel treated with melamine foam sound packages...115
5.1.3 Ribbed and flat Al panels treated with fiberglass sound packages...126
5.2 Experimental and numerical results obtained using carbon composite panel & discussion...134
5.3 Overall results and final remarks ...146
Chapter 6 Parametric study...151
6.1 Mass layer location study ...153
6.2 Mass layer density study ...160
6.3 Mass layer size study...166
6.4 Experimental results and final remarks...169
Chapter 7 Conclusion and perspectives ...177
7.1 Conclusions...177
7.2 Future work...179
Annexe A DLF results...181
A.1 Aluminum ribbed panel DLF results...181
A.2 Carbon composite panel DLF results...196
Annexe B Smactane EX ...201
B.1 Smactane EX shear modulus and loss angle tangent ...201
B.2 Smactane EX shift factor alpha T ...202
Annexe C Layup of the ribbed carbon composite panel ...203
Annexe D Chapter 5 additional plots ...207
Annexe E Parametric study ABIL, SBIL and TBLIL plots ...215
E.1 Location...215
E.2 Density...221
E.3 Size...227
Annexe F Parametric study overall ABIL, SBIL and TBLIL results ...233
LISTE DES FIGURES
Figure 1-1: Sound absorbing material installed next to fuselage skin... 5
Figure 1-2: A combination of foam and fiberglass sound absorbing material that is typically used in aircraft insulation ... 5
Figure 2-1: Variation of storage modulus and loss factor of a viscoelastic material with increasing temperature from Glassy region to Flow region [1]. ... 12
Figure 2-2: Free layer damping [1] ... 14
Figure 2-3: Constrained layer damping [1]... 14
Figure 2-4: Double panel system – fuselage (1), heterogeneous blanket (2), air cavity (3), trim panel (4), and interior acoustic field (5) [43]. ... 16
Figure 2-5: Schematic of “effective area” concept [44]. ... 18
Figure 2-6: Variation of resonant frequency of an 8 g mass in a melamine foam block (35x35x100 mm) as a function of the thickness of foam beneath the mass [44]. ... 18
Figure 2-7: An illustration of a double-leaf panel [12]... 21
Figure 2-8: Schematic illustration of the behavior of a typical double-lead panel [56]... 22
Figure 3-1: Multilayered panel under mechanical excitation [58]... 31
Figure 3-2: Pictures of (a) bare Al ribbed panel, (b) Al ribbed panel with CLD... 40
Figure 3-3 : A photograph of the Polytec laser vibrometer [73]... 41
Figure 3-4: Scheme of measurement setup [73]... 41
Figure 3-5: Photos illustrating the filler wall construction (a) with gypsum boards; (b) wood frame with resilient bars and isolating material (before adding the gypsum boards) [75]45 Figure 3-6: Illustration of the mounting of the panel in the test window [75]... 46
Figure 3-7: Rotating microphone, loudspeakers and diffusers positions in the source room [ 75] ... 46
Figure 3-8: Horizontal and vertical intensity scans performed for each TL measurement [75]47 Figure 3-9: Schematic of the LVA-UFSC transmission loss measurement facility [77] ... 48
Figure 3-10: Transmission loss measurement data collection instruments used at UFSC for composite panel testing [77]... 50
Figure 3-11: Schematic illustration of a typical AMCF measurement setup [75] ... 51
LISTE DES FIGURES x
Figure 3-13: Flat Al panel (not ribbed Al panel) exact mechanical excitation locations and accelerometer locations for average quadratic velocity measurements [75] ...52 Figure 3-14 : Excitation and response points used for radiation efficiency measurements [80] ...56 Figure 3-15 : The shaker attached to the carbon composite panel [80] ...57 Figure 4-1: DLF values obtained at -30 C on bare Al ribbed using DRM, PIM and half-power
bandwidth (modal) methods are plotted against frequency. ...64 Figure 4-2: DLF values obtained at -30 C on Al ribbed panel with 80% VS1 coverage using
DRM, PIM and half-power bandwidth (modal) methods are plotted against frequency. .64 Figure 4-3: Measured AQV on the bare Al ribbed panel surface ...66 Figure 4-4: Mode shapes (operating deflection shapes at resonance frequencies),
corresponding modal frequencies and loss factors in % obtained from velocity measurements on the surface of Al ribbed panel ...67 Figure 4-5: Measured AQV plot for bare Al ribbed panel in third octave frequency...68 Figure 4-6: Plots of input mobility measured at the shaker excitation point on the surface of
the Al ribbed panel treated with CLD configurations at (a) -40 C; (b) -30 C; and (c) 20 C ...69 Figure 4-7: Bare panel AQV results at -40, -30, -20, -10, 0 and 20 C...70 Figure 4-8: Plots of mass corrected AQV measured on the surface of the Al ribbed panel
treated with various CLD configurations at -40 C ...71 Figure 4-9: Plots of mass corrected AQV measured on the surface of the Al ribbed panel
treated with various CLD configurations at -30 C ...72 Figure 4-10: Plots of mass corrected AQV measured on the surface of the Al ribbed panel
treated with various CLD configurations at 20 C ...73 Figure 4-11: Mass corrected overall AQV IL in the frequency range of 50 to 2500 Hz at -40 C ...74 Figure 4-12: Mass corrected overall AQV IL in the frequency range of 50 to 2500 Hz at -30 C ...75 Figure 4-13 Mass corrected overall AQV IL in the frequency range of 50 to 2500 Hz at 20 C ...76 Figure 4-14: Measured AQV on the bare carbon composite ribbed panel surface...79
xi
Figure 4-15: Mode shapes (operating deflection shapes at resonance frequencies), corresponding modal frequencies and loss factors in % obtained from velocity measurements on the surface of carbon composite ribbed panel ... 80 Figure 4-16: Measured AQV plot for bare carbon composite ribbed panel in third octave
frequency... 81 Figure 4-17: Plots of input mobility measured at the shaker excitation point on the surface of
the carbon composite ribbed panel at (a) -40 C; (b) -30 C; and (c) 20 C ... 82 Figure 4-18: Plots of mass corrected AQV measured on the surface of the carbon composite
ribbed panel with or without VS3 treatment at -40 C... 83 Figure 4-19: Plots of mass corrected AQV measured on the surface of the carbon composite
ribbed panel with or without VS3 treatment at -30 C... 84 Figure 4-20: Plots of mass corrected AQV measured on the surface of the carbon composite
ribbed panel with or without VS3 treatment at 20 C ... 85 Figure 4-21: Mass corrected overall AQV IL in the frequency range of 50 to 2500 Hz at -40 C ... 86 Figure 4-22: Mass corrected overall AQV IL in the frequency range of 50 to 2500 Hz at -30 C ... 87 Figure 4-23: Mass corrected overall AQV IL in the frequency range of 50 to 2500 Hz at 20 C ... 88 Figure 4-24: Isometric view of the panel... 89 Figure 4-25: Location of the input force is shown by the red arrow, top left corner of the base
plate being the origin, input force is located at (x, y, z) coordinates in mm of (53.3, 276.9, 0). ... 90 Figure 4-26: 80% coverage viscoelastic material damping in Femap/Nastran... 91 Figure 4-27: Comparison of measured and Femap/Nastran calculated IM for bare Al ribbed
panel... 92 Figure 4-28 : A few mode shapes and corresponding modal frequencies obtained from
displacement calculations on the surface of Al ribbed panel using Femap/Nastran ... 94 Figure 4-29: Femap/Nastran calculated AQV for bare Al ribbed panel, panel with 50% VS1
coverage and 80% VS1 coverage – results are in 1/3 octave... 96 Figure 5-1: Picture of the ribbed Al panel ... 101
LISTE DES FIGURES xii
Figure 5-2: Picture of the carbon composite panel ...101
Figure 5-3: Carbon composite panel melamine bricks and frame blankets ...103
Figure 5-4: Melamine bricks installed to carbon composite panel (a) and melamine frame blankets installed to carbon composite panel over bricks (b) ...104
Figure 5-5: Mode at 195 Hz obtained by Femap/Nastran clamped constrained modal analysis of the ribbed Al panel ...109
Figure 5-6: Ribbed Al panel (bare), bare with CLD (bareDamp) and bareDamp mass corrected measured TL plots...110
Figure 5-7 : Ribbed Al panel (bare) and bareDamp configurations measured narrow frequency band AQV results ...111
Figure 5-8 : Ribbed Al panel (bare), bareDamp and bareDamp mass corrected configurations measured third octave frequency band AQV results...112
Figure 5-9: Measured ABIL and SBIL plots for ribbed Al panel (bare) with damping configuration ...113
Figure 5-10: Comparison of experimental and numerical TL for bare configuration ...114
Figure 5-11: Comparison of measured and numerical ABIL for ribbed Al panel (bare) with damping configuration...115
Figure 5-12: Mass corrected melamine foam sound package configurations ABIL results ...117
Figure 5-13: Mass corrected melamine foam sound package configurations SBIL results....118
Figure 5-14: Mass layer installation method for mela200 configuration...119
Figure 5-15: Experimental SBIL and ABIL comparison for mela sound package...120
Figure 5-16: Experimental SBIL and ABIL comparison for mela100 sound package...121
Figure 5-17: Experimental SBIL and ABIL comparison for melaDamp sound package ...122
Figure 5-18: Melamine sound package configurations (a) frame and (b) top covers blankets122 Figure 5-19: Numerically obtained absorption coefficient plots for melamine foam sound package configurations – diffuse acoustic field excitation, source side, without panel..123
Figure 5-20: Numerically obtained radiation efficiency plots for melamine sound package configurations – rain on the roof (mechanical) excitation is used ...123
Figure 5-21: Experimental and numerical ABIL comparison for mela sound package...124
Figure 5-22: Experimental and numerical ABIL comparison for mela100 sound package....125 Figure 5-23: Experimental and numerical ABIL comparison for melaDamp sound package 125
xiii
Figure 5-24 : Experimental and numerical SBIL comparison for mela sound package... 126 Figure 5-25: Mass corrected measured ABIL plots for fiberglass sound package configurations ... 128 Figure 5-26: Mass layer bagged as part of bricks in fiber200 sound package... 128 Figure 5-27: Mass corrected measured SBIL plots for fiberglass sound package configurations ... 129 Figure 5-28: Numerically obtained absorption coefficient plots for fiberglass sound package
configurations – diffuse acoustic field excitation, fluid domain, source side, without panel ... 130 Figure 5-29: Fiberglass sound package configurations (a) frame and (b) top covers blankets ... 130 Figure 5-30: Flat Al panel mass corrected ABIL plots for fiberglass with mass layer and
fiberglass with CLD configurations... 131 Figure 5-31: Flat Al panel mass corrected SBIL plots for fiberglass with mass layer and
fiberglass with CLD configurations... 132 Figure 5-32: Numerically obtained absorption coefficient plot for 2” fiberglass (0.6 pcf) sound
package configuration – diffuse acoustic field excitation, fluid domain, source side, without panel ... 133 Figure 5-33 : The method of installation of equivalent mass layer as part of sound package for
carbon composite panel... 135 Figure 5-34: Measured TL for composite bare panel, bare panel with damping and mass
corrected TL for bare panel with damping... 136 Figure 5-35: Mass corrected plots of measured ABIL for cbare+CLD+B+FB+TC and
cbare+B+FB+mass+TC sound package configurations... 138 Figure 5-36 : Numerical absorption coefficient plots for cbare+CLD+B+FB+TC and
cbare+B+FB+mass+TC configurations obtaining using diffuse acoustic field excitation, on receiver side and in fluid domain... 138 Figure 5-37: Measured radiation efficiency plots for cbare and cbare+CLD configurations. 139 Figure 5-38: Measured radiation efficiency plots for configurations cbare+CLD+B+FB+TC
LISTE DES FIGURES xiv
Figure 5-39: Comparison of experimental and numerical TL for bare carbon composite configuration ...141 Figure 5-40 : Comparison of experimental and numerical ABIL for cbare+CLD configuration ...142 Figure 5-41: Comparison of experimental and numerical ABIL for cbare+CLD+B+FB+TC
configuration ...143 Figure 5-42: Comparison of experimental and numerical ABIL for cbare+B+FB+mass+TC
configuration ...144 Figure 5-43: Experimentally and numerically obtained radiation efficiency plots for cbare
configuration ...145 Figure 5-44: Experimentally and numerically obtained radiation efficiency plots for
cbare+B+FB+mass+TC configuration ...146 Figure 6-1: Mass layer location study – SWL and DWL configuration ABIL results for
melamine sound packages...155 Figure 6-2: Mass layer location study – SWL and DWL configuration SBIL results for
melamine sound packages...157 Figure 6-3: Mass layer location study – SWL and DWL configuration TBLIL results for
melamine sound packages...159 Figure 6-4: Mass layer density study – SWL and DWL configuration ABIL plots for melamine
sound packages – all results mass normalized ...162 Figure 6-5: Mass layer density study – SWL and DWL configuration SBIL plots for melamine
sound packages – all results mass normalized ...163 Figure 6-6: Mass layer density study – SWL and DWL configuration TBLIL plots for
melamine sound packages – all results mass normalized ...165 Figure 6-7: Mass layer for sound packages (a) FiberS50; (b) FiberS75; (c) FiberS90unconn;
and (d) FiberS100...171 Figure 6-8 : Mass layer comparison using measured ABIL results in SWL configuration – all
results mass normalized ...173 Figure 6-9: Mass layer comparison using measured ABIL results in DWL configuration – all
results mass normalized ...174 Figure 6-10: SBIL plots in SWL configuration – all results mass normalized ...175
xv
Figure A-1: DLF values measured at -40 °C on bare and treated Al ribbed panel ... 181 Figure A-2: Al ribbed panel DLF plots at -40 °C (a) 80% VE1 & 50% VS1, (b) 50% VS1 &
50% VS4, (c) 50% VS4 & 50% VS3, (d) 50% VS3 & 80% VS4, (e) 80% VS4 & 80% VP1, (f) 80% VP1 & 80% VS1 ... 182 Figure A-3: DLF values measured at -30 °C on bare and treated Al ribbed panel ... 183 Figure A-4: Al ribbed panel DLF plots at -30 °C (a) 80% VE1 & 50% VS1, (b) 50% VS1 &
50% VS4, (c) 50% VS4 & 50% VS3, (d) 50% VS3 & 80% VS4, (e) 80% VS4 & 80% VP1, (f) 80% VP1 & 80% VS1 ... 184 Figure A-5: DLF values measured at -20 °C on bare and treated Al ribbed panel ... 185 Figure A-6: DLF values measured on bare Al ribbed panel at -40 °C, -30 °C, -20 °C, -10 °C, 0
°C, and 25 °C... 186 Figure A-7: DLF values measured at temperatures of -40 °C, -30 °C, -20 °C, and -10 °C on Al
ribbed panel treated with 80% VE1... 187 Figure A-8: DLF values measured at temperatures of -40 °C, -30 °C, -20 °C, and -10 °C on Al
ribbed panel treated with 80% VS1 ... 188 Figure A-9: DLF values measured at temperatures of -40 °C, -30 °C, -20 °C, and -10 °C on Al
ribbed panel treated with 50% VS3 ... 189 Figure A-10: Treated Al ribbed panel DLF values plotted against mass of treatment at -40 °C
and at frequencies (a) 125 Hz and (b) 250 Hz... 190 Figure A-11: Treated Al ribbed panel DLF values plotted against mass of treatment at -40 °C
and at frequencies (a) 500 Hz and (b) 1000 Hz... 191 Figure A-12: Treated Al ribbed panel DLF values plotted against mass of treatment at -40 °C
and at 2000 Hz... 192 Figure A-13: DLF values measured on Al ribbed panel treated with 50% and 80% VS1 at
temperatures (a) -40 °C, (b) -30 °C, and (c) -20 °C... 193 Figure A-14: DLF values measured at room temperature on Al ribbed panel treated with 20%,
50%, 80% and 100% VS1... 194 Figure A-15: DLF values measured at room temperature on Al ribbed panel treated with 20%,
50%, and 100% VP1... 195 Figure A-16: DLF values measured at -40 °C on bare and treated carbon composite ribbed
LISTE DES FIGURES xvi
Figure A-17: DLF values measured at -30 °C on bare and treated carbon composite ribbed panel...197 Figure A-18: DLF values measured at -20 °C on bare and treated carbon composite ribbed
panel...198 Figure A-19 DLF values measured at temperatures of -40 °C, -30 °C, -20 °C, and -10 °C on
carbon composite ribbed panel treated with 50% VS3...199 Figure D-20: Experimental SBIL and ABIL comparison for mela200 sound package...207 Figure D-21: Experimental and numerical ABIL comparison for mela200 sound package...208 Figure D-22: Measured ABIL plots for fiberglass sound package configurations...208 Figure D-23: Measured SBIL plots for fiberglass sound package configurations...209 Figure D-24: Comparison of the measured ABIL and SBIL plots for fiber configuration...209 Figure D-25: Comparison of the measured ABIL and SBIL plots for fiber100 configuration ...210 Figure D-26: Comparison of the measured ABIL and SBIL plots for fiber200 configuration ...210 Figure D-27: Comparison of the measured ABIL and SBIL plots for fiberDamp configuration ...211 Figure D-28: Comparison of the measured and numerical ABIL plots for fiber configuration ...211 Figure D-29: Comparison of the measured and numerical ABIL plots for fiber100
configuration ...212 Figure D-30: Comparison of the measured and numerical ABIL plots for fiber200
configuration ...212 Figure D-31: Comparison of the measured and numerical ABIL plots for fiberDamp
configuration ...213 Figure D-32: Comparison of the measured and numerical SBIL plots for fiber configuration ...213 Figure F-33: Mass layer location study – SWL and DWL configuration ABIL plots for
fiberglass sound packages...233 Figure F-34: Mass layer location study – SWL and DWL configuration SBIL plots for
xvii
Figure F-35: Mass layer location study – SWL and DWL configuration TBLIL plots for fiberglass sound packages ... 235 Figure F-36: Mass layer density study – SWL and DWL configuration ABIL plots for
fiberglass sound packages – all results mass normalized... 236 Figure F-37: Mass layer density study – SWL and DWL configuration SBIL plots for
fiberglass sound packages – all results mass normalized... 237 Figure F-38 : Mass layer density study – SWL and DWL configuration TBLIL plots for
fiberglass sound packages – all results mass normalized... 238 Figure F-39: Mass layer size study – SWL and DWL configuration ABIL plots for melamine
sound packages – all results mass normalized ... 239 Figure F-40: Mass layer size study – SWL and DWL configuration SBIL plots for melamine
sound packages – all results mass normalized ... 240 Figure F-41: Mass layer size study – SWL and DWL configuration TBLIL plots for melamine
sound packages – all results mass normalized ... 241 Figure F-42: Mass layer size study – SWL and DWL configuration ABIL plots for fiberglass
sound packages – all results mass normalized ... 242 Figure F-43: Mass layer size study – SWL and DWL configuration SBIL plots for fiberglass
sound packages – all results mass normalized ... 243 Figure F-44: Mass layer size study – SWL and DWL configuration TBLIL plots for fiberglass
LISTE DES TABLEAUX
Table 3-1 : Turbulent boundary layer excitation Corcos TBL model parameters ... 33
Table 3-2: The tests performed ... 39
Table 3-3: Dimensions of the aperture in composite TL measurements... 48
Table 4-1: Tested constraining layer viscoelastic materials ... 60
Table 4-2 : Aluminum panel material properties ... 61
Table 4-3: List of Al ribbed panel damping treatments each with percentage coverage and mass; the tests were performed at temperatures of 20, 10, 0, -10, -20, -30, and -40 °C... 62
Table 4-4: List of carbon composite ribbed panel damping treatments each with percentage coverage and mass; the tests were performed at temperatures of 20, 10, 0, -10, -20, -30, and -40 °C... 62
Table 4-5: List of Al ribbed panel damping treatments each with percentage coverage and mass; the tests were performed at room temperature... 63
Table 4-6: Mass corrected measured AQV IL for VS1... 77
Table 4-7: Mass corrected numerical AQV IL for VS1 ... 96
Table 5-1 : Mechanical properties of the ribbed carbon composite panel... 100
Table 5-2: Mechanical properties of Al panel... 100
Table 5-3: Ribbed Al panel sound packages... 102
Table 5-4: Flat Al panel sound packages... 102
Table 5-5: Carbon composite panel sound packages... 103
Table 5-6: Material properties of Smactane EX... 104
Table 5-7: Al constraining layer material properties... 105
Table 5-8 : Carbon composite constraining layer material properties... 105
Table 5-9 : Material properties of melamine foam and 0.6pcf FG... 106
Table 5-10: Mass corrected average and overall ABIL for ribbed AL panel sound packages148 Table 5-11: Mass corrected average and overall SBIL for ribbed Al panel sound packages. 148 Table 5-12: Mass corrected average and overall ABIL for carbon composite panel sound packages ... 149
Table 6-1: Material properties of skin structure of trim panel... 152
LISTE DES TABLEAUX xx
Table 6-3: The location parametric study sound packages...153 Table 6-4: The mass layer density parametric study sound packages ...161 Table 6-5: The mass layer size parametric study sound packages...167 Table 6-6: Sound package configurations tested as part of parametric study ...170
Chapter 1 Introduction
This thesis is part of a collaborative project between MTI Polyfab (became 3M Thermal & Acoustic Systems on June 11, 2010) and Groupe d’Acoustique de l’Université de Sherbrooke through the Université de Sherbrooke’s “Partnership program for Master and Doctoral studies in the workplace”. The aim of this project is to identify the noise transfer mechanisms from aircraft cabin exterior to interior with a focus in particular on the function and modeling of viscoelastic vibration damping of fuselage skin, and develop possible alternatives to damping. The turbulent boundary layer (TBL) and engine are the two main sources of noise from exterior to the aircraft cabin interior. The TBL noise is caused by the aerodynamic behavior of air flowing around the fuselage skin. The environmental control system (ECS) is also a significant noise source; however, it is generated within the aircraft. The ECS noise and treatment schemes are not investigated as part of this research project.
The two paths that noise is believed to enter the cabin interior, for the purposes of this research from the surrounding air under flight cruise conditions, include direct transmission of sound waves (airborne) and radiation of noise (structure-borne). The transmission of airborne noise occurs through the partition separating the aircraft interior from the exterior. The radiated noise is generated by the excitation of the fuselage skin predominantly due to TBL. TBL excitation of the fuselage skin is believed to cause noise transmission to cabin interior in two ways. First, by exciting the skin, the skin panel radiates noise into the cavity in between the fuselage skin and trim panel and this airborne noise is transmitted to the cabin interior. The second path is structure-borne transmission through the mounts which excites the trim panel and in turn generates radiated noise into the cabin interior.
Noise control can be divided into three methods: active, passive and semi-active. In active method, speakers, actuators, and microprocessors are used to produce out of phase signal to electronically cancel the transmitted noise waves. Passive control involves the use of absorbers, barriers, mufflers, silencers, dampers, etc. Semi-active control involves the use of
Introduction 2
active method to enhance the acoustic properties of passive control methods. Passive noise control is simpler to implement and more cost-effective than active and semi-active and hence its applications are widespread [1]. Active and semi-active noise control is more applicable to helicopters and propeller driven aircrafts where frequency specific noise predominantly occurs. Only passive aircraft acoustic materials are examined in this research project.
Sound packages (passive noise control) made up of porous materials such fiberglass and open-cell foam are typically used on commercial aircraft as acoustic and thermal insulation. Viscoelastic material damping is also often used as part of a sound package. Sound package is installed in the gap between the fuselage skin and trim panel of aircraft. Optimal sound package is one that acoustically performs superior over the audible frequency range of 12 to 20000 Hz with as light a weight as possible. In the industry, the acoustical performance is predominantly based on ABIL (airborne insertion loss). In this report, SBIL (structure insertion loss) and TBLIL (turbulent boundary layer excitation insertion loss) are also used to evaluate the acoustical performance. Two other vibroacoustic indicators: absorption coefficient and radiation efficiency are generally used in support (when describing the physics) of ABIL, SBIL and TBLIL results in this report
Sound transmission into the cabin interior is more important for aircrafts in comparison to vibration levels since the aircraft skin is already highly damped due to its physical make-up which inherently reduces the vibration levels. DLF (damping loss factor) and AQV (average quadratic velocity) experimental and numerical results are used to evaluate the panel vibration levels. DLF is also used when defining panel properties as part of ABIL, SBIL and TBLIL calculations.
Since some panel damping is also achieved with the application of sound absorbing materials such as foam and fiberglass, the efficiency of viscoelastic material damping is questioned. Viscoelastic material damping is argued to be acoustically effective as extra mass while being compared to a layer of impervious limp material (mass layer) as part of this thesis project. The comparison was performed using both metallic and composite panel constructions. The critical frequency is above 10,000 Hz for metallic panels and is at around 3,000 Hz for composite panels. The impact of viscoelastic material damping and mass layer at critical frequency is compared using the composite panel.
3 The aircraft acoustic performance is measured using two acoustic levels. One is an overall measurement and is a summation of A-weighted sound pressure levels (LA) in the audible frequency range of 12 to 20000 Hz. And the other is the speech interference level (SIL) which is an arithmetic average of the sound pressure levels in the octave bands centered at 1000, 2000 and 4000 Hz (500 Hz octave band is also at times included in the average). Accordingly, the comparison of viscoelastic damping material to alternative configurations was primarily based on overall ABIL (airborne insertion loss), SBIL (structure-borne insertion loss) and TBLIL (turbulent boundary layer excitation insertion loss) in the frequency range of 100 to 6300 Hz (experimentally 200 to 6300 Hz) and based on mean ABIL, SBIL and TBLIL in SIL frequency range (1k, 2k and 4k Hz).
Both numerical and experimental analyses are performed to understand the mechanism behind noise transmission through partitions. Numerical work is based on the use of computational tools of finite element method (FEM), statistical energy analysis (SEA) and transfer matrix method (TMM). Numerical analysis is quite often implemented in conjunction with experimental analysis which may include transmission loss tests, vibration data collection and power input and output measurements.
1.1 Aircraft TBL & engine noise sources
There has been a gradual decrease in noise levels of subsonic passenger airplanes largely due to developments in engine design and efficiency over the past 40 years. Today, aircrafts are typically equipped with turbojet or turboprop engines. The turboprop engines produce greater noise than the turbojets. The main noise sources of a modern by-pass turbojet engine are the jet and the fan, while the internal combustion chamber and the turbine stages usually make a smaller contribution to the total noise produced by the engine [2, 3]. Some effective measures have been taken in reducing the propeller noise of turboprop engines such as an increase in the number of blades, a decrease in their relative thickness, a more swept shape and optimal choice of the load distribution over the blade surfaces and the blade geometry that reduce the wave processes in the airflow around the blades [2, 4]. Depending on the aircraft, the turbulent boundary layer (TBL) or the engine becomes the leading noise source. Interior sound levels in multi-engine, propeller-driven aircraft are dominated by the discrete frequency
Introduction 4
components at the blade passage frequency and its harmonics [2]. However, at aircraft speeds above about 200 mph, aerodynamic noise also becomes important [5, 6]. For jet powered aircraft, a significant source of cabin noise in mid and high frequencies is the aerodynamic sound generated by attached or separated turbulent boundary layers [5, 6]. The continuous noise sources dominate the sound field inside the cabin, especially the noise due to the structural vibration of the fuselage side wall caused by the TBL [5].
The boundary layer thickness around the flight deck for most commercial airplanes is about 13 mm and grows to about 30 cm at the back of the plane [1]. It has been observed that the boundary layer noise in the cabin will increase by about 2 dB for every 0.1 Mach increase in airspeed [1]. The noise, however, decreases by the same amount for about every 1500 m increase in altitude [1].
TBL excitation transfers energy to the interior cavity through both the air and structure paths. Vibration damping mechanisms such as energy transfer to joints and energy loss to surroundings can in fact be paths of noise transfer and radiation, respectively. Noise is transmitted to the interior of an aircraft not just by direct transmission of sound waves through the fuselage skin, insulation system and trim panel but also by damping mechanisms at joints and radiation. [7, 8, 9, 10, 11, 12, 13, 14, 15, 16, 17, 18, 19, 20, 21, 22, 23, 24, 25, 26, 27,28, 29, 30, 31, 32, 33]
1.2 Aircraft passive noise control overview
A typical aircraft passive sound insulation structure consists of double wall with sound absorbing materials, viscoelastic damping and depending on the cabin noise level requirements a barrier layer. The two walls are the fuselage skin and interior trim panel. The sound absorbing materials are fixed in between the two walls and the viscoelastic damping is attached (normally using pressure sensitive glue) to the fuselage skin and/or to the trim panel. A section of aircraft insulated with a sound absorbing material next to the fuselage skin is shown in Figure 1-1. A typical sound absorbing material composition is shown in Figure 1-2. The research in characterization and acoustic properties estimation of sound absorbing materials is extensive [7-18]. Similarly, analytical and experimental research with emphasis in vibration damping is extensive [18-33].
5
Figure 1-1: Sound absorbing material installed next to fuselage skin
Figure 1-2: A combination of foam and fiberglass sound absorbing material that is typically used in aircraft insulation
1.3 Objectives
The primary objective is to investigate the acoustic performance of viscoelastic damping material versus equivalent mass as added noise treatments to typical aircraft sidewall structures under diffuse acoustic field and mechanical excitations. The equivalent mass is a layer of impervious screen that is equivalent in weight to viscoelastic damping material. The
Introduction 6
investigation is performed both numerically and experimentally using various acoustical and vibration indicators. Extensive viscoelastic damping material characterization is performed with the aim to determine the effect of temperature and frequency on the performance of viscoelastic damping materials. A parametric study is also performed to determine an optimal equivalent mass layer.
The specific objectives are:
- conduct a literature review on mass versus damping as a noise control mechanism in aircraft sidewalls;
- characterize viscoelastic damping materials;
- devise and conduct acoustic and vibration tests on two representative sidewalls, the first metallic and the second composite;
- conduct experimental tests to compare effects of viscoelastic damping material versus mass on the acoustic and vibration response of the representative sidewall panels; - investigate numerically mass versus damping for a typical single and double sidewall
panels;
- compare testing to modeling;
- conduct a parametric study and suggest an enhanced configuration ; and - test the final configuration and conclude.
1.4 Overview of dissertation
Literature review is in Chapter 2. The characteristics of viscoelastic material damping, the alternatives to viscoelastic material damping, and the features of noise transmission loss through partition are discussed in Chapter 2. The vibroacoustic performance indicators of damping loss factor (DLF), airborne insertion loss (ABIL), structure-borne insertion loss (SBIL), turbulent boundary layer insertion loss (TBLIL), average quadratic velocity (AQV), radiation efficiency and absorption are defined and the experimental methods for measuring
7 DLF, AQV, ABIL, SBIL, and radiation efficiency are described in Chapter 3. The viscoelastic damping material characterization results are presented in Chapter 4. The results and discussion of the experimental and numerical comparison of viscoelastic damping material to equivalent mass are in Chapter 5 along with a parametric study of equivalent mass in Chapter 6.
Chapter 2 Literature review
On commercial aircraft, the acoustic and thermal insulation system is primarily made up of sound absorbing materials. Low density limp fiberglass (typically 0.42 or 0.6 pcf) and open cell foam are used as sound absorbing materials. Open cell foams frequently used in aircraft industry include solimide polyimide and/or melamine foam. Viscoelastic material damping is also utilized (more commonly on business aircraft) as part of aircraft acoustic insulation systems. Constraining layer viscoelastic material damping (CLD) is the predominant method of damping. Both fuselage skin and trim panel can be damped.
Sound absorbing materials are effective at frequencies of octave 1000 Hz and higher mainly in terms of sound absorption. The absorption materials also result in added damping on the fuselage skin and trim panel. Typically the gap between fuselage skin and trim panel is filled with sound absorbing materials. Sound absorbing materials are normally bagged in covering film for moisture protection. Hydro-phobic treatment may also be applied to avoid bagging (e.g. melamine foam).
Viscoelastic material damping is used on aircraft largely for lower frequency (octave 500 Hz and less) noise reduction which in turn results in an overall sound level reduction in aircraft cabin. Viscoelastic material damping is effective at panel resonant frequencies at the first few modes and at the critical frequency and is ineffective at double wall resonance frequency. Fuselage skin and trim panel make up the double wall.
This chapter is divided into three sections. The first section includes a detailed description of viscoelastic material damping. In section 2, possible alternatives to vibration damping are discussed. The characteristics of transmission loss are described in the third section.
Literature review 10
2.1 Viscoelastic material damping
Damping occurs inherently in all materials when the structure deforms during vibration. This structure damping depends on the exact composition and processing of the material. In addition to material inherent damping, damping of a structure can be increased by external means such as attaching layers of high damping material, through joint interfaces, energy loss to surrounding, and friction with mounted equipment and other objects/surfaces. A structure can also be isolated from a vibration source by using isolators. Viscoelastic material damping is added damping to a structure and is primarily effective in reducing vibration levels at resonant frequencies.
Damping is a form of energy dissipation that occurs as a result of internal molecular interactions during material deformation. Vibration is a cyclic deformation. It is theoretically possible that, with a complete knowledge of the molecular structure of materials involved and the use of Quantum Mechanics, one can predict the damping behavior. However, such analysis would require enormous computational resources and is currently not possible for practical structures. Nevertheless, mathematical models have been formulated that yield quantifiable damping characteristics using theorems such as Newton’s laws, Euler-Bernoulli equation of motion, and stress and strain relationships. The drawback is that all available analytical models are strictly for homogeneous, isotropic and geometrically simple structures. For complex structures, damping is predominantly characterized experimentally and at times finite element analysis is also used in conjunction with tests or by itself.
The viscoelastic damping characteristics are directly linked to material composition and processing, including the degree of cross-linking and the type of fillers such as carbon black [1]. The characteristics also vary with temperature and to a lesser degree with frequency. Molecules become disturbed and move from their equilibrium position when a structure is subjected to a load (such as a harmonic load), but over time the molecules reach a state of equilibrium. The time it takes to reach the state of equilibrium depends upon the material composition, temperature and the harmonic excitation frequency [19].
Three different types of models are commonly used for solving structural dynamic problems: physical or spatial, modal space and response based. Physical or spatial models are developed
11 from basic physical characteristics describing the system mass, damping and stiffness typically from a finite element model description. Modal space models are developed from the modal characteristics describing the frequency, damping and mode shape. Response based models are developed from characteristics of the system response typically from frequency response measurements [34].
An elastic material such as a spring retracts to its original position when stretched and released, whereas a viscous fluid such as putty retains its extended shape when pulled [19]. Viscoelastic materials typically exhibit characteristics of both a viscous fluid and an elastic solid. After being stressed, viscoelastic material returns to its original shape, but does it slowly enough to oppose the next cycle of vibration. The degree to which a material behaves either viscously or elastically depends mainly on temperature and rate of loading (frequency). Many polymeric materials (plastics, rubbers, acrylics, silicones, vinyls, adhesives, urethanes, epoxies, etc.) having long-chain molecules exhibit viscoelastic behavior [1]. The dynamic properties (shear modulus, extensional modulus, etc.) of linear viscoelastic materials can be represented by the complex modulus approach. The material properties of viscoelastic materials depend significantly on environmental conditions such as environmental temperature, vibration frequency, pre-load, dynamic load, environmental humidity and so on. Therefore, a good understanding of such effects, both separately and collectively, on the variation of the damping properties is necessary in order to tailor these materials for specific applications [1].
2.1.1 Effects of temperature
The dynamic properties of viscoelastic materials vary strongly with temperature [19]. In Figure 2-1, which was taken from [1], it is shown that there are four distinct regions revealing the variation of storage modulus and damping loss factor. With increasing temperature, glassy region is at the lowest range, where the material has very large storage modulus (dynamic stiffness) but very low damping. The storage modulus in this region changes slowly with increasing temperature, while the damping changes significantly. In the transition region, because of the softening of the material with increasing temperature, the damping increases and the material modulus decreases. The damping usually peaks at or around the glass transition temperature of the material and some polymers can be made to have more than one
Literature review 12
transition region by changing the polymeric structure and composition to take advantage of the peak damping capacity in this region [19]. In the rubbery state both modulus and damping take lower values and vary slowly with temperature. The flow region is typical for a few damping materials such as vitreous enamels and thermoplastics, where the material continues to soften as temperature increases while loss factor reaches very high values [1].
Figure 2-1: Variation of storage modulus and loss factor of a viscoelastic material with increasing temperature from Glassy region to Flow region [1].
2.1.2 Effects of frequency
The effect of frequency is the inverse of the effect of temperature such that increasing frequency affects the dynamic properties as does decreasing temperature. However, the frequency effect is not as pronounced as temperature. It takes several decades of frequency to reflect the same change of the storage modulus and the loss factor as a few degrees of temperatures [20]. The variation of storage modulus and the damping loss factor with increasing frequency can be divided into four different regions just as it was divided with increasing temperature. The storage modulus increases through glassy, transition and rubbery regions as the frequency increases. However, the rate of increase is low in the glassy and rubbery regions, and high in the transition region. The loss factor decreases as frequency
13 increases in the glassy region, reaches its maximum in the transition region, and increases in the rubbery region.
2.1.3 Effects of pre-stress and cyclic strain amplitude
Analytical analysis of a viscoelastic system can only be performed linearly if the cyclic strain amplitudes are very low. The extent of the nonlinear behavior depends upon the type of polymer, especially the molecular structures. For most engineering purposes, except where components are subjected to extremely high strains over considerable periods of time, the linear theory of viscoelasticity is the most practical first step, followed possibly by testing of the system under simulated loading conditions in lieu of nonlinear analysis [19, 20].
2.1.4 Other environmental effects
Environmental factors such as exposure to radiation (e.g. ultraviolet and nuclear), humidity in the atmosphere and hydrocarbon fluids (e.g. fuels and lubricants) can affect the dynamic properties of polymers. Exposure to hydrocarbon fluids may over time progressively and irreversibly damage the molecular structure, and this can in turn change the dynamic properties with respect to temperature, frequency and strain. In the case of radiation, damage may be progressive. In the case of humidity, the process may in some cases be reversible. [19, 20]
2.1.5 Damping treatment design
Viscoelastic materials have traditionally been applied to structures to enhance damping in two different ways: free-layer damping treatment and constrained-layer or sandwich-layer damping treatment. The key in viscoelastic damping design is to recognize that the damping material must be strained as much as possible when the structure is deformed in the vibration mode under investigation [1].
Free-Layer damping (FLD): In Figure 2-2, a portion of a structure with a free-layer is shown. Free layer damping is also referred to as extensional type damping. The damping material is either sprayed on the structure or bonded using a pressure-sensitive adhesive [1]. When the base structure is deflected in bending, the viscoelastic material deforms primarily in extension and compression in planes parallel to the base structure. The degree of damping is limited by thickness and weight
Literature review 14
restrictions. The system loss factor in a free-layer system increases with the thickness, storage modulus, and loss factor of the viscoelastic layer [1].
Figure 2-2: Free layer damping [1]
Constrained-layer damping (CLD): In Figure 2-3, a portion of a structure with constrained-layer damping treatment is shown.This consists of a sandwich of two outer elastic layers with a viscoelastic material as the core.When the base structure undergoes bending vibration, the viscoelastic material is forced to deform in shear because of the upper stiff layer. The constrained-layer damping is more effective than the free-layer design since more energy is consumed and dissipated into heat in the work done by the shearing mode within the viscoelastic layer. Damping tapes consisting of a thin metal foil covered with a viscoelastic adhesive and used on an existing structure is a constrained layer type arrangement. The symmetric
configuration in which the base and the constraining layers have the same thickness and stiffness is by far the most effective design since it maximizes the shear
deformation in the core layer. [1, 20]
Figure 2-3: Constrained layer damping [1]
2.2 Alternative methods to viscoelastic material damping
Aircraft is typically insulated using a combination of damping and low density porous materials. Porous materials such as foam and fiberglass are effective noise attenuators at frequencies higher than 500-1000 Hz depending on the thickness. For low frequency sound energy attenuation, heavy damping is used. Increased mass lowers the resonant frequencies. The issue with damping is that since the dampers are rigid materials, the combination of panel
15 and damper may result in new resonant frequencies which may cause radiated noise. Most research involving porous and viscoelastic damping materials is concerned with materials that are homogeneous and uniform as they are easier to analyze analytically. A composite material that is made up of loosely connected particles of different densities, shapes and stiffness should in theory perform well as noise insulator. In such a structure, particles of different density, shape and stiffness would ideally each have resonant frequencies and vibrate (dissipate energy) at those frequencies in loosely connected medium when excited by acoustic energy. [35, 36, 37]
Distributed mass in porous material has been found to increase transmission loss and act as damper. Sgard et al. [35-37] investigated both numerically and experimentally the significance of heterogeneous blankets in dissipating vibro-acoustic energy. Heterogeneous blankets were porous materials with embedded masses and also porous materials with embedded air cavities. Sgard et al. [35] used an FE method to model the plate and the acoustic domains (gaps and internal cavities). They used the mixed (u, P) formulation of Biot’s poroelasticity equations to model poroelastic patches. Thus, heterogeneous blankets with embedded air cavities were modeled using a mixed (u, P) formulation referred to as “initial formulation” and the blankets with embedded masses were modeled using a mixed (u, P) formulation referred to as “modified formulation” [35].
Sgard et al. [35] calculated two acoustic indicators: the mean square velocity of the panel and a space averaged mean square pressure in the cavity. The experimental system was excited mechanically using a shaker and acoustically using a loudspeaker. Validation of the simulation method was performed by comparing measured and calculated mean square velocity and pressure. Total power dissipated was also calculated as part of the analysis. The major conclusions included: mass inclusions equivalent to 7% of panel weight increased energy dissipation at low frequencies up to 150 Hz and distributed air cavities of up to 20% of porous material did not change the acoustic performance of the porous material. [38, 39, 40]
Furthermore, Kidner et al [38-40] investigated the effect of mass inclusions in poro-elastic layer and found that the insertion loss of standard acoustic blankets can be significantly improved at low frequencies. Esteve [41, 42] showed that optimally damped vibration absorbers and optimally damped Helmholtz resonators reduce sound transmission into payload fairing at low frequencies. [43, 44, 45, 46, 47]
Literature review 16
Idrisi et al. [43-47] also experimentally and analytically investigated the effect of heterogeneous blankets in reducing radiated noise in a double panel system and presented their findings in three companion papers. The heterogeneous blankets were fabricated by embedding masses in a porous material. The porous material in the investigation was Melamine foam. The double panel system was made up of a fuselage skin structure, heterogeneous blanket, air cavity, and a trim panel structure. In the first of the companion papers [43], the authors presented the methods used for modeling the acoustic performance of the double panel system and experimental verification (of the analytical work). The findings from their parametric studies were presented in the second paper [44]. In the third companion paper [45], modeling strategies for devising an optimal heterogeneous blanket were described. The response of the double panel system was numerically obtained using coupling equations. The source and receiving panels and air cavity were modeled using an impedance and mobility method (IMM) [43] and heterogeneous blanket was modeled using a finite element (FE) model. The mathematical model of the double panel system is experimentally validated by comparing the calculated and measured acoustic power (radiated from the system) and spatially averaged square velocities (of source and receiving panels).
Figure 2-4: Double panel system – fuselage (1), heterogeneous blanket (2), air cavity (3), trim panel (4), and interior acoustic field (5) [43].
Idrisi et al. [43] investigated the acoustic response of the double panel system to an impact excitation using a mathematical model with five components. In Figure 2-4, the components of the model are shown. A solution for the double panel system is obtained by equating forces and velocities at the interfaces. IMM was used to couple the components together at discretized locations on the interfaces [43]. At each frequency, for a given component, a
17 mobility matrix was formed describing the relationship between all output velocities and all forces. Major assumptions included the source and receiving panels moving only with transverse motion, continuity of velocity and force on both sides of the plate and flat panels [43]. The objects were coupled using a linear system of equations derived using the continuity of velocity and force equations at all interfaces [43].
A point source excitation was used in the experimental analysis. The experimental and numerical results for the double panel system with and without the heterogeneous blanket were compared. The authors experimentally validated that the analytical model can be used to predict the response of the double panel system. They also concluded that proper tuning of the heterogeneous blanket can result in broadband noise reduction below 500 Hz with added weight less than 10% of the weight of the fuselage skin.
Idrisi et al [44] performed parametric studies to characterize the acoustic performance of embedded masses inside porous materials. The characteristics that were considered include “footprint”, “effective area” and “mass interaction distance”.
Each mass moving due to excitation inside a porous material has a region of influence. This region of influence is identified in [44] as “footprint”. The size of the “footprint” may directly affect the stiffness of the porous media such that the larger the region of influence (footprint), the greater the stiffness becomes increasing the natural frequency of the heterogeneous blanket.
Idrisi et al [44] illustrated that increasing the surface area of the top face of a mass changes the volume of the porous media that the mass interacts, hence the stiffness and consequently the natural frequency of the mass-spring-damper system inside the heterogeneous blanket increases. The concept of “effective area” was introduced and defined as the area whose perimeter is a distance d away from the perimeter of the surface area as shown in Figure 2-5 [44]. Idrisi et al. [44] then demonstrated that this effective area is proportional to the equivalent stiffness of the heterogeneous blanket and is a function of the natural frequency.
Literature review 18
Figure 2-5: Schematic of “effective area” concept [44].
Idrisi et al. [44] also revealed that the resonant frequency of the mass inclusion increases with decreasing the depth as shown in Figure 2-6.
Figure 2-6: Variation of resonant frequency of an 8 g mass in a melamine foam block (35x35x100 mm) as a function of the thickness of foam beneath the mass [44].
Idrisi et al. [45] numerically examined three different heterogeneous blanket design strategies. The first design strategy involved formation and evaluation of heterogeneous blankets with random mass inclusions. As part of the second strategy, heterogeneous blanket design based on the location of the source panel modes was evaluated. Masses were embedded near an anti-node of a targeted mode [45]. The third design strategy involved evaluation of each of all
19 possible heterogeneous blanket configurations. For each configuration, the two mass inclusions were located at different nodes (in FE model).
The authors [45] found that the performance of the heterogeneous blanket based on the design (location of the masses) varied with the best performer attenuating 12.5 dB and the median performer attenuating 2.6 dB in sound radiation in the 0-500 Hz frequency range. They determined that the design based on the source panel modes did not perform as well. They argued that the modes of the source panel are not equally coupled to the receiving panel and hence optimal control of the source panel does not lead to optimal control of the sound radiation. They emphasized that their investigation is at early stages and extensive work in optimizing the system is required.
Without a convincing explanation of the underlying physics, all these investigations indicate that introducing non-uniformities in porous materials enhance acoustic properties. One focus in the current research project is also heterogeneous blankets; however, this research is more extensive in terms of the involved analysis. In addition, the acoustic performance of heterogeneous blankets is compared to the performance of viscoelastic damping materials currently used. [48, 49, 50, 51, 52]
2.3 Noise transmission loss through partition
When a sound wave strikes a partition, some portion of its energy will be reflected, another portion will be absorbed, and the remaining portion will be transmitted through. The amounts of reflection, absorption and transmission are dependent upon the properties of the partition. A partition can be any panel or any combination of panels or panels with sound packages. A sound package may be sound absorbent materials inserted within the gap in between two panels, or material attachments to panels for stiffening and/or damping purposes. There hence is a vast variety of partitions that are available and one single theory cannot adequately describe the sound transmission characteristics. Aircraft fuselage, trim panel, noise treatment materials in between the fuselage and trim panel, and windows all make up the partition that separates the interior of the aircraft from the outside.
Literature review 20
There are a number of analytical models that are used to predict transmission loss. The descriptions and derivations of some of those models can be found in [48-52] with comparisons to experimental data. For the purposes of this project, Transfer matrix Method (TMM), based modeling will be used for transmission loss calculations as additional resource to finite element – boundary element modeling. NOVA [53] is TMM based computational tool and (NOVAFEM [54] is a finite element – boundary element computational tool. They are both used for modeling flat multilayered systems with acoustic materials (porous and viscoelastic) [53, 54]. They are also part of the ESI/NOVA software package developed at Mecanum/GAUS and distributed by ESI-group [55].
Some features of sound transmission through a panel are outlined below [56, 57]:
1. The amount of sound transmission through and/or radiation from a panel is related to the frequency range of the incident noise and vibration source. The stiffness, mass or damping dominates the partition’s response depending on the frequency range. Every partition structure will have natural frequencies and mode shapes. It is revealed that for a simple one-degree of freedom model at frequencies less than the natural frequency, the stiffness dominates, around the natural frequency, the damping dominates, and above the natural frequency, the mass dominates.
2. The response of the partition is depended on whether the excitation is mechanical or acoustical. When a panel is mechanically excited, most of the radiated sound is produced by resonant panel modes irrespective of whether the frequency range of interest is below or above the critical frequency.
3. When a panel is acoustically excited by a diffuse incident sound field, sound transmittance and radiation is very low below the critical frequency; it is generally the mass of the panel that controls the reduction in sound transmission. Above the critical frequency, it is the resonant modes that transmit most of the sound. [56]
21
Figure 2-7: An illustration of a double-leaf panel [12].
Doubling the mass per unit thickness of a single panel only produces a 6 dB increase in transmission loss [56]. Double-leaf panels can produce significantly larger transmission losses and are used when weight restrictions are critical for instance in aircraft applications. Double-leaf panels are comprised of two separate single panels separated by a core section as shown in Figure 2-7. The two panels are generally mechanically connected and some sort of absorption material is normally used within the core section. The two main sound transmission paths through the double-leaf panel are (i) direct transmission via the panel-fluid-panel path, and (ii) structure-borne transmission through the mechanical couplings [56]. The behavior of a typical double-leaf partition is schematically illustrated in Figure 2-8. All the assertions are valid for infinite lateral flat panels.
![Figure 2-1: Variation of storage modulus and loss factor of a viscoelastic material with increasing temperature from Glassy region to Flow region [1]](https://thumb-eu.123doks.com/thumbv2/123doknet/2696367.62891/34.918.114.685.289.594/figure-variation-storage-modulus-viscoelastic-material-increasing-temperature.webp)
![Figure 2-6: Variation of resonant frequency of an 8 g mass in a melamine foam block (35x35x100 mm) as a function of the thickness of foam beneath the mass [44]](https://thumb-eu.123doks.com/thumbv2/123doknet/2696367.62891/40.918.119.565.537.812/figure-variation-resonant-frequency-melamine-function-thickness-beneath.webp)
![Figure 3-6: Illustration of the mounting of the panel in the test window [75]](https://thumb-eu.123doks.com/thumbv2/123doknet/2696367.62891/68.918.107.743.130.460/figure-illustration-mounting-panel-test-window.webp)
![Figure 3-10: Transmission loss measurement data collection instruments used at UFSC for composite panel testing [77]](https://thumb-eu.123doks.com/thumbv2/123doknet/2696367.62891/72.918.105.513.149.668/figure-transmission-measurement-collection-instruments-ufsc-composite-testing.webp)
![Figure 3-14 : Excitation and response points used for radiation efficiency measurements [80] The instrumentation used for measuring the radiation efficiency was:](https://thumb-eu.123doks.com/thumbv2/123doknet/2696367.62891/78.918.113.527.111.556/excitation-radiation-efficiency-measurements-instrumentation-measuring-radiation-efficiency.webp)
![Figure 3-15 : The shaker attached to the carbon composite panel [80] 3.3 Conclusions](https://thumb-eu.123doks.com/thumbv2/123doknet/2696367.62891/79.918.128.558.248.534/figure-shaker-attached-carbon-composite-panel-conclusions.webp)