DIAL • 4, rue d’Enghien • 75010 Paris • Téléphone (33) 01 53 24 14 50 • Fax (33) 01 53 24 14 51 E-mail : [email protected] • Site : www.dial.prd.fr
D
OCUMENT DE
T
RAVAIL
DT/2006-14
Helping Hand? Aid to Failing
States
Lisa CHAUVET
Paul COLLIER
HELPING HAND? AID TO FAILING STATES
1 Lisa ChauvetIRD, DIAL, Paris [email protected]
Paul Collier CSAE, Oxford
[email protected] Document de travail DIAL
Novembre 2006
ABSTRACT
We define ‘failing states’ are those low-income states in which policy and governance is persistently very bad. We develop a theory of reform in these states in which several characteristics of the society might potentially be the binding constraint on change. We then introduce aid, disaggregated into technical assistance and finance, showing how it might affect these constraints. We then test our theory of aid and reform on global data. We estimate hazard functions to establish what enhances the prospects of sustained reform. We find that a proxy for the relaxation of the binding constraints postulated in the theory is highly significant. There is some evidence that both technical capacity in the society and elite interests are particularly important. Early aid has substantial but offsetting effects: technical assistance consolidates incipient reform whereas finance chills it.
Key Words: Fragile States, reforms, foreign aid, technical assistance, hazard model.
RESUME
Les Etats fragiles auxquels nous nous intéressons sont les pays à faible revenu caractérisés par la faiblesse de leurs institutions et de leurs politiques économiques. Le statut d’Etat fragile est très persistant. Nous développons une théorie des réformes, adaptée à ce contexte, dans laquelle plusieurs caractéristiques de la société peuvent potentiellement contraindre les réformes. Nous identifions la manière dont l’aide peut influencer ces différentes contraintes en distinguant l’assistance technique du reste de l’aide. Nous proposons ensuite des tests économétriques de manière à identifier les principales contraintes aux réformes dans les Etats fragiles, et le rôle de l’aide. Ces tests suggèrent que les contraintes de capacité institutionnelle et de préférences de l’élite au pouvoir sont particulièrement importantes dans les Etats fragiles. De plus, en début de réforme, l’assistance technique renforce le processus de réforme tandis que l’aide financière le fragilise.
Mots-clefs : Etats fragiles, réformes, aide publique au développement, assistance technique, modèle de durée.
JEL Code : C41, F35, 050.
1 We would like to thank the participants of seminars at CERDI (Université d’Auvergne, France), CSAE (University of Oxford, UK),
TEAM-ROSES (Université de Paris 1, France). We would also like to thank the participants of the UNU-WIDER Conference on Aid (June 2006). The usual disclaimers apply.
Contents
1. INTRODUCTION ... 4
2. A THEORY OF THE PERSISTENCE OF DYSFUNCTIONAL GOVERNANCE IN FAILING STATES... 4
2.1.The set-up ... 5
2.2.Binding constraints on reform... 5
2.3.Aid and reform ... 7
3. MEASURING TURNAROUND AND CONSTRAINTS ... 8
3.1.The universe of failing states ... 8
3.2.The dependent variable: reform ... 9
3.3.The binding constraints ... 10
3.4.Observable ‘windows of opportunity’ for donor interventions... 11
4. RESULTS ... 11
4.1.Reforms already underway... 12
4.2.Other windows of opportunity ... 13
4.3.Robustness checks ... 14
5. CONCLUSION ... 14
REFERENCES ... 15
APPENDICES ... 23
List of tables
Table 1 : Failing States and Turnarounds ... 17Table 2 : Completing Turnarounds: a Preliminary Analysis... 18
Table 3 : Completing Turnarounds when Binding Constraints are Relaxed ... 19
Table 4 : Completing Turnarounds when Constraints Change ... 20
Table 5 : Completing Turnarounds: Are Constraints Encountered?... 21
Table 6 : Generalizing the Windows of Opportunity ... 22
Table 7 : Robustness checks on dependent variables: thresholds, ICRG and death of leaders... 22
List of Appendices
Appendix 1 : Data and variables ... 231.
INTRODUCTIONThis paper investigates whether aid can assist ‘failing’ states. The issue is important both because global poverty is shrinking towards a hard core of such states, and because of international security concerns about safe havens for disease, crime and terrorism. By ‘failing state’ we mean countries that have both very low per capita income and persistently poor governance and policies. Ideally, aid might both directly raise income and also improve governance and policies. The former has been investigated through an extensive literature on the relationship between aid and growth. To the extent
that governance and policies can be taken as given, aid seems likely to be least effective in raising
growth in the conditions that define failing states (Burnside and Dollar, 2000). The key issue is thus the latter route: can aid sufficiently improve governance and policies that the state ceases to fail? The literature on this topic has focused partly on donor conditionality and partly on corruption, both reaching pessimistic conclusions. Conditionality, or the offer of aid in return for reform, has both a substitution effect and an income effect. Sachs (1994) focuses on the substitution effect: aid increases the pay-off to reform by reducing the costs to losers. Rodrik (1996) focuses on the income effect: aid reduces the need for reform. Dollar and Svensson (2000) investigate the effect empirically and do not find a significant causal relationship from the design of aid programs onto the reform of governance and policy. This result is supported by a large case study literature, notably Devarajan et al. (eds), 2001, which examined ten reform episodes in a common framework and concluded that aid was not effective at buying reform. The literature on aid and corruption is contradictory. Knack (2001) finds that aid significantly worsens corruption whereas Tavares (2003) finds that it significantly reduces corruption.
Our study differs from these literatures in three key respects. First, we ground our analysis in an explicit theory of why poor governance and policies might be persistent, deriving a comprehensive range of possible binding constraints. Second, we develop new empirical proxies for these constraints. As part of this we disaggregate aid into technical assistance and finance which we argue can be expected to have quite different effects. Third, we confine our analysis to those states at the bottom end of the spectrum of governance and policy: arguably, in this range the constraints upon reform, and hence the effects of aid, are distinctive. In particular, while the possible incentive effect of financial aid has received much attention, the possibility that in the weakest environments technical assistance might relax capacity constraints has gone unexplored.
In Section 2 we set out a theory of the constraints upon reform. In Section 3 we develop empirical proxies for these constraints. In Section 4 we present results of hazard function analysis of the persistence of poor governance and policies in failing states, including a wide range of robustness checks. Section 5 concludes with a discussion of possible implications for international policy.
2.
A THEORY OF THE PERSISTENCE OF DYSFUNCTIONAL GOVERNANCE INFAILING STATES
The states on which we focus remain very poor over long periods because of governance and policies that are highly dysfunctional for economic performance. We define reform in the context of a failing state as a change which would raise the utility of the society as a whole. While the reform may not necessarily benefit every member of the society, it is Pareto-superior to the status quo. The governments of failing states are thus, by definition, forgoing an apparent opportunity to benefit their societies. The question we address is why such dysfunctional governance persists. In this section we set out a simple theory which generates a range of possible binding constraints upon reform. A key step in our subsequent empirical analysis will be to draw inferences from statistical results that are necessarily indirect evidence of what constrains reform. To ensure that inferences are valid it is therefore necessary to specify an explicit model of behavior and to derive a complete account of the inferences that can be made from the model. For this we use the predicate calculus and hence the notation of formal logic2.
2 Our framework differs from that of Alesina and Drazen (1991). In their “war of attrition” model , the delay in stabilizing is the result of a
2.1.
The set-upWe allow societies to differ in four dimensions. First, the interests of the elite may or may not be coincident with those of the rest of society. Second, those with the power of decision may or may not understand how their own economic interest is best served by government choices. Third, the wishes of the elite may or may not prevail in a struggle with the rest of the society depending upon the structure of power. Fourth, the civil service may or may not have the technical and organizational capacity to plan and implement reform. We take these in turn.
Consider the interests of different groups within the society. We distinguish between an elite, e, and the wider society, s. The interests of the elite may or may not coincide with the interests of the society. Let E denote the state of the world in which elite interests are sufficiently coincident with those of the society that it also benefits from reform, and –E denote the alternative in which elite interests are divergent so that it prefers the status quo.
Were we to adopt the assumptions of rational choice theory, policy preferences would follow directly from interests. However, since we are seeking to explain episodes in which governance and policy are grossly dysfunctional for the society it is necessary to allow for the possibility of mistakes. Agents may be so badly informed that they do not recognize strategies that would best serve their interests. Hence, we consider two states of knowledge. Let Ki (i = e, s) denote the state in which group i knows its true interest, with –Ki denoting the situation in which the group is sufficiently badly informed to
mistake its true interest.
The society has a decision rule that maps from the preferences of the elite and the wider society into government choices. The decision rule describes the political system. In all political systems let coincident preferences between the elite and society map directly into government choices. Where preferences of the elite diverge from those of the wider society, which preference prevails depends upon the political system. Let D denote the state in which the preference of the wider society prevails, and –D denote the state in which the preference of the elite prevails.
Even where a government chooses to reform, it requires the civil service to implement its decisions. Although a few reforms can be done by the stroke of a ministerial pen, most require a functioning organization to make them effective. In some failing states the civil service has decayed so radically that it does not have the capacity to implement such changes. Let C denote the state of the world in which the civil service has the capacity to implement reform should the government choose this option, and –C denote the alternative state in which the civil service lacks the capacity to implement reform.
2.2.
Binding constraints on reformWe now derive the complete conditions under which reform, R, will occur in this society. First, assume that the civil service has the necessary capacity for implementation and that elite interests are coincident with those of the wider society. Then, under the following conditions reform will occur: (C & E & D & Ks) v (C& E & –D & Ke) → R. (1)
If elite interests are not coincident, the conditions for reform are:
(C& –E & D & Ks) v (C & –E & –D & –Ke ) → R. (2)
Hence, the full statement of the conditions for reform is:
{[(D & Ks) v (–D & E & Ke) v (–D & –E & –Ke )] & C} → R. (3)
From the above formula the circumstances in which reform will not occur follow by the rule of modus
tollens:
For our subsequent empirical analysis it is useful to establish the conditions in which a single constraint is binding, so that its relaxation will produce reform. Any one of eight states of the world described on the RHS of (4) can be the binding constraint. Working left to right across (4), we first derive the conditions under which the lack of democracy is the binding constraint.
For –D to be a binding constraint implies that D is both necessary and sufficient for R. As a statement in logic these two conditions can be represented through a straightforward decomposition:
(D ↔ R) ↔ (–D → –R) & (D → R). (5)
The circumstances in which D is a necessary condition for R follow from (4):
(–D → –R) ↔ –[(E & Ke) v (–E & –Ke )]. (6)
The circumstances in which D is a sufficient condition for R follow from (3):
(D → R) ↔ Ks& C. (7)
Hence, from (5), (6) and (7), the conditions for the lack of democracy to be a binding constraint are: (D ↔ R) ↔ [Ks & {(–E & Ke) v (E & –Ke)} & C]. (8)
Using similar transformations, the formula for binding society-wide knowledge is:
(Ks ↔ R) ↔ (D & C). (9)
While democracy can enable reform it can also block it. The formula for when democracy is the binding constraint is:
(–D ↔ R) ↔ [–Ks & {(E & Ke) v (–E & –Ke)} & C]. (10)
The formula of non-coincident elite interests as binding is:
(E ↔ R) ↔ (–D & Ke & C). (11)
The formula for a when the failure of the elite to understand its own true interest is binding is:
(Ke ↔ R) ↔ (–D & E & C). (12)
Because the effect of elite interests depends upon the state of elite understanding, this creates two further, somewhat paradoxical possibilities for binding constraints, one genuine the other spurious. The genuine, though paradoxical, possibility is that it is because the elite understand their true interest that reform cannot occur. Reform becomes feasible if the elite cease to understand their own true interest:
(–Ke ↔ R) ↔ (–E & –D & C). (13)
The spurious paradox is that it appears as though a switch from coincident to non-coincident elite interests can actually assist reform in the circumstances in which the elite mistake their true interest. That is, there is the logical possibility that coincident elite interests are the binding constraint:
(–E ↔ R) ↔ (–D & –Ke & C). (14)
This, however, can be dismissed as spurious. This is because we have defined –Ke not as a
fundamental state of elite knowledge, but rather as a state of elite knowledge relative to elite interests. For (14) to hold, so that a switch from E to –E would be necessary and sufficient to trigger reform, there would need to be a simultaneous switch in the fundamental state of elite knowledge from a belief that reform was detrimental to its interests, to a belief that reform was advantageous. Since this switch
in knowledge would be coincident with a switch in its true interest in precisely the opposite direction, it can be dismissed as a spurious consequence of the way in which we have defined elite knowledge. Finally, the formula for a binding lack of capacity is:
(C ↔ R) ↔ [(D & Ks) v (–D & E & Ke) v (–D & –E & –Ke )]. (15)
The conditions (8) through (13), and (15), are an exhaustive statement of the possibilities for individually binding constraints upon reform. No single constraint need be binding: reform may be prevented because more than one necessary condition is not met at the same time. In this case, even if one of these constraints is relaxed, nothing changes: what is binding is the combination of constraints. Even with the present simple structure there are a very large number of possible combinations of constraints that are collectively binding under certain conditions. These can readily be derived from (4) by further applications of the basic rules of the predicate calculus, but they are not needed for our present enquiry.
2.3.
Aid and reformFor aid to be necessary and sufficient for reform it must break a binding constraint. How might the two modalities of aid, technical assistance and finance, change the constraints?
Aid as technical assistance has a straightforward interpretation: it augments the capacity of the public sector. At the very top end of technical assistance it is possible that its provision also alters elite knowledge: the eyes of presidents are opened by the advice of visiting technocrats. Certainly, visiting technocrats would like to believe so. However, the supply of such advice is only a miniscule component of technical assistance, which is itself a large flow, around one quarter of all aid. Overwhelmingly, technical assistance both directly augments the skilled labor force in the public sector and builds the capacity of locally-hired public employees to function. Hence, we will interpret technical assistance as augmenting capacity.
Aid as finance affects interests. The intention of donor conditionality is to make interests more coincident with those of the society by giving the elite a reward conditional upon its acceptance of reform (Adam and O’Connell, 1999). Such a use of aid encounters severe problems of time-consistency (Svensson, 2000): donors threats lack credibility. Even without conditionality, financial aid can have incentive effects: for example, the pay-off to reform may be dependant upon the scale of resources available for investment. However, any effect of finance on interests is a priori ambiguous. If the lack of reform is jeopardizing the revenue base from which the elite are benefiting, it may embark upon reform from necessity. In this case windfall finance from aid would weaken the interest of the elite in reform. Depending upon how it is used, aid as finance may also augment capacity and knowledge. However, a dollar of technical assistance can reasonably be expected to have a larger effect on capacity than a dollar of finance, and any knowledge-enhancing effect via the finance of education will accrue only in the long term.
Hence, over the short and medium term, it is reasonable to regard technical assistance as augmenting capacity and so potentially switching –C to C, and financial aid as affecting interests, potentially switching –E to E as donors intend, or inadvertently, from E to –E. Whether any of these changes matter for reform depends upon the other constraints. Thus, the conditions under which capacity-transforming technical assistance would be decisive are given by (15), while those in which a transformation of elite interests would be decisive are given by (11).
3.
MEASURING TURNAROUND AND CONSTRAINTSWe now turn to empirical analysis. We discuss in turn the choice of the sample of countries, the specification of the dependent variable, and the proxies chosen for the explanatory variables.
3.1.
The universe of failing statesOur universe is ‘failing states’ and this evidently requires definition. The concept covers states that have low per capita income, and poor governance and economic policies. We confine the concept of a ‘failing state’ to countries that have been classified as low income countries for at least one year by the World Bank (World Development Reports, 1977-2002).
Clearly, the more difficult task is to arrive at a credible categorization of poor governance and policy. Since such judgments are notoriously subjective, to be useful the concept should not reflect cases where the government is merely in breach of some contested economic orthodoxy, but rather where conditions are so bad as to be widely accepted as dysfunctional for the growth process. Such a classification evidently rests on judgment, including an explicit or implicit weighting of many underlying variables. We use two completely distinct international ratings. The first is the Country Policy and Institutional Assessment (CPIA) of the World Bank. This is an explicit weighting system for twenty different aspects of governance, institutions and economic policy which has been conducted by World Bank economists for each country annually since 1977. At the foundation of the process is expert knowledge by staff dedicated to working on a particular country for several years, but the process also includes a serious managerial effort to maintain comparability between countries and regions. Nevertheless, the CPIA is subject to a number of limitations. It is inevitably subject to whatever happens to be prevailing World Bank orthodoxies. This is probably less of a problem in ‘failing states’ than in emerging market economies: there is probably a much broader consensus among economists that countries such as Angola and DRC have had dysfunctional governance and policies, than that the choices of the government of Brazil have been erroneous. A further problem with the CPIA is that until 2006 it has not been public information and so subject to the normal discipline of open debate. The lack of disclosure was a policy of the Board of the World Bank, maintained in order to prevent the possibility that governments would attempt to negotiate a more favorable rating. For our purposes non-disclosure has a number of advantages. Not only is the rating not an outcome of negotiation, but since it is not known by other donors or by investors it cannot directly affect their decisions. Our second rating of governance and policies is the International Country Risk Guide (ICRG). This is a commercial rating service and so its continued financial viability can be presumed to reflect the fact that purchasers, largely corporations, regard it as containing useful information. Again, because the CPIA is genuinely confidential, the ICRG cannot be contaminated by it. Like the CPIA it is based on an explicit weighting system of multiple variables. It is available since 1984. Because of the longer time series for the CPIA we use it for our full range of results and conduct robustness checks using the ICRG for the core results.
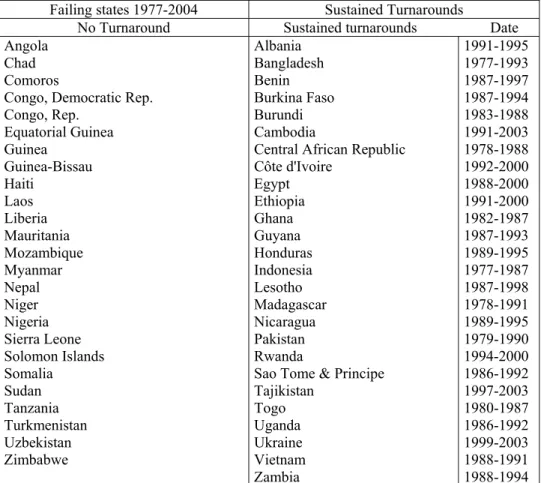
Within the group of low-income countries we define those which are ‘failing’ as having a rating below some threshold. For the CPIA, which is an ordinal index on the range 1-6, we take 2.5 as the threshold. Since our focus is going to be on reform, we wish to exclude cases in which the CPIA merely crashes below 2.5 for a brief period and rebounds back. Arguably such a rebound is much easier than reform from a persistent period of dysfunctional governance and policies. In effect, we wish to proxy the notion that the initial dysfunctional state is an equilibrium. We therefore require that the CPIA be below 2.5 for four consecutive years3. The resulting list of fragile states is shown in Table 1. We then
need an equivalent threshold for the ordinal index of the ICRG. We first create the set of all country-year observations that meet the income criterion for being a failing state and also have data for both the CPIA and the ICRG. We then calculate the proportion of these observations that fall below the 2.5 threshold of the CPIA4. We then find that point on the ICRG rating that generates the same
proportion of observations that are below it on the ICRG rating. This point then becomes the
3 If the CPIA was below 2.5 in the initially observed year of 1977 we assume that it had been below 2.5 for the previous three years. 4 This proportion is 47.79%.
equivalent threshold using the ICRG rating5. Evidently, with this procedure the actual country-year
observations that are selected as ‘failing’ states need not be coincident with those using the CPIA threshold: selection will reflect the judgment of the ICRG raters as opposed to the World Bank raters.
3.2.
The dependent variable: reformWe next need to develop an empirical proxy for the concept reform. Because the underlying CPIA and ICRG indices are ordinal, the most defensible definition of reform is if the country passes from being beneath a low threshold to being above a higher threshold. For the CPIA we take as our core definition of substantial reform a passage from below the threshold of 2.5 to above the threshold of 3.5. In robustness checks, we then investigate a variant by using thresholds from below 2.5 to above 3.0. For the ICRG we investigate an equivalent improvement to that from below 2.5 on the CPIA to above 3.0 using the same procedure as described above. That is, for the common population of observations we calculate the percentage of observations that lie below 3.0 on the CPIA, and find the point on the ICRG scale at which the same proportion occurs6.
However, momentary improvements, however large, are evidently not sustained turnarounds. We therefore need criteria for sustainability. It may seem obvious that the criterion for sustainability is simply that the reform should have persisted to the present. However, this would be a poor criterion. To quote a famous African saying, ‘no condition is permanent’. Taking a specific example, Indonesia had a dramatic turnaround from the late 1960s, at which time it was a classic failing state, to become a star performer of the 1980s. Yet, during the late 1990s it suffered a collapse along with much of East Asia. It seems to us unreasonable to see this crisis of the late 1990s as being the result of failures in the design of the turnaround. It is surely more reasonable to think of the turnaround as having been successful in producing sustained improvement, with the crisis of the late 1990s being attributable to some intervening event or process subsequent to the turnaround. By ‘unsustained’, we wish to capture only those turnarounds where the subsequent relapse was sufficiently close to the turnaround that the reasons for it could sensibly be attributed in large part to weaknesses in the turnaround itself. We therefore deem a turnaround to have been sustained if the CPIA remains above 3.0 for at least two years after the turnaround is achieved. A further reason for setting such a limit to the requirement of sustainability is that otherwise relatively recent turnarounds look much more successful than earlier turnarounds which have simply had more time to be reversed.
In Section 2 we treated the dependent variable, reform, as dichotomous. However, the indices we are using to measure reform are ordinal and this provides some scope for further insight into binding constraints. We consider two sizes of reform: ‘incipient’ and ‘substantial’. To achieve even an incipient reform a previously binding constraint must have relaxed. We therefore investigate what happens subsequently: does an incipient reform continue, eventually achieving the status of ‘substantial’, and what determines whether this occurs? Potentially, this enables us to make inferences as to the sequence in which constraints typically become binding. For example, it may be that elite interests are normally the binding restraint upon reform, but that where these are relaxed for whatever reason so that an incipient reform occurs, capacity becomes the binding constraint.
While in a strict sense absolute changes in ordinal indices have no meaning, subject to the condition that a reform crosses these two thresholds it is reasonable to distinguish between ‘incipient’ and ‘substantial’ changes in the score. We therefore supplement the threshold approach described above with information on absolute change. We define a substantial reform as one in which the CPIA not only increases from below 2.5 and passes above 3.0 but also improves by at least 1.5. We define an incipient reform as one in which from the low-point of being a failing state the CPIA improves by at least 0.5. We use these definitions to investigate what might enable those failing states that experience incipient reform to continue to substantial reform. The countries which had a sustained turnaround according to this definition are presented in Table 1.
5 The corresponding threshold for ICRG is 47.73 (on a scale 0-100).
3.3.
The binding constraintsWe next develop proxies for the binding constraints.
First, consider proxies for elite knowledge. We need proxies for a change in the state of the world from –Ke to Ke. One obvious proxy for a change in elite knowledge is a change in the leadership.
While a new leader may be a mere clone of his predecessor, most likely he is from a different generation or at least has a different set of ideas. We use a data set on new leaders from Beinen and van de Walle (1991) updated by the State Failure Taskforce (2003) (see Appendix 1 for detail definition of the data). A second potential proxy for a change in elite knowledge is the collapse of the Soviet Union. This provided a pulse of new global knowledge about the viability of different economic models. Many leaders of failing states had been attracted by the Soviet model and so this shock is potentially influential.
Next consider proxies for elite interests. Again, we need proxies for the switch from –E to E, with the switch in the alternative direction not being dismissed. Evidently, a change in the leadership may create or reflect a change in elite interests. A further proxy for a change in elite interests is during the period of peace following the end of a civil war. Commonly, a peace will involve some reconfiguration of power with different interests represented. A further indicator of a change in elite interests is when the pay-off to reform changes relative to the pay-off to the status quo. One circumstance in which this may occur is if there is a large deterioration in export prices. Such a deterioration may make it impossible to maintain the living standards of the elite except by implementing reform. Although reform is otherwise unattractive to the elite it becomes preferable to a decline in living standards. Conversely, a large favorable change produces a windfall which may make it less necessary to reform. We confine our analysis of the effect of such shocks to large changes, namely those in the 2.5% tails of the frequency distribution. Our data are derived from detailed weighted indices of primary commodity export prices and are taken from Collier and Dehn (2001). As discussed in Section 2, a further potential alteration in elite interests is generated by aid. In the subsequent analysis we investigate each of these proxies. However, the one we adopt as our preferred proxy for E versus –E is the importance of natural resource rents to the economy. Such rents increase the incentive for those in power to redistribute to themselves rather than pursue the national interest. We use a new measure of resource rents as a share of GDP from Collier and Hoeffler (2005).
Next consider proxies for society-wide knowledge. We need proxies for the switch from –Ks to Ks. A
possible indicator that is available for many countries is the degree of education of the population. Other measures of society-wide attitudes are now available, for example through the World Values Survey and Afrobarometer. These probably provide more pertinent proxies, but they do not cover enough failing states to yield a usable sample.
Next consider proxies for the political system. Recall that a switch in either direction between D and – D can potentially enable reform. The obvious proxy for such a switch is the Polity IV scale of democracy versus autocracy. This measure, which is standard in the political science literature, is ordinal and so cannot be used as a continuous variable. However, the information can be transformed into discrete categories which are represented by dummy variables7.
Next, consider the change in the capacity of the civil service to implement reform from –C to C. One proxy for such a change is the supply of donor technical assistance to the government. This should be quite a good proxy since that is precisely what donor technical assistance is designed to do, and on average it is a substantial flow of resources, typically around a quarter of all aid.
7 Robustness checks are provided using the Polity indicator (from -10 to 10) and a semi-democracy dummy (from -5 to 5) of Polity IV, as
3.4.
Observable ‘windows of opportunity’ for donor interventionsOur ultimate concern is the potential for donor intervention. At the extremes aid of one type or other might always or never have a significant effect upon the prospects of a substantial turnaround. However, a more likely scenario is that there are some situations in which some types of aid assist reform and others in which they retard reform. To be useful for donors such situations must be observable at the time. We are therefore interested in observable signals of windows of opportunity for donors. In addition to ‘incipient turnarounds’ we investigate two other situations in which elite interests or knowledge are likely to have changed, new leaders and post-conflict situations. We therefore investigate the effect of donor interventions timed so as to be triggered by these windows for each of them. We use a data set on new leaders from Bienen and van de Walle (1991) updated by the State Failure Taskforce (2003). Because a change of leader may be endogenous to other factors that make reform more or less propitious, in a variant we confine the analysis to cases in which the previous leader died a natural death while in office (Jones and Oken, 2005). We date post-conflict situations using the data of Collier and Hoeffler (2004).
The data on donor interventions are surprisingly poor considering that they constitute components of public spending by advanced societies. The Development Assistance Committee of the OECD compiles annual data that disaggregates aid disbursements into financial transfers and technical assistance. The financial transfers may be either through projects or budget support, but historically have mainly been through projects. We should note that even at this high level of aggregation the data are of poor quality.
All aid is given purposively and this creates potentially grave problems for sorting out its effects. In our context, aid is likely to be provided disproportionately to the most promising incipient turnarounds, and the most promising new leaders. If we fail to make allowance for this we are liable to misinterpret the direction of causality. Aid will appear to be causing successful turnarounds, when actually it is the high probability of success that is causing the aid to flow. It is possible to correct for this interdependence by finding variations in aid flows, both between countries and over time, that are not related to the conditions in the recipient country and so cannot reflect differential degrees of ‘promise’. For example, Côte d’Ivoire receives much of its aid from France, whereas Ethiopia receives much of its aid from Italy. Thus, when the French aid budget rises, and the Italian aid budget declines, Côte d’Ivoire is likely to receive an increase in its aid inflow relative to Ethiopia that is unrelated to circumstances within either country. We focus on the five largest bilateral donors and estimate such variations in aid, the approach now being standard in the economics literature. The instruments used for aid and technical assistance are therefore the total aid budgets of the five largest donors weighted by geographical and cultural distance variables.8 One further advantage of this approach is that it
excludes aid from the World Bank. Aid from the World Bank is related, albeit with a lag, to the CPIA, and so is intrinsically tied up with our definition of success. Fortunately for our purposes, over the entire period of our analysis the CPIA was confidential and so could not have influenced donor behavior. Different donors also give substantially different ratios of financial aid relative to technical assistance. Hence, we are able to arrive at estimates of differences in technical assistance and financial aid that are unrelated to differences in the degree of promise between incipient turnarounds. If these differences in aid are significantly related to different rates of success then the association can reasonably be interpreted as a causal one from aid onto success.
4.
RESULTSWe investigate what determines whether an incipient reform continues to completion. Given our analysis of the constraints upon reform this has one powerful advantage. Societies that suffer from persistently poor policies can be assumed to be facing some binding constraint. However, it is evident that a very large combination of possible constraints may account for this persistence. In particular, there may well be multiple constraints so that each can be relaxed individually without a response. In contrast, by focusing upon the period following an incipient reform, we have some reason to believe
that whatever the constraints were upon reform, some change has already occurred that has broken them. Hence, unless the society encounters some new constraint, reform will continue to completion. This is attractive for us since if reform does get blocked it is likely to be due to a single binding constraint. There is thus a better prospect of finding coherent empirical results that relate constraints to the pace of reform.
4.1.
Reforms already underwayOur analysis of turnarounds that are already underway is by means of hazard functions. We take as our sample the failing states that embarked upon ‘incipient turnarounds’, defined as having at least a 0.5 improvement in the CPIA. We then attempt to explain which of these incipient turnarounds matured into a sustained turnaround. For this, the CPIA must cross the two thresholds 2.5 and 3.5, and be sustained for at least two years. We use hazard functions with a Weibull distribution to model our data. The Weibull model is fitted in the proportional hazard metric, which implies that an explanatory variable with a positive coefficient increases the hazard that the process will end – i.e. decreases the time until a turnaround becomes sustained. We use a four-year periodization. Thus, our first observation is the first four years following an incipient turnaround – that is, the first four years after the CPIA has crossed the threshold of a 0.5 point improvement. The second observation is the second four years after the threshold has been crossed and so forth.
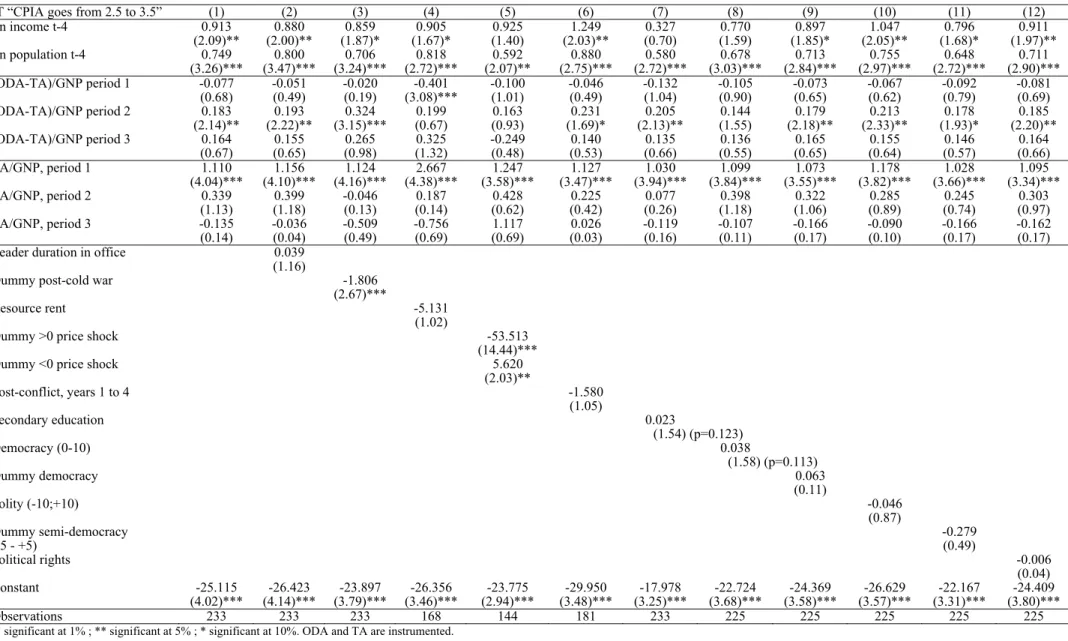
In Table 2 we present a preliminary analysis in which a baseline that includes income per capita, population, technical assistance and financial aid, with both types of aid instrumented, is varied by the addition of a range of possible explanatory variables. These variables do not explicitly proxy the variables in Section 2, this being developed in the subsequent tables. The Table nevertheless complements our subsequent analysis because the variables are continuous, whereas in the subsequent analysis we collapse them into the dichotomous variable characterization of Section 2. Aid and technical assistance are introduced for the first three sub-periods (12 first years) separately. These preliminary results reveal a consistent pattern across the twelve regressions. Societies that are larger and have higher incomes find reform easier. The ability of a society to rethink from persistent failure may, for example, be enhanced by having a larger ‘middle class’. Turning to aid, in the first four years following the incipient reform, technical assistance is positive and significant, whereas financial aid is negative but not significant (except in the fourth regression). The positive effect of technical assistance suggests that as reform progresses it tends to encounter capacity constraints which technical assistance alleviates. This is plausible: even if the civil service is deeply flawed, if a government chooses to reform there are initially things that it can do that require virtually no implementation capacity. As reforms progress they become more demanding of civil service competence, for example being dependent upon the ability to spend public money to some effect. The other notable result is the effect of export price shocks. Favorable export price shocks significantly chill reform, whereas unfavorable shocks significantly encourage reform.
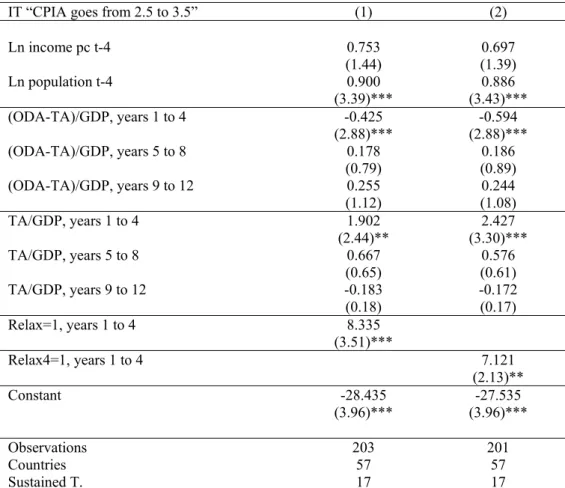
In Table 3 we present our key results which test the theory developed in Section 2, namely that reform will occur if whatever happens to be the binding constraint is relaxed. We define a dummy variable,
Relax, which takes the value of unity if two conditions are both met. One condition is that at the start
of the period under consideration constraint x should be binding, and the other is that during the period
x should be relaxed. For example, for –Ks to be a binding constraint at the start of the period the RHS
conditions of equation (9) must be met, while for the constraint to be relaxed during the period there must be a switch from –Ks to Ks. If these conditions both hold then Relax is set at unity. Similarly, Relax is set at unity whenever the respective two conditions are met for all the other potential
constraints. Relax is constructed for the first four-year period of incipient reform. Evidently, according to the theory reform has not occurred because of a binding constraint, and if this is relaxed in the first period it must trigger reform. If the relaxation were delayed until later periods the effect on the overall prospects of reform would be ambiguous. For example, the relaxation of a binding constraint only in the tenth year following an incipient reform would imply that for the first nine years progress will have been blocked, so that the ‘hazard’ of successful completion of reform will have been reduced for all these years. As a variant we also construct Relax4, defined in the same way except that constraint x must now have been binding in the four years prior to first four years of incipient reform. Because of
our focus on aid we wish to retain technical assistance as a continuously-measured explanatory variable, and since this is our proxy for capacity we do not double-count by including it in Relax. Given the necessarily approximate way in which we have measured constraints, Relax constitutes quite a severe test of the theory. Nevertheless, both Relax and Relax4 are positive and highly significant: the early relaxation of a binding constraint increases the chances of reform. The introduction of Relax also considerably improves the precision of the effects of the two aid variables. During the first period both the positive effect of technical assistance and the negative effect of financial aid are now significant at one per cent. The reform-chilling effect of early financial aid is consistent with the chilling effect of a favorable export price shock, and with the reform-enhancing effect of an adverse price shock, both found in Table 2. In terms of the theory of Section 2 all three results can be interpreted as switching elite interests: reform starts when the elite is desperate, ceases if there is exogenous relief, and is accelerated if there is an exogenous deterioration.
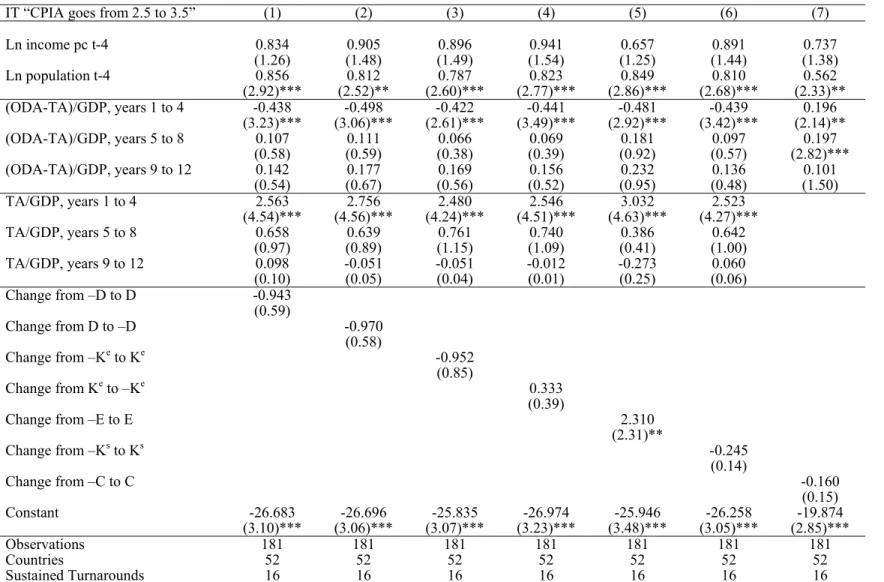
In Table 4 and 5, we disaggregate the constraints. We do not have enough observations to create a
Relax variable for each of the potential binding constraints. Thus we proceed in two stages. In Table 4
we disaggregate according to changes in constraints. We construct dummy variables for each of the potential binding constraints if there is a switch from one state to the other (for example, from –Ks to
Ks). At this stage we do not condition them on the status of other possible constraints. Only one of
these changes is significant: if elite interests switch from being divergent to coincident, this improves the chances of the reform being completed. Other results are essentially unchanged.
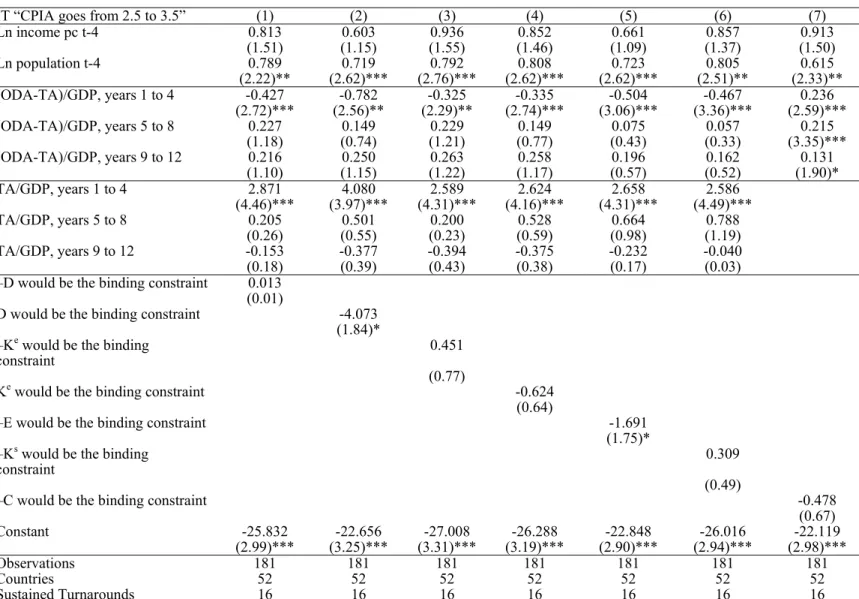
In Table 5 the binding constraints are introduced as dummy variables which are equal to unity when the RHS conditions of equations (8)-(13) are met. Thus, for example, the dummy variable for –Ks
takes the value of unity when the right-hand side conditions described in (9) apply, so that there is some expectation that the lack of society-wide knowledge would be a binding constraint upon reform. Evidently, the difference in the approach is that Table 5 is largely driven by cross-sectional differences between countries, whereas Table 4 focuses exclusively upon intra-country change. Of the six possible constraints, only two are significant: situations in which the interests of the elite are divergent and situations in which democracy is binding. Both signs are negative: both where elite interests are divergent and where elite interests are unimportant the progress of reform is significantly impeded. Reform appears to be most likely where it serves the interests of a powerful elite. Note that this is also consistent with the negative effect of financial aid, which is now highly significant in the first four years of the reform. The results from Tables 4 and 5 both suggest that elite interests matter.
Throughout our results the hazard of reform is rising with time (p > 1, p being the shape parameter of the Weibull function). This is consistent with our hypothesis in section 2 that as reforms proceed the balance of power gradually shifts towards natural reformers and away from reluctant reformers. It also provides some additional rational for donor interventions to maintain reform in its early years.
4.2.
Other windows of opportunityOnce turnarounds are already underway donors have clear evidence that binding constraints are likely already to have been relaxed. However, they are not the only situations in which donors have good reason to expect that prospects for reform have improved. We now investigate two other situations: where there has just been a change in leadership, and where a civil war has just ended. In both there is some reason to expect that the elite may have changed sufficiently for interests to be more coincident, and we have seen that this looks to be the most serious of the possible constraints.
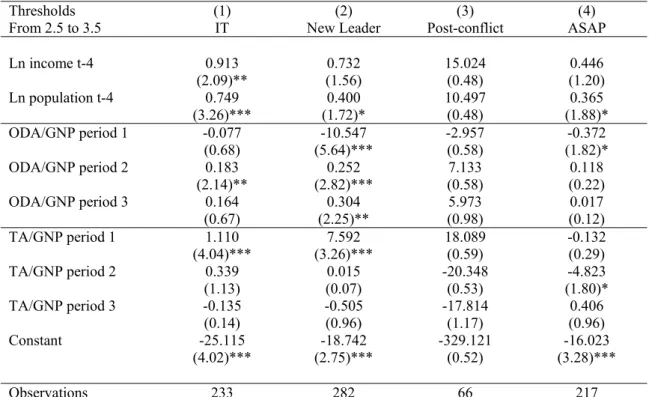
In Table 6, column 1 repeats the CPIA-defined incipient turnaround analysis for purposes of comparison. Column 2 investigates situations in which the leader has just changed. Thus, the first four-year period is now defined as the first four years of the new leader. The results are qualitatively the same as those following an incipient turnaround but are quantitatively different, both the favorable and adverse effects of aid being considerably amplified. Early finance strongly chills the interest of new leaders in reform, whereas early technical assistance strongly assists it.
Column 3 investigates post-conflict situations. While the signs on financial aid and technical assistance remain the same, they lose significance. However since the sample is reduced from 233 to 66 this is unsurprising. Finally, column 4 benchmarks all three types of aid intervention against a ‘blind’ donor strategy of intervening as soon as a failing state is observed. Essentially, such an intervention appears to be a waste of resources. The best strategy is to wait: during the first four years of the intervention finance has a significantly negative effect and during the second four years, technical assistance has a significantly negative effect.
4.3.
Robustness checksSo far our results have all been dependent upon a particular definition of a turnaround measured using the CPIA. Table 7 provides some robustness checks on turnarounds definitions. Regression (1) shows the results when the sustained turnaround is defined using thresholds from 2.5 to 3 instead of 2.5 to 3.5. Regressions (2) and (3) provide some robustness checks using the ICRG instead of the CPIA. As presented in section 3, thresholds are used to identify incipient and sustained turnarounds using the ICRG. Regression (4) shows the results when the sustained turnaround is no longer defined using thresholds, but using an absolute increase of 1.5. Finally, column (5) shows the results when exogenous death of leaders is used as starting point of reform instead of change in leaders.9 Results for technical assistance are pretty robust, at least for the first four-years of the reform process. Results for other aid are less robust, aid in the second period being significantly positive in only one out of five estimations. The regression using death of leaders leads to a strong negative impact of financial aid in the first four-years, similarly to regressions using change in leadership.
5.
CONCLUSIONFailing states are quite rightly a major focus of donor concern. Such states have tended to be neglected, yet they inflict substantial costs on their own citizens and further costs on neighbors and the international community.
We have developed a simple taxonomy of the possible binding constraints that prevent failing states from achieving sustained reform. We then constructed empirical proxies for these concepts. Using hazard functions we attempted to deduce the situations in which particular variables appeared to be binding constraints.
Contrary to the prevailing view in the literature, we have found that timely and appropriate aid significantly increases the chances of a sustained turnaround in a failing state. The circumstances in which such opportunities arise are identifiable at the time and so are potentially operational for donors. However, our results are far from being a charter for big aid: three qualifications appear to be important. First, technical assistance, by far the least fashionable component of aid, is much the most reliably effective donor intervention for promoting turnarounds in failing states. Second, even technical assistance is only significantly effective during windows of opportunity. Third, there is some weaker evidence for sequence in instruments: technical assistance first, followed by finance in later years of reform. The evidence on windows of opportunity and sequence is consistent with the notion that in failing states the normal binding constraint is ‘political will’: we have suggested that this is likely to be due to a clash between elite interests and those of the wider society. With this diagnosis, the donor community either has to challenge the governing elite through approaches not used in the past and so not researchable on our data, or to wait for a propitious moment. Such moments do arise, but in the past most have generated reform efforts that have subsequently aborted. There are two reasons for failure once these political windows have opened that the donors can do something about. The first is that the society might lack the capacity to design or implement a strategy for change: technical assistance during reform helps to break this constraint. The second is that donors provide finance too early in reform and this revives the elite interest in the status quo, thus restoring the political constraint: donors need to learn to restrain their enthusiasm for inappropriate intervention.
9 Because we lose many observations using ICRG and death of leaders, we also present the results using income lagged only one period and
REFERENCES
Adam C. and O»Connell S. (1999), «Aid, Taxation, and Development in Sub-Saharan Africa».
Economics and Politics 11: 225-54.
Alesina A. and Drazen A. (1991), «Why are Stabilizations Delayed?». American Economic Review 81: 1170-88.
Barrett D.B. (ed.) (1982), World Christian Encyclopedia. Oxford University Press, Oxford.
Barro R.J. and Lee J-W. (2000), «International Data on Educational Attainment: Updates and Implications». CID Working Paper 42, Harvard University.
Bienen H. and Van de Walle N. (1991), Of Time and Power: Leadership Duration in the Modern
World. Stanford University Press, Stanford.
Burnside C. and Dollar D. (2000), «Aid, Policies and Growth». American Economic Review 90: 847-868.
Casella A. and Eichengreen B. (1996), «Can Foreign Aid Accelerate Stabilisation?». Economic
Journal 106: 605-619.
Collier, P. and J. Dehn, 2001. Aid, Shocks and Growth, World Bank Research Working Paper 2688, Washington.
Collier P. and Hoeffler A. (2004), «Aid, Policy and Growth in Post-Conflict Countries». European
Economic Review 48: 1125-1145.
Collier P. and A. Hoeffler, 2005. Democracy and Resource Rents. Department of Economics, Oxford University, mimeo.
Collier, P., Hoeffler A. and Pattillo C. (2004), «Africa»s Exodus: Brain Drain and Capital Flight».
Journal of African Economies 13: ii15 - ii54.
Devarajan S., Dollar D. and Holmgren T. (eds.) (2001), Aid and Reform in Africa, World Bank, Washington.
Dollar D. and Svensson J. (2000), «What Explains the Success or Failure of Structural Adjustment Programs?». Economic Journal 110: 894-917.
Knack S. (2001), «Aid Dependence and the Quality of Governance: Cross-Country Empirical Tests».
Southern Economic Journal 68: 310–329.
Lal D. and Myint H. (1996), The Political Economy of Poverty, Equity and Growth: A Comparative
Analysis, Clarendon Press, Oxford.
Gurr T. R., Harff B., Marshall M. (2003), State Failure Task Force Report, Phase 3: Findings. Center for International Development and Conflict Management, University of Maryland.
Jones B.F. and Oken B.A. (2005), «Do Leaders Matter? National Leadership and Growth since World War II». Quarterly Journal of Economics 120: 835-864.
Rodrik D. (1996), «Understanding Economic Policy Reform». Journal of Economic Literature 34: 9-41.
Sachs J. (1994), «Life in the Economic Emergency Room». In Williamson J. (ed). The Political
Economy of Policy Reform. Institute for International Economics, Washington D.C.
Svensson J. (2000), «When is Foreign Aid Policy Credible? Aid Dependence and Conditionality».
Journal of Development Economics 61: 61-84.
Tavares J. (2003), «Does Foreign Aid Corrupt?». Economics Letters 79: 9-106. World Bank, various years. World Development Report. Washington.
Table 1 : Failing States and Turnarounds
Failing states 1977-2004 Sustained Turnarounds
No Turnaround Sustained turnarounds Date Angola Albania 1991-1995 Chad Bangladesh 1977-1993 Comoros Benin 1987-1997 Congo, Democratic Rep. Burkina Faso 1987-1994 Congo, Rep. Burundi 1983-1988 Equatorial Guinea Cambodia 1991-2003 Guinea Central African Republic 1978-1988 Guinea-Bissau Côte d'Ivoire 1992-2000 Haiti Egypt 1988-2000 Laos Ethiopia 1991-2000 Liberia Ghana 1982-1987 Mauritania Guyana 1987-1993 Mozambique Honduras 1989-1995 Myanmar Indonesia 1977-1987 Nepal Lesotho 1987-1998 Niger Madagascar 1978-1991 Nigeria Nicaragua 1989-1995 Sierra Leone Pakistan 1979-1990 Solomon Islands Rwanda 1994-2000 Somalia Sao Tome & Principe 1986-1992 Sudan Tajikistan 1997-2003 Tanzania Togo 1980-1987 Turkmenistan Uganda 1986-1992 Uzbekistan Ukraine 1999-2003 Zimbabwe Vietnam 1988-1991 Zambia 1988-1994
Table 2 : Completing Turnarounds: a Preliminary Analysis
IT “CPIA goes from 2.5 to 3.5” (1) (2) (3) (4) (5) (6) (7) (8) (9) (10) (11) (12)
Ln income t-4 0.913 0.880 0.859 0.905 0.925 1.249 0.327 0.770 0.897 1.047 0.796 0.911 (2.09)** (2.00)** (1.87)* (1.67)* (1.40) (2.03)** (0.70) (1.59) (1.85)* (2.05)** (1.68)* (1.97)** Ln population t-4 0.749 0.800 0.706 0.818 0.592 0.880 0.580 0.678 0.713 0.755 0.648 0.711 (3.26)*** (3.47)*** (3.24)*** (2.72)*** (2.07)** (2.75)*** (2.72)*** (3.03)*** (2.84)*** (2.97)*** (2.72)*** (2.90)*** (ODA-TA)/GNP period 1 -0.077 -0.051 -0.020 -0.401 -0.100 -0.046 -0.132 -0.105 -0.073 -0.067 -0.092 -0.081 (0.68) (0.49) (0.19) (3.08)*** (1.01) (0.49) (1.04) (0.90) (0.65) (0.62) (0.79) (0.69) (ODA-TA)/GNP period 2 0.183 0.193 0.324 0.199 0.163 0.231 0.205 0.144 0.179 0.213 0.178 0.185 (2.14)** (2.22)** (3.15)*** (0.67) (0.93) (1.69)* (2.13)** (1.55) (2.18)** (2.33)** (1.93)* (2.20)** (ODA-TA)/GNP period 3 0.164 0.155 0.265 0.325 -0.249 0.140 0.135 0.136 0.165 0.155 0.146 0.164 (0.67) (0.65) (0.98) (1.32) (0.48) (0.53) (0.66) (0.55) (0.65) (0.64) (0.57) (0.66) TA/GNP, period 1 1.110 1.156 1.124 2.667 1.247 1.127 1.030 1.099 1.073 1.178 1.028 1.095 (4.04)*** (4.10)*** (4.16)*** (4.38)*** (3.58)*** (3.47)*** (3.94)*** (3.84)*** (3.55)*** (3.82)*** (3.66)*** (3.34)*** TA/GNP, period 2 0.339 0.399 -0.046 0.187 0.428 0.225 0.077 0.398 0.322 0.285 0.245 0.303 (1.13) (1.18) (0.13) (0.14) (0.62) (0.42) (0.26) (1.18) (1.06) (0.89) (0.74) (0.97) TA/GNP, period 3 -0.135 -0.036 -0.509 -0.756 1.117 0.026 -0.119 -0.107 -0.166 -0.090 -0.166 -0.162 (0.14) (0.04) (0.49) (0.69) (0.69) (0.03) (0.16) (0.11) (0.17) (0.10) (0.17) (0.17)
Leader duration in office 0.039
(1.16)
Dummy post-cold war -1.806
(2.67)***
Resource rent -5.131
(1.02)
Dummy >0 price shock -53.513
(14.44)***
Dummy <0 price shock 5.620
(2.03)** Post-conflict, years 1 to 4 -1.580 (1.05) Secondary education 0.023 (1.54) (p=0.123) Democracy (0-10) 0.038 (1.58) (p=0.113) Dummy democracy 0.063 (0.11) Polity (-10;+10) -0.046 (0.87) Dummy semi-democracy -0.279 (-5 - +5) (0.49) Political rights -0.006 (0.04) Constant -25.115 -26.423 -23.897 -26.356 -23.775 -29.950 -17.978 -22.724 -24.369 -26.629 -22.167 -24.409 (4.02)*** (4.14)*** (3.79)*** (3.46)*** (2.94)*** (3.48)*** (3.25)*** (3.68)*** (3.58)*** (3.57)*** (3.31)*** (3.80)*** Observations 233 233 233 168 144 181 233 225 225 225 225 225
Table 3 : Completing Turnarounds when Binding Constraints are Relaxed IT “CPIA goes from 2.5 to 3.5” (1) (2) Ln income pc t-4 0.753 0.697 (1.44) (1.39) Ln population t-4 0.900 0.886 (3.39)*** (3.43)*** (ODA-TA)/GDP, years 1 to 4 -0.425 -0.594 (2.88)*** (2.88)*** (ODA-TA)/GDP, years 5 to 8 0.178 0.186 (0.79) (0.89) (ODA-TA)/GDP, years 9 to 12 0.255 0.244 (1.12) (1.08) TA/GDP, years 1 to 4 1.902 2.427 (2.44)** (3.30)*** TA/GDP, years 5 to 8 0.667 0.576 (0.65) (0.61) TA/GDP, years 9 to 12 -0.183 -0.172 (0.18) (0.17) Relax=1, years 1 to 4 8.335 (3.51)*** Relax4=1, years 1 to 4 7.121 (2.13)** Constant -28.435 -27.535 (3.96)*** (3.96)*** Observations 203 201 Countries 57 57 Sustained T. 17 17
Table 4 : Completing Turnarounds when Constraints Change
IT “CPIA goes from 2.5 to 3.5” (1) (2) (3) (4) (5) (6) (7)
Ln income pc t-4 0.834 0.905 0.896 0.941 0.657 0.891 0.737 (1.26) (1.48) (1.49) (1.54) (1.25) (1.44) (1.38) Ln population t-4 0.856 0.812 0.787 0.823 0.849 0.810 0.562 (2.92)*** (2.52)** (2.60)*** (2.77)*** (2.86)*** (2.68)*** (2.33)** (ODA-TA)/GDP, years 1 to 4 -0.438 -0.498 -0.422 -0.441 -0.481 -0.439 0.196 (3.23)*** (3.06)*** (2.61)*** (3.49)*** (2.92)*** (3.42)*** (2.14)** (ODA-TA)/GDP, years 5 to 8 0.107 0.111 0.066 0.069 0.181 0.097 0.197 (0.58) (0.59) (0.38) (0.39) (0.92) (0.57) (2.82)*** (ODA-TA)/GDP, years 9 to 12 0.142 0.177 0.169 0.156 0.232 0.136 0.101 (0.54) (0.67) (0.56) (0.52) (0.95) (0.48) (1.50) TA/GDP, years 1 to 4 2.563 2.756 2.480 2.546 3.032 2.523 (4.54)*** (4.56)*** (4.24)*** (4.51)*** (4.63)*** (4.27)*** TA/GDP, years 5 to 8 0.658 0.639 0.761 0.740 0.386 0.642 (0.97) (0.89) (1.15) (1.09) (0.41) (1.00) TA/GDP, years 9 to 12 0.098 -0.051 -0.051 -0.012 -0.273 0.060 (0.10) (0.05) (0.04) (0.01) (0.25) (0.06) Change from –D to D -0.943 (0.59) Change from D to –D -0.970 (0.58) Change from –Ke to Ke -0.952 (0.85) Change from Ke to –Ke 0.333 (0.39)
Change from –E to E 2.310
(2.31)** Change from –Ks to Ks -0.245 (0.14) Change from –C to C -0.160 (0.15) Constant -26.683 -26.696 -25.835 -26.974 -25.946 -26.258 -19.874 (3.10)*** (3.06)*** (3.07)*** (3.23)*** (3.48)*** (3.05)*** (2.85)*** Observations 181 181 181 181 181 181 181 Countries 52 52 52 52 52 52 52 Sustained Turnarounds 16 16 16 16 16 16 16
Robust z statistics in parentheses, * significant at 10%; ** significant at 5%; *** significant at 1%, ODA and TA are instrumented.
Table 5 : Completing Turnarounds: Are Constraints Encountered?
IT “CPIA goes from 2.5 to 3.5” (1) (2) (3) (4) (5) (6) (7)
Ln income pc t-4 0.813 0.603 0.936 0.852 0.661 0.857 0.913 (1.51) (1.15) (1.55) (1.46) (1.09) (1.37) (1.50) Ln population t-4 0.789 0.719 0.792 0.808 0.723 0.805 0.615 (2.22)** (2.62)*** (2.76)*** (2.62)*** (2.62)*** (2.51)** (2.33)** (ODA-TA)/GDP, years 1 to 4 -0.427 -0.782 -0.325 -0.335 -0.504 -0.467 0.236 (2.72)*** (2.56)** (2.29)** (2.74)*** (3.06)*** (3.36)*** (2.59)*** (ODA-TA)/GDP, years 5 to 8 0.227 0.149 0.229 0.149 0.075 0.057 0.215 (1.18) (0.74) (1.21) (0.77) (0.43) (0.33) (3.35)*** (ODA-TA)/GDP, years 9 to 12 0.216 0.250 0.263 0.258 0.196 0.162 0.131 (1.10) (1.15) (1.22) (1.17) (0.57) (0.52) (1.90)* TA/GDP, years 1 to 4 2.871 4.080 2.589 2.624 2.658 2.586 (4.46)*** (3.97)*** (4.31)*** (4.16)*** (4.31)*** (4.49)*** TA/GDP, years 5 to 8 0.205 0.501 0.200 0.528 0.664 0.788 (0.26) (0.55) (0.23) (0.59) (0.98) (1.19) TA/GDP, years 9 to 12 -0.153 -0.377 -0.394 -0.375 -0.232 -0.040 (0.18) (0.39) (0.43) (0.38) (0.17) (0.03)
–D would be the binding constraint 0.013
(0.01)
D would be the binding constraint -4.073
(1.84)*
–Ke would be the binding
constraint 0.451
(0.77)
Ke would be the binding constraint -0.624
(0.64)
–E would be the binding constraint -1.691
(1.75)*
–Ks would be the binding
constraint 0.309
(0.49)
–C would be the binding constraint -0.478
(0.67) Constant -25.832 -22.656 -27.008 -26.288 -22.848 -26.016 -22.119 (2.99)*** (3.25)*** (3.31)*** (3.19)*** (2.90)*** (2.94)*** (2.98)*** Observations 181 181 181 181 181 181 181 Countries 52 52 52 52 52 52 52 Sustained Turnarounds 16 16 16 16 16 16 16
Robust z statistics in parentheses, * significant at 10%; ** significant at 5%; *** significant at 1%, ODA and TA are instrumented.
Table 6 : Generalizing the Windows of Opportunity
Thresholds (1) (2) (3) (4) From 2.5 to 3.5 IT New Leader Post-conflict ASAP
Ln income t-4 0.913 0.732 15.024 0.446 (2.09)** (1.56) (0.48) (1.20) Ln population t-4 0.749 0.400 10.497 0.365 (3.26)*** (1.72)* (0.48) (1.88)* ODA/GNP period 1 -0.077 -10.547 -2.957 -0.372 (0.68) (5.64)*** (0.58) (1.82)* ODA/GNP period 2 0.183 0.252 7.133 0.118 (2.14)** (2.82)*** (0.58) (0.22) ODA/GNP period 3 0.164 0.304 5.973 0.017 (0.67) (2.25)** (0.98) (0.12) TA/GNP period 1 1.110 7.592 18.089 -0.132 (4.04)*** (3.26)*** (0.59) (0.29) TA/GNP period 2 0.339 0.015 -20.348 -4.823 (1.13) (0.07) (0.53) (1.80)* TA/GNP period 3 -0.135 -0.505 -17.814 0.406 (0.14) (0.96) (1.17) (0.96) Constant -25.115 -18.742 -329.121 -16.023 (4.02)*** (2.75)*** (0.52) (3.28)*** Observations 233 282 66 217
Robust z statistics in parentheses, * significant at 10%; ** significant at 5%; *** significant at 1%, ODA and TA are instrumented Table 7 : Robustness checks on dependent variables: thresholds, ICRG and death of leaders
IT using
CPIA IT using ICRG IT using CPIA † Leader From 2.5 to 3 Thresholds corresponding to that of column (1) +1.5 +1.5 (1) (2) (3) (4) (5) Ln income pc t-4 0.853 1.363 1.101 (2.19)** (2.82)*** (2.50)** Ln income pc t-1 2.197 1.749 (3.92)*** (0.92) Ln population t-4 1.367 0.761 1.000 (5.83)*** (2.46)** (4.14)*** Ln population 0.998 0.709 (2.92)*** (0.82) (ODA-TA)/GDP, years 1 to 4 0.031 -0.291 -0.306 -0.096 -3.867*** (0.40) (0.54) (0.90) (0.92) (-11.02) (ODA-TA)/GDP, years 5 to 8 0.023 -0.109 0.034 0.143 -0.375 (0.48) (0.61) (0.21) (2.16)** (-1.54) (ODA-TA)/GDP, years 9 to 12 -0.383 -0.370 -0.333 -0.118 (2.70)*** (3.02)*** (2.04)** (1.38) TA/GDP, years 1 to 4 1.240 2.354 2.616 1.303 1.838* (3.58)*** (1.09) (2.11)** (4.48)*** (1.68) TA/GDP, years 5 to 8 1.006 1.268 0.846 0.648 0.397 (4.17)*** (1.64) (1.24) (2.33)** (0.46) TA/GDP, years 9 to 12 1.162 1.801 1.719 0.881 (4.57)*** (3.58)*** (2.76)*** (3.20)*** Constant -33.818 -28.442 -39.521 -30.803 -24.43 (5.97)*** (3.40)*** (4.06)*** (4.69)*** (-1.04) Observations 170 86 87 222 23
APPENDICES
Appendix 1 : Data and variables CPIA
Country Policy and Institutional Assessment (World Bank). It has 20 equally weighted components rated from 1 to 6, divided into four categories: (1) Macroeconomic management and sustainability of reforms; (2) Structural policies for sustainable and equitable growth; (3) Policies for social inclusion; (4) Public sector management
ICRG
Composite indicator of political stability, economic stability and financial stability. It is rated from 0 (bad institutions) to 100 (good institutions). Source: International Country risk Guide.
Technical assistance and other aid
Aid is defined as net disbursements of official development assistance, minus technical assistance. ODA disbursements and technical assistance data is from OECD, and was divided by the Gross National Product (GNI) from World Development Indicators of the World Bank (2001).
Income per capita
Real gross domestic product per capita ($ in 1996 constant prices), Penn World Tables 6.1. http://pwt.econ.upenn.edu/
Population
World Development Indicators of the World Bank (2005). Post-conflict years 1 to 4
Dummy variable equals to one in years one to four after the ending year of a civil war (Collier and Hoeffler, 2004).
Secondary education
Barro R. and J.W. Lee (2000) dataset. Percentage of the population who completed secondary education (population aged 25 and above).
Democracy
Polity IV (http://www.cidcm.umd.edu/inscr/polity/) score for democracy. Ranges from 0 to 10 (0 = low; 10 = high). Measures the general openness of political institutions. The 11-point Democracy scale is constructed additively. The operational indicator is derived from coding of different authority characteristics.
New Leader and Years spent in office
Years the national leader had been in office. ‘0’ indicates transition year, i.e. a year of change in leadership. Source: State Failure Task Force (2003) (http://globalpolicy.gmu.edu/pitf/) and Bienen and van de Walle (1991).
Resource Rents
Natural resource rents (% of GDP). Resource Rents are calculated by summing the total value of rents for all extractive (i.e. non agricultural) resources. These values are in current US$ and are then divided by GDP in current US$. Source: Collier and Hoeffler (2005).
Polity
Ranges from -10 (autocracy) to 10 (democracy) and is constructed as the difference between the democracy and autocracy indicators of the Polity IV database.
Semi-Democracy
Political rights
Freedom House score for political rights (1 to 7). Higher score implies higher political rights. http://www.freedomhouse.org/
Dummy positive and negative price shocks
From Paul Collier and Jan Dehn (2001). “Aid, Shocks and Growth”. World Bank Working Paper. Instruments for technical assistance and other aid
Same language as donor i: dummy taking the value of one if the donor country and the recipient
country share a common language [from Collier, Hoeffler and Pattillo (2004), source: CIA factbook (2003)].
Same religion as donor i: dummy variable taking the value of one if 30 percent or more of the
population belong to one religious group in the donor as well as in the recipient country [from Collier, Hoeffler and Pattillo (2004), source: Barrett (1982)].
Distance from capitals: it is measured as the inverse of the distance in kilometres between the capitals
of the recipients and Washington D.C., Tokyo and Brussels [from Collier, Hoeffler and Pattillo (2004), source: data made available by the World Bank]
Total aid budget of donor i: total net disbursements of ODA by donors i, in constant prices 2001