HAL Id: dumas-01088584
https://dumas.ccsd.cnrs.fr/dumas-01088584
Submitted on 28 Nov 2014
HAL is a multi-disciplinary open access archive for the deposit and dissemination of sci-entific research documents, whether they are pub-lished or not. The documents may come from teaching and research institutions in France or abroad, or from public or private research centers.
L’archive ouverte pluridisciplinaire HAL, est destinée au dépôt et à la diffusion de documents scientifiques de niveau recherche, publiés ou non, émanant des établissements d’enseignement et de recherche français ou étrangers, des laboratoires publics ou privés.
Engineered for the Production of Cell Wall-Bound
Recombinant Proteins
Nils Saillard
To cite this version:
Nils Saillard. Analysis of a Tyrosine-and Lysine-Rich Fusion Protein Engineered for the Production of Cell Wall-Bound Recombinant Proteins. Agricultural sciences. 2013. �dumas-01088584�
Analysis of a Tyrosine- and Lysine- Rich
Fusion Protein Engineered for the Production
of Cell Wall-Bound Recombinant Proteins
Par : Nils SAILLARD
Soutenu à Paris le 19/09/2013
Devant le jury composé de : Enseignant référent : Sylvain Chaillou Sophie Landaud
Aurélie Baliarda
Les analyses et les conclusions de ce travail d'étudiant n'engagent que la responsabilité de son auteur et non celle d’AGROCAMPUS OUEST AGROCAMPUS OUEST CFR Angers CFR Rennes Année universitaire : 2012-2013 Spécialité : Horticulture Spécialisation :
BIOTECH (Suivie à AgroParisTech)
Mémoire de Fin d'Études
d’Ingénieur de l’Institut Supérieur des Sciences agronomiques, agroalimentaires, horticoles et du paysage
de Master de l’Institut Supérieur des Sciences agronomiques, agroalimentaires, horticoles et du paysage
Analysis of a Tyrosine- and Lysine- Rich
Fusion Protein Engineered for the
Production of Cell Wall-Bound
Recombinant Proteins
List of abbreviations (and glossary)
A.A. = Amino Acids
BSA = Bovine Serum Albumin C5a = Complement factor 5a CaMV = Cauliflower Mosaic Virus
to CIP = to perform a Calf Intestinal Phosphatase treatment
DNA = Desoxyribo-Nucleic Acid
ELISA = Enzyme-Linked Immunosorbent Assay, a test that uses antibodies to detect and sometimes quantify, in aqueous samples, a substance (a specific protein for instance) EGFP = Enhanced Green Fluorescence Protein Hemizygous = A diploid individual or cell is hemizygous for a gene when there is only one copy of this gene present on a pair of chromosomes at one locus. This is different from a heterozygote which displays two different alleles of the gene in matter on the two chromosomes at the same locus when a hemizygous has simply no corresponding gene or sequence on the pairing chromosome. IL6 = Interleukine 6
LeTLRP = Tyrosine- and Lysine- Rich Protein isolated from Lycopersicon esculentum
(Tomato) = the cell wall anchor in this study min = minutes
MQ = water filtered by the Milli-Q® system from Millipore© corporation = Ultra-pure water
M.S. = Murashige and Skoog MS = Mature Stem tissue
NIC = Nearly Isogenic Control= Non transgenic and nearly isogenic line used as a control (and for transformation)
NtTLRP = Tyrosine- and Lysine- Rich Protein isolated from Nicotiana tabacum (Tobacco) PBS = Phosphate-Buffered Saline
pbs = pairs of base
PCR = Polymerase Chain Reaction rpm = Rotations Per Minute RT = Room Temperature ≈20 ±5°C
T0 = Original transgenic generation, here comprised of plants regenerated on artificial medium from leaf tissue transformed with A.
tumefasciens.
T1 = The first filial generation of transgenic plants, which is comprised of offspring resulting from the self-cross of the T0 generation.
T2 = The second filial generation of transgenic plants, which is comprised of offspring resulting from the self-cross of the T1
TCA = TriChloroacetic Acid
Tris = tris(hydroxymethyl)aminomethane TSP = Total Soluble Protein
WT = Wild Type YL = Young Leaf tissue YS = Young Stem tissue
Résumé
C5a et IL6 sont de petites protéines qui sont déjà produites à l’échelle industrielle par fermentation microbienne, ceci à des fins pharmaceutiques. Il a déjà été démontré qu’il était également possible de faire produire ces protéines par des lignées de tabac génétiquement transformées. Une nouvelle construction génétique adressant ces protéines vers l’apoplasme pour les stocker dans la paroi cellulaire a été mise au point, et ce dans le but de faciliter le processus de purification et ainsi réduire les coûts de production. Une telle construction fut obtenue en réalisant une protéine de fusion entre l’IL6 ou le C5a et un protéine pariétale : la TLRP (Protéine Riche en Tyrosine et en Lysine). Une fois cette construction intégrée à une lignée de tabac, les rendements potentiels de ces plantes, ainsi que la localisation subcellulaire des protéines recombinantes produites furent étudiées afin de vérifier si le système ainsi crée fonctionnait de manière efficace. Différentes lignées, tissus et fractions cellulaires furent ainsi étudiés afin de déterminer comment tirer profit au maximum de cette technique. Il fût possible d’isoler, à partir de la paroi végétale de ces plantes, une partie des protéines recombinantes produites mais pas plus de 50% de celles-ci, la majorité des protéines extraites se trouvant sous forme libre dans l’apoplasme. De plus les quantités de protéines recombinantes globalement produites par ces plantes sont relativement faibles ; les jeunes feuilles constituent, d’après les analyses réalisées, la matière première la plus prometteuse, avec un rendement maximum de protéines isolées à partir de la paroi végétale se situant aux environ de 1 pg d’IL6 par mg de poids frais. Une tentative de créer une construction utilisant la EGFP (Protéine Fluorescente Verte Améliorée) afin de réaliser une analyse plus complète de ce système de production fut également explorée mais un phénomène de délétion lors du clonage empêcha sa réalisation.
Abstract
C5a and IL6 are small proteins that are already industrially produced for pharmaceutical purposes by microbial fermentation. It was shown that producing them in stably transformed tobacco was possible. Going further, a new genetic construct addressing those proteins to the apoplast to bind and store them in the cell wall was made. This system was achieved using a fusion protein which included the TLRP (Tyrosine- and Lysine- Rich Protein). The purpose of this construct was to ease the purification process and reduce its cost. The yields that this technique could produce and the actual localizations of the recombinant proteins were then investigated in order to know if this system was working efficiently. Different lines, tissues and cellular localizations were investigated to find out the best that could be achieved out of this system. Some of the recombinant protein could, as expected, be recovered from the cell wall but no more than 50% of the whole production as most of the collected recombinant protein was found free in the apoplast. The overall production of those plants was anyway low. The maximum yield of IL6 gathered from the cell wall being around 1 pg/mg of fresh weight for young leaves, which is the most promising tissue analyzed. A new construct using EGFP was as well prepared in order to further analyze this system but the cloning failed due to some deletion phenomenon which occurred during the cloning step.
Key Words
Molecular farming, cell wall anchoring, IL6, C5a, Tyrosine- and Lysine- Rich Protein
Table of Contents
List of abbreviations (and glossary) ... i
Résumé ... ii
Abstract ... ii
Key Words ... iii
Table of Contents ... iii
Table of Figures... v
Table of Tables ... v
I. Introduction ... 1
A] Producing C5a and IL6 ... 1
B] The Tyrosine- and Lysine- Rich Protein (TLRP), a protein anchored to the cell wall ... 2
1. Presentation of the Tyrosine- and Lysine- Rich Protein ... 2
2. The TLRP in a fusion protein ... 2
C] Genetic constructs used in this study ... 3
D] Reporter genes ... 4
E] Stably transformed tobacco (N.tabacum) as the expression system ... 5
II. Material and Methods ... 6
A] Evaluation of the C5a and IL6 productions in N. tabacum using the TLRP system ... 6
1. Tobacco growing conditions ... 6
2. Identification and characterization of the transgenic plants and lines ... 6
3. Extraction and sampling protocols ... 9
4. Total soluble protein content assessment by Bradford Protein Assay ... 11
5. ELISA method for quantification of C5a and IL6 ... 12
B] Visualizing the expression of TLRP in plant... 12
1. Creation of the transformation vector: pLH-TLRP-t-EGFP ... 12
2. Selection and verifications of the clones ... 12
III. Results ... 13
A] Evaluation of the C5a and IL6 production in N. tabacum using the TLRP system ... 13
1. Segregation pattern of the transgenes ... 13
2. Preliminary experiments ... 16
1. Failure to identify a valid pLH-TLRP-t-EGFP ... 21
2. Localization of the deleted region ... 22
IV. Discussion ... 23
A] Evaluation of the C5a and IL6 productions in N. tabacum using the TLRP system ... 23
1. Identification and characterization of the transgenic plants and lines ... 23
2. Stability and handling of the protein samples ... 24
3. The production of IL6 ... 27
4. TLRP properties ... 31
B] Visualizing the expression of TLRP in plant... 32
Conclusion ... 33
Bibliography: ... 34
Appendices: ... 37
Appendix A: Sequences of the primers used in this study ... 37
Appendix B: Examples of resistance to antibiotic test’s results ... 38
Appendix C: Table of the probabilities of the T2 resistance test’s outcomes ... 39
Appendix D: Table of probabilities of the possible genetic segregation pattern in T1 ... 41
Appendix E: IL6-ELISA data for the tissue yields of the different lines (full set of data) ... 43
Appendix F: Yields of IL6 recovered from the cell wall and the other compartments ... 44
Appendix G: Proportions of IL6 recovered from the cell wall ... 44
Appendix H: Digestion of the origin vectors ... 45
Appendix I: Theoretical restriction pattern of pLH-LeTLRP-t-EGFP’s digestion by FokI ... 46
Appendix J: Digestion of a pLH-LeTLRP-t-EGFP candidate by FokI... 47
Appendix K: Analysis of the result of the PCRs performed on pLH-LeTLRP-t-EGFP ... 48
Appendix L: Analysis of the restriction patterns of the pLH-LeTLRP-t-(…) vectors ... 49
Table of Figures
Figure 1: Il6 3D structure ... 1
Figure 2: Immunochemical histolocalization of NtTLRP ... 2
Figure 3: pLH-LeTLRP-t-EGFP genetic map ... 3
Figure 4: PCR testing the presence of the transgenes in the F1 generation ... 14
Figure 5: Total IL6 Yields of the line 16: full set of data ... 19
Figure 6: Comparison of the IL6 yields of the different tissues sampled ... 20
Figure 7: Comparison of homozygote and hemizygote plants’ yields ... 20
Figure 8: Yields of IL6 recovered from the cell wall and the other compartments ... 21
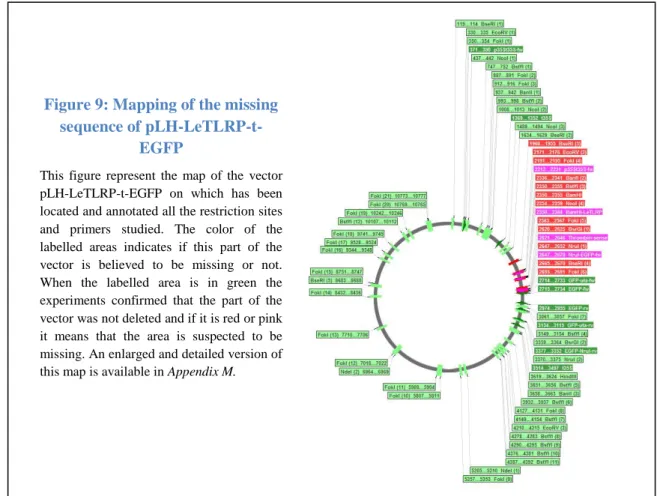
Figure 9: Mapping of the missing sequence of pLH-LeTLRP-t-EGFP ... 22
Table of Tables
Table 1: PCR Mix used for the control PCR ... 7Table 2: List of the primers used for the control PCR... 7
Table 3: Thermocyclor protocol used to for the nptII**+, C5a*++ and IL6*+ PCRs ... 7
Table 4: Results of the resistance tests performed on the T2 generation ... 14
Table 5: Zigosity distribution pattern in T1 and comparison to the expected model ... 15
Table 6: Average TSP concentrations and yields ... 16
ANALYSIS OF A TYROSINE—AND LYSINE- RICH FUSION PROTEIN ENGINEERED FOR PRODUCTION OF CELL WALL-BOUND RECOMBINANT PROTEINS
I.
Introduction
In the field of biotechnology the use of plants for the production of therapeutic proteins is emerging thanks to its advantages that are currently being discovered and explored (Joshi & Lopez, 2005). Although microbial fermentation still remains the industrial process that is most widely used, other organisms such as plants can be used in an attempt to decrease the costs of production and industrial processes through the creation of particular systems. In the present work, we studied how to use the plant’s cell wall as a compartment to accumulate and store the recombinant proteins IL6 and C5a which are small pharmaceutical proteins industrially produced by microbial fermentation. Engineering this system would allow us to use the cell wall as a substitute for the costly chromatographic columns which are usually used for purification (Sharma, 1989). In order to have the expected outcome a Tyrosine- and Lysine- Rich Protein (TLRP) sequence was fused to the sequence of either C5a or IL6 and further transformed and expressed into tobacco (N. tabacum). In between the sequence of the cell wall anchor (the TLRP) and the pharmaceutical protein (IL6 or C5a), the cleavage site of a protease was inserted in order to be able to release and recover the recombinant proteins once the impurities were washed away from the cell wall. This technique, referred to as the TLRP system in this study, could have some industrial advantages: using it, it was hoped to decrease the production costs of the recombinant proteins by obtaining good yields of recombinant proteins and simplifying the processing of the plant material.
A] Producing C5a and IL6
In this study, the therapeutic proteins produced as a test are the complement factor 5a (C5a) and. the interleukin 6 (IL6). Both of them are small proteins (75 and 212 A.A.) which have a role in many biological processes and pathologies (Nausch et al., 2012a, 2012b, 2012c and 2013). They are mainly known to be primary messengers involved in the transmission of the information in the immune system. Succeeding in producing them efficiently and for a low cost could have many applications. For example, IL6 and C5a can be used to produce antibodies to treat sceptic shock or some cancers (Fulciniti et al., 2009; Riedemann et al., 2003). Producing such antibodies is realized by injecting human C5a or IL6 in some farm animals such as rabbits but to do so the C5a and IL6 antigens must be produced first (Czermak et al., 1999).
Producing C5a and IL6 especially represents a challenge as they are small proteins involved in the signaling in the
blood stream, which means they are particularly unstable and have a tendency to aggregate. Some post-harvesting storage solutions have already been found (Kenis et al., 2002). However, preventing their degradation while producing and purifying them from plants seems especially challenging (Nausch et al., 2012b and 2012c).
Figure 1: Il6 3D structure
B] The Tyrosine- and Lysine- Rich Protein (TLRP), a protein anchored to the
cell wall
1. Presentation of the Tyrosine- and Lysine- Rich Protein
The TLRP is a small protein (less than 150 A.A.) expressed in several vascular plants. It was discovered in tomato first. Some analog genes of this TLRP were then found in tobacco and arabidopsis (Domingo et al., 1994 and 1999). The native TLRP has been found to bind to the secondary cell wall and to accumulate in the secondary xylem (Domingo et al., 1994).
Some of the proteins bound to the cell wall can be extracted out of it. For instance, HPRGs (Hydroxy-Proline Rich Glycoproteins) are bound to the cell wall through their massive glycosylation pattern. Interactions are thus based on ionic and hydrogen bonds (Showalter, 1993). These interactions can be broken using the salting out effect of a highly salted extraction buffer (Christoph Unger, personal communication, Department of Agrobiotechnology, Agricultural and Environmental Faculty, University of Rostock). Yet the TLRP seems embedded in the cell wall and it has not been possible to extract it from the plant material so far (Domingo et al., 1999). However, the TLRP is indeed present in the cell wall since it has been possible to detect its presence through in situ immunohistochemical localization (Figure 2). These
observations lead to the conclusion that the binding of the TLRP to the cell wall structure must be covalent. Given the TLRP structure, its binding would be the result of the crosslinking of tyrosine residues with the lignin components of the cell wall. Tyrosine dimerizations (or isodityrosine linkages) and the formation of disulfide bounds in between cysteine residues are also very likely to happen. Therefore, the TLRP would not only bind to the lignin but also to other proteins and itself, participating in the scaffolding of the cell wall. Both reactions of crosslinking involving tyrosine residues should be dependent on the activity of cell wall peroxydases which is fed by hydrogen peroxide (H2O2) (Domingo et al., 1994 and 1999).
2. The TLRP in a fusion protein
Fusing the TLRP with another protein adds in to the chimeric protein obtained several domains; especially a signal peptide that will address the protein to the apoplast and the domains responsible for the crosslinks (Domingo et al., 1999). Domingo et al. (1999) have already made the proof of concept that such a fusion protein ends up tightly bound to the cell wall. However, in this study it is the ability to recover the recombinant protein (freed from its TLRP part by a protease) which will be tested. To do so it was planned to fuse the IL6 or C5a sequence with the one of the TLRP and to add the restriction site of the thrombin in between. The thrombin enzyme was chosen because it is an animal protease acting in the blood stream of mammals, there was then few chances that unwanted interactions happen within this system (Coughlin, 2000).
The interest of this study lies in the idea to use this system to produce and purify IL6 and C5a:
Figure 2: Immunochemical histolocalization of
NtTLRP
Domingo et al. 1999 The marker (blue) shows the accumulation of the TLRP protein along the xylem tissues among all cell walls (pink)
ANALYSIS OF A TYROSINE—AND LYSINE- RICH FUSION PROTEIN ENGINEERED FOR PRODUCTION OF CELL WALL-BOUND RECOMBINANT PROTEINS
washing the soluble impurities from the homogenized plant material. Then the IL6 or C5a would be recovered by resuspending the washed and centrifuged cell wall directly into a buffer where the recombinant proteins could be extracted and stored. In this solution the IL6 or C5a would be released by performing a thrombin digestion. After the digestion the solution which would contain the IL6 or the C5a from this moment would be centrifuged to remove the cell wall. Extended purification steps to remove the other proteins than the ones produced with this system and the metabolic contaminants would then not be necessary. Theoretically the only contaminant that could interfere would be the thrombin but with a well thought protocol the riddance of the thrombin could be easily performed.
When the TLRP system was conceived it was hoped that this system would also increase the recombinant protein yields compared to other systems because the TLRP would stabilize the IL6 or the C5a proteins. Those wishes were based on the fact that fusing an additional sequence to the N-ter extremity of a short and unstable protein can sometimes increase its half-life (Hondred et al,. 1999). Another way the TLRP could also have protected the recombinant proteins from degradation would have been by simply addressing and binding them to the cell wall, isolating them from proteases and other threats to their integrity that could have been encountered in the apoplast or elsewhere in the cell.
C] Genetic constructs used in this study
Genetic constructs to express the TLRP system and produce C5a and IL6 in plants have previously been designed by Henrik Nausch (Department of Agrobiotechnology, Agricultural and Environmental Faculty, University of Rostock). Several constructs used in this study are similar in many ways to each other as they are all derivatives. Figure 3, representing one of these derivatives: pLH-TLRP-EGFP, can be used as a reference to visualize the spatial organization of the structures explained below.
Figure 3:
pLH-LeTLRP-t-EGFP genetic map
This figure was realized with Serial Cloner©. It is an annotated map of the
functional regions of
pLH-LeTLRP-EGFP. Each label contains the name of a gene/genetic region and its position on the map (number of the first and the last nucleotide of the labelled region). BL and BR are the Right and Left Borders of the T-DNA region. There are 2 ORF (Open Reading Frame) in this T-DNA. They are both surrounded by a promoter and a terminator: p35S, enhancers and omega are all parts of the promoters and t35S marks the terminators. One of the ORF is the chimeric protein: the cell wall anchor (LeTLRP), separated from
hrsbguirfsgrge
the fluorescent marker (EGFP) by the restriction site of the thrombin (thrombin site). The other ORF is the resistance gene Kan/NeoR (also called nptII) which is a maker for plant selection. Outside the T-DNA region, delimited by the left and the right borders (BL and BR), there are; the bacterial gene which confer resistance to spectinomycin and spectromycin (aadA); ColE1, the origin of replication for amplification in E.coli.and VS1, the origin of replication for amplification in Agrobacterium. VS1 is not labelled on the map though it is present in between aadA and ColE1 on the map.
The sequences expressing the transgenes were optimized to have a high transcriptional and translational rate: the transcription of the chimeric protein was set under the control of a 35S promoter from the cauliflower mosaic virus (CaMV) of which enhancer has been duplicated (Omirulleh et al., 1993). After the 35S region an Ω region was added in order to improve the transcription as well (Gallie, Lucas & Walbot, 1989). The Ω was followed by the sequence coding for the fusion protein, which has been codon optimized for expression in tobacco (Rouwendal et al., 1997). The fusion protein sequence is composed by the TLRP from tomato (LeTLRP) linked to the sequence coding for the protease cleavage site (the thrombin site) and the gene of interest (IL6 or C5a). To finish the sequence ends with a 35S terminator from the same virus (the CaMV).
The cassette described above was inserted into the backbone of pLH9000. This vector contains genetic material for replication and transformation in E. coli (ColE1) and in Agrobacterium (VS1), as well as selection markers for bacterial (aadA) and plant (nptII) selection. The vector containing the IL6 version of the protein construct was called pLH-LeTLRP-t-IL6 and the one containing C5a was called pLH-LeTLRP-t-C5a.
D] Reporter genes
Several questions have been raised concerning the plants expressing the TLRP protein system: does the fusion protein accumulate in the cell wall as expected? How does it settle exactly in the cell wall? In Domingo’s study (1999
),
the accumulation of TLRP was very likely the result of both its ability to bind to the lignin and the promoter used but what is the pattern of accumulation of the fusion protein in the different tissues and organs with the construct used in this study? Do the pH and the oxidative burst affect the binding of TLRP to the cell wall and its accumulation (Domingo et al., 1994)? Using thrombin, which proportions of recombinant protein can be recovered from the cell wall and which proportions stay bound to it?Thanks to techniques such as ELISA or immunochemical histolocalization, the C5a and IL6 constructs could be used to try to answer these questions but it would complicated, expensive and time consuming to do so. It was then decided to use reporter genes to study the TRLP fusion proteins’ behavior. Though using a marker gene may not exactly reflect the production of C5a or IL6 because protein markers are mostly longer, more stable and have their own properties, using a marker protein will have the advantage of being easier to manipulate and will allow a preliminary characterization of the TLRP system. Several candidates were considered for the marker including fluorescent proteins and the glucuronidase GUS.
Replacing IL6 or C5a by a fluorescent marker would allow us to investigate different aspects of the hereby created system. A TLRP fused with a fluorescent protein could be observed in vivo using confocal microscopy, making it possible to visualize how it is deposited in the cell wall (Haseloff et al., 1999). It would also permit measuring the concentrations of the recombinant protein quickly and for a low cost using a fluorometer (Remans et al., 1999). A leakage or a loss before, during and after the extraction process could then be easily identified and measured, revealing flaws in the system or the extraction protocol.
For instance, the fluorescence would be a very useful technique to test if a part of the produced proteins stays bound to the cell wall even after digesting the cell wall with some thrombin. Indeed it is a possibility that, for some technical or theoretical reasons, the thrombin treatment would fail or work
ANALYSIS OF A TYROSINE—AND LYSINE- RICH FUSION PROTEIN ENGINEERED FOR PRODUCTION OF CELL WALL-BOUND RECOMBINANT PROTEINS
interest would not be released. In that situation in which the recombinant proteins were to be sterically inaccessible for the thrombin then the access for other solutes useful for detection (dyes, antibodies, probes …) could be compromised as well. Meanwhile a laser would have better chances to go through the cell wall to reveal a fluorescent signal.
It could also be that some proteins get lost during the washing steps. A fluorescent marker would be handy in that situation too as it would be easy to detect and quantify losses in the eluates.
The most obvious choice of fluorescent protein would be the EGFP (Enhanced Green Fluorescent Protein) that has been widely used so far for its stability and the strong intensity of its signal (
Hraška,
Rakouský & Čurn, 2006)
. In case EGFP would not be suitable, there are other alternatives. mCherry for instance, a DsRed derivative, offers a good alternative to EGFP (Patterson,Day & Piston, 2001; Shaner et al., 2004).E] Stably transformed tobacco (N.tabacum) as the expression system
Though the production of C5a and IL6 is already available from microbial fermentation (which gave good yields and has already been studied to be improved - Nausch et al., 2012a and 2013), using a plant as a producer instead could reduce production costs and allow an easy scaling up (Twyman et al., 2003). The tobacco plant was chosen to test the TLRP system because it is an organism with promising potential for molecular farming: it has a good biomass yield, being a crop it is easy to cultivate and gather, however it is not a food culture so there is little risk of misuses, it is easy to transform, grow and regenerate in vitro, the risks of unwanted cross-pollination are scarce when good precautions are taken, it produces numerous offspring and it already has been used in many studies, including some which aimed to produce C5a and IL6 (Tremblay et al., 2010; Nausch et al., 2012b and 2012c). Nausch et al. (2012b; 2012c) thus revealed that addressing the C5a to the vacuole and the IL6 to the endoplasmic reticulum (ER) gave higher yields compared to addressing them to the apoplast. Nevertheless using the TLRP system could still have given good yields as the TLRP does not only provide a simple addressing to the apoplast but also a cell wall binding tag. Moreover the main issue with proteins produced in plants is the downstream processing which can represent 80% of the costs, and the TLRP system is an attempt to improve this particular aspect (Roque, Lowe and Taipa, 2008).
Some tobacco leaf discs from the N.tabacum ‘Geudertheimer’ cultivar were then transformed with pLH-LeTLRP-t-IL6 and pLH-LeTLRP-t-C5a. Only the transformed T0 individuals with one copy of the transgene in their genome and the best yields were kept for use in this study. These individuals were identified using southern blot and ELISA (Unpublished data). The use of plants having a single transgenic locus greatly simplified the analysis of the plant and happened to give the best yields in other studies (Nausch et al., 2012b and 2012c). Going further, tobacco seeds harvested from this T0 were the starting point of this study. The lines used for the C5a experiments derived from the T0 plant 39 and the plant characterized by the event 16 gave the material for the IL6 tests.
II.
Material and Methods
A] Evaluation of the C5a and IL6 productions in N. tabacum using the TLRP
system
1. Tobacco growing conditions
In December, N.tabacum seeds from T0 lines 39 for the C5a construct and 16 for the IL6 construct were sawed in 5L pots filled with potting soil. For each line 10 pots were sawed. After few weeks the pots were thinned out to let only one plant develop per pot. The plants were kept in the greenhouse during the whole period. A whiting of the pane and an intensification of the watering were performed in summer but the settings in the greenhouse were not intensively controlled or monitored. The plant tissues were harvested for the first time in March. At the beginning of April, the plants started to flower due to the conditions induced by long days. The tobacco being an annual crop, after finishing its flowering it starts to wither and dies. Hence a repropagation by cutting was necessary before the seed harvest in the end of April. In June a second tissue harvest was performed on the cuttings from April while flowering bud started to appear again, the reproduction cycle being shortened by the summer weather conditions (temperature, light intensity, hours of sunshine).
Mature infrutescences were gathered and stored in paper bags to dry for a few weeks after being cut. Once the fruits were dry, they were cut open to get the many seedlings that they can contain. The gathered seeds were then stored to dry once more in open ependorf tubes for few days before those were closed.
2. Identification and characterization of the transgenic plants and lines a. Strategy to assess the zygocity of the T1 plants
The plants of the T0 generation are normally hemizygous for the transgenes. When there is only one insertion event, as in this study, the product of the self-crossing of this hemizygous T0 generation, called T1, should be a mixture of individuals which completely lack the transgene (Wild Type-homozygotes), individuals carrying a single copy of the gene (Transgenic hemizygotes) and finally individuals containing two copies of the transgene (Transgenic homozygous). According to the Mendelian segregation laws, it can be predicted that those categories should be found respectively in 25-50-25 % proportions.
A PCR targeting the transgenic sequences can be performed to reveal which plants are transgenic and which are wild type. The T1 generation was then tested by PCR. Meanwhile, it is not as simple to distinguish the two transgenic categories since both would give a positive result if a PCR was performed. The distinction between homo- and hemi- zygotes can however be done by analyzing the segregation pattern in the next self-crossed generation (T2): further to a Mendelian segregation, a transgenic hemizygous plant would give 75% transgenic offspring whereas transgenic homozygous plants would engender only transgenic plants. The T2 generation was then tested to reveal the zygocity of the T1 plants they originated from.
ANALYSIS OF A TYROSINE—AND LYSINE- RICH FUSION PROTEIN ENGINEERED FOR PRODUCTION OF CELL WALL-BOUND RECOMBINANT PROTEINS
costly and it requires more handling time to perform PCR. A resistance test is therefore fitter for large scale screenings. This is why it was used to assess the proportions of transgenic plants in the T2 sprouts.
b. Identification of the transgenic plants by PCR
i. DNA extraction
The DNA extractions were performed using a fast sampling protocol: For each plant a 100 mg leaf sample was frozen in liquid nitrogen and grinded with a little plastic pestle directly into an ependorf tube. After the homogenization, 400 mL of a lysis buffer (50 mM Tris-HCl pH 7.5, 100 mM NaCl) was added to each sample. Once melted, the samples were vortexed, incubated 10min at 95°C and put back to thaw on ice. The samples were then centrifuged and the supernatant, being the DNA template, was kept.
ii. Control PCR
The following PCR mix was used:
Table 1: PCR Mix used for the control PCR
Solution Amount (µL)
PCR master mix (Promega®) 5
Forward Primer (10 mM) 1
Reverse Primer (10 mM) 1
DNA sample (1:5) 1
H2O 2
Total 10
For each tested gene a different set of primers was used (all the sequences of the primers used in this study can be found in the
Appendix A):
Table 2: List of the primers used for the control PCR
Gene tested Forward Primer Reverse Primer
nptII 2npt-fw 2npt-rv
C5a c5afw c5arv
IL6 IL6fw IL6rv
The following cycle was used:
Table 3: Thermocyclor protocol used to for the nptII**+, C5a*++ and IL6*+ PCRs
Step Temperature (°C) Time Repeats
Preheating 94 2 min
Denaturation 94 30 sec
x 35
Annealing 55*or 60** 30 sec
Polymerization 72 1 min+ or 45 sec++
Finalization 72 7 min
Storage 4 ∞
The PCR products were loaded into a 2% agarose gel containing 0.001% ethidium bromide and then spread by electrophoresis before being revealed under U.V. light (Ultra-Violet).
c. Antibiotic resistance test
i. Sterilization and growth on selective media of the tobacco seeds
The seeds were sterilized by dipping them in a 0.5 kg/L sodium hypochlorite solution for 5 min. They were then carefully washed in sterile water. The sterilized seeds were sawed one by one on petri dishes using a pattern that allowed plating 50 seeds per dish. The petri dishes used were filled of agar-M.S. medium supplemented with 100 µg/mL kanamycin. In addition, plates without antibiotic were used to plate some seeds of all origins as negative controls.
ii. Identification of the resistant sprouts
Resistant sprouts were identified visually. The transgenic offspring was dark green and well developed (which was also the condition observed on seeds grown in the control plates) whereas the susceptible wild type plants grew yellow and puny (See Appendix B).
d. Statistical analysis of the results
The hypothesis that the segregation pattern was following a simple Mendelian model was made. Therefore probabilities of the different draws were theoretically calculated. The probabilities of each draw were then sorted by increasing value of the likelihood in order to help to determine whether an obtained draw was more or less likely to be obtained compared to the other draws. In some case the repartitions of the draws were compared as well without computation. The data generated for the statistical analysis are displayed in the Appendices C and D.
3. Extraction and sampling protocols
a. Harvesting and post harvesting considerations
The tissues were sampled in the greenhouse directly from the plants using a pruner and/or a scalpel. The plant tissues had to be sampled fresh at the beginning of the study: ice expansion and crystal formation during the freezing would destroy the cells’ wholeness, which is necessary in order to separate the proteins from the apoplast from the cytoplasmic proteins. Later on, when it was not a concern to separate those fractions, the tissues were quickly dipped in liquid nitrogen after the harvest to be stored at -80°C until use.
As the plants used in this study were too old at the time of the sampling and had developed different architectures over time, it was not possible to sample the tissues by developmental stage based on their position on the plant. The most recently developed tissues which were soft, light green and close to the apical meristem(s) were then considered as young leaves or stems whereas the mature tissues were picked dark green and harder. The mature samples were fully developed tissues which would have been ready to be harvested in an agronomical context. They were collected close to the base of the plant while sampling any senescent yellowish leaves was avoided. The different tissues were collected on a same plant in the following order: Young Leaf (YL), Young Stem (YS), Mature Leaf (ML) and Mature Stem (MS). When the stem(s) were sampled they were taken from above or below the node(s) from which the sampled leave(s) belonged.
ANALYSIS OF A TYROSINE- AND LYSINE- RICH FUSION PROTEIN ENGINEERED FOR PRODUCTION OF CELL WALL-BOUND RECOMBINANT PROTEINS
Except for the preliminary ELISA (III.A.3.a), the tissue samples used in this study were always weighted prior to being submitted to any extraction protocol in order to be able to determine the yields per gram of fresh weight. The weight of the samples ranged between 200 and 1000 mg.
b. Extraction protocol of the protein fractions
One of the aims of this study was to localize recombinant proteins in planta. Several localizations were investigated. Sometimes different fractions were pooled together for technical or practical reasons during the analysis.
Repeated washing steps in between each fraction’s collection were carried out to ensure there was no contamination from the other fractions. A washing step usually consisted of adding 2mL of extraction buffer, vortexing, centrifuging and discarding the supernatant. These series of steps were repeated 3 times to complete a wash before passing to the next extraction step.
Samples were wished to be used immediately but it was not always possible. In that case, the samples were stored at 4°C for short term use or -20°C for long term storage when necessary.
The apoplastic proteins
The apoplastic fraction was obtained after vacuum infiltrating some PBS (Phosphate-Buffered Saline) into raw tissue pieces. The infiltrated tissues were then vortexed using two sets of centrifuge tubes; the first was holding back the tissue pieces and it was pierced to let the apoplastic fraction run into the second tubes, the collector ones. This fraction was about 200-500 µL depending on the sample extracted. The collection of this fraction was not followed by a washing step as describe above; but by two other similar vacuum infiltrations along with centrifugations in order to wash the remaining apoplastic proteins.
The cytoplasmic proteins
The cytoplasmic fraction was obtained by homogenizing the plant material, either using a blender (with a lot of extraction buffer, up to 10 mL of a K2PO4 solution at 50 mM) or using procellys® (2x20sec at 6800 rpm) after freezing the samples in liquid nitrogen with 1-1,5 mL of PBS.
When the hand blender was used few ice cubes were added to the sample when necessary to keep it from getting warm. On the other hand, when procellys® was used, , the samples were kept cold by placing them on ice or in a cold steel block in between the homogenization steps.
The proteins bound to the cell wall by intermolecular forces
The “ionic” fraction was obtained by extracting cell wall samples with a PBS buffer enriched with 1 M NaCl (called high salt buffer) to obtain a salt out effect. Either 1 or 3 mL of this solution was use to resuspend the homogenized cell wall. The cell wall was then centrifuged back to collect this fraction.
Occasionally, the “ionic” fraction was also sampled before the homogenization by vacuum infiltration some “high salt buffer” in the tissues and collecting it back the same way the apoplastic fraction was sampled.
The thrombin digestion
The thrombin digestion was done by suspending the washed pellet of blended cell wall into 1 or 2 mL of extraction buffer (3X TBS, 1 mM NaCl) along with 20 µL of thrombin solution (1 U/µL, 10% BSA). The mix was incubated overnight (≈16h) at RT (Room Temperature) on a rotating wheel. After the incubation the sample was centrifuged and the supernatant was analyzed.
For the very first thrombin digestions a leftover of thrombin solution (10 U/µL, no BSA) from the stock (-20°C) was used. Given that it was 10 times more concentrated that what was going to be used after, only 2 µL of the thrombin solution were used in the first experiments (this concerns the protein samples extracted to be analyzed during the first ELISA - III.A.4.a).
When this first thrombin batch from GE Healthcare© was finished, a new batch was ordered from Sigma-Aldrich© (product reference: T4648-1KU). When the product was received, it was dissolved in a 10% albumin solution up to a 1 U/µL concentration. The solution made in this way was aliquoted and stored at -20°C.
c. Total protein extraction
In order to obtain the maximum concentration of recombinant protein and compare the different lines on a global level, a total extraction protocol was set. It combines all of the other extraction methods to ensure to get the most recombinant protein as possible:
The plant tissues previously frozen in liquid nitrogen were roughly grinded with a pestle in a mortal then poured into 2mL ependorfs and weighted. 1mL extraction buffer (3XPBS, 1M NaCl) was then added to the tube. Lastly ceramic beads were added on top in order to use Precellys® for a complete homogenization (2x15s at 6500 rpm). Once the sample homogenized, 20 µL of thrombin solution (1U/ µL and 10% albumin) was added to the resulting slime. The mix was vortexed, and incubated at room temperature on a rotating wheel for 16h. After incubation the slimy mix was centrifuged and the supernatant was immediately analyzed.
4. Total soluble protein content assessment by Bradford Protein Assay
The Total Soluble Protein (TSP) content of the samples was assessed by Bradford assay. Two types of Bradford assays were performed in this study, one specific to high protein concentrations and one specific to low concentrations. The low range assay was used to determine the TSP concentration of samples within a 0.02-0.2 mg/mL range whereas the high range assay covered the 0.2-2 mg/mL range. If the samples had a TSP concentration higher than 2 mg/mL they could be diluted to fit within the range. The high range Bradford assay was done by adding 10 µL of sample to 300 µL of Bradford Reagent (Sigma-Aldrich®) while the low range one used 100 µL of sample with 200 µL reagent. The samples were mixed with the reagent directly in a transparent 96 well plate and the absorbance at 495nm was measured with a KC4© fluorometer from Bio-Tek®.
It was possible to assess the TSP concentrations of the samples using a polynomial to model the relation between the optical density at 495nm (OD495) and the total protein concentration of the
samples. In order to build and compute the standard curve’s equation, a dilution range of an albumin solution of a known concentration was used (2mg/mL, Bovine Serum Albumin [BSA] Standard from Thermo Scientific®).
ANALYSIS OF A TYROSINE- AND LYSINE- RICH FUSION PROTEIN ENGINEERED FOR PRODUCTION OF CELL WALL-BOUND RECOMBINANT PROTEINS
5. ELISA method for quantification of C5a and IL6
The quantification and detection of C5a was performed using the C5a–ELISA kit manufactured by R&D systems©. The protocol was done according to the instruction provided by the manufacturer. A similar system was used for IL6, using an IL6-ELISA kit and its protocol made available by eBioscience©
Each sample was technically measured twice to ensure the reliability of the obtained result. For a sample, the average of the two measured values was considered along with the associated errors for the analysis and the comparison with the other samples. In the analysis of the results these errors are not mentioned as they were faint compared to the variations experimentally observed.
B] Visualizing the expression of TLRP in plant
1. Creation of the transformation vector: pLH-TLRP-t-EGFP
The EGFP gene was amplified via PCR using the expand high fidelity PCR kit by Roche Applied System© according to their protocol. The vector pBI121-MCS-Egfp (from the stock of the Department of Agrobiotechnology, Agricultural and Environmental Faculty, University of Rostock) was used as a template with the couple of primers NruI-EGFP-fw and EGFP-NruI-rv (See Appendix A for the sequences) at the annealing temperature of 56°C. The PCR product, the EGFP with NruI restriction sites added on the extremities, was directly digested with the NruI enzyme, along with the pLH-LeTLRP-t-IL6 vector. The pLH-LeTLRP-t- vector obtained was CIPed after digestion to avoid self-ligation. The ligation of the NruI-EGFP-NruI fragment and pLH-LeTLRP-t- was then realized. The product of this ligation was then used to transform Escherichia coli using a heat shock based method.
2. Selection and verifications of the clones
Once the transformation done, the transformed bacteria were plated on a selective media containing streptomycin (25µg/mL) and spectinomycin (50 µg/mL) to select the resistant bacteria, that is to say the ones transformed with pLH which contain the resistance gene to those antibiotics. But contamination, empty vectors and especially vectors having integrated the EGFP sequence in the wrong orientation would still grow on the dishes, hence the need to check several colonies before to transfer the construct to Agrobacterium. Eight colonies were then investigated.
a. Check PCR
First the integration of the EGFP was tested by colony PCR using primers specific to the
EGFP sequence or close to the cloning site. Different combinations of primers targeting both the
vector and the insert together were used to see which clones had their EGFP insert rightfully oriented. The DNA templates needed for the colony PCRs were obtained either by boiling a bacterial suspension of each colony or by realizing vector purifications using GenElute© from Sigma-Aldrich©. The PCR protocol used was the same as the one used for C5a and IL6 check PCR (see II.A.2.b.ii)
b. Restriction enzyme digestions
Failing to obtain conclusive results from the PCRs, some digestions were performed as well. The vectors purified from each eight colonies were digested using enzymes and protocols provided by Fermentas©. Both the FastDigest® system and the classic system were used depending on the enzyme available.
One digestion can cut the vector at several loci which gives several fragments. For our analysis of the restriction pattern it was necessary to distinguish the different fragment and restriction sites. To do so, an arbitrary nucleotide was chosen on the vector’s sequence to be the origin on the vector’s map or the “nucleotide n°1”. The restriction sites for each cut were then named after their position: the name of each site was composed of the name of the restriction enzyme which cut it followed by a number representative from their position on the vector’s sequence, the n°1 being the first restriction site of the enzyme in question met starting from the 1st nucleotide and moving along the 5’-3’ orientation on the DNA sequence of the vector. (Example: The enzyme Ban II has 3 restriction sites on the pLH-TLRP-t-EGFP vector, they start from the nucleotides 937, 2336 and 2658, they are respectively referred to as BanII(1), BanII(2) and BanII(3)). Based on the same concept, the bands on the restriction patterns were named as well according to the order of the different fragments on the vector before the digestion. (Example: When the band n°2 of the BanII digestion is mentioned, it is the fragment cut between BanII(2) and BanII(3) which is in question.)
The expected restriction patterns were predicted using Serial Cloner® or/and Clone Manager®.
III. Results
A] Evaluation of the C5a and IL6 production in N. tabacum using the TLRP
system
1. Segregation pattern of the transgenes a. PCR of the T1-generation plants
No antibiotic selection was done during the sawing of the T0 generation. For this reason the T1 generation, which sprout from it, contained some non-transgenic plants since T0 is hemizygous by definition. To identify which individuals were transgenic a PCR was performed on DNA samples extracted from the T1 plants. Both the transgenes of interest and the resistance gene to Kanamycin (nptII) were tested in order to confirm the obtained results.
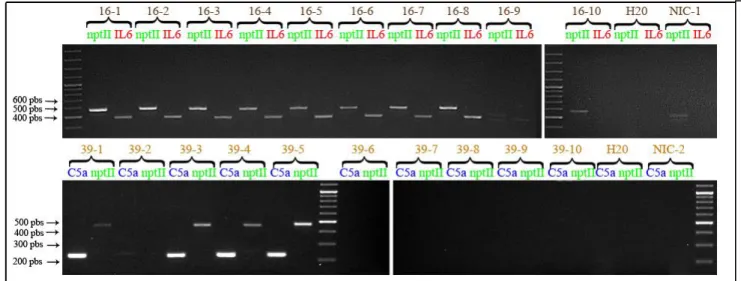
It was determined by PCR that the individuals 16-1, 16-2, 16-3, 16-4, 16-5, 16-6, 16-7, 16-8 and 39-1, 39-3, 39-4, 39-5 were transgenic, and that 16-9, 16-10 and 39-2, 39-6, 39-7, 39-8, 39-9, 39-10 were not (Figure 4).
ANALYSIS OF A TYROSINE- AND –LYSINE- RICH FUSION PROTEIN ENGINEERED FOR PRODUCTION OF CELL WALL-BOUND RECOMBINANT PROTEINS
b. Segregation pattern in T2
Figure 4: PCR testing the presence of the transgenes in the F1 generation
Gel electrophoresis revealed under U.V. light of the PCR performed on the genomic DNA of the different individuals in F1. The presence of a band allows the identification of the individuals containing the transgenes. Primers specifics from nptII (resistance marker), IL6 and C5a were used. According to the sequences of the constructs the expected sizes of the fragments should be 469 pbs for the nptII fragment, 560 pbs for the Il6 band and 233 pbs for C5a. Above each lane (in brown) is the identification number of the tested individual: (T0 mother line n°)-(F1 individual n°), then on the second line (in green, red or blue) is written the gene targeted by the set of primer used. Water samples (H20) and non-transgenic plant DNA samples (NIC) were used as well as negative controls.
Table 4: Results of the resistance tests performed on the T2 generation
This table displays the result of the resistance and germination tests performed using seeds of the T1 generation meaning T2 sprouts. Plants of both lines containing IL6 and C5a constructs were tested, but only the lines predetermined transgenic in III.A.1.a were tested. Non-transgenic plants (NIC) and plates without antibiotics (Kanamycin -) were used as controls. For each plant line tested the proportion of sprouts which seemed resistant is given as a percentage of the seeds which germinated (% resistant phenotype). On the plates with kanamycin (+), a proportion of more or less 75% resistant seed indicates that the T1 line used was hemizygous for the transgenes whereas all sprouts should be resistant if the T1 plant which gave the seeds was homozygous
Transgene (T0 line) None (NIC) C5a (39) IL6 (16)
Kanamycin - + - + - +
Plant line (T1 seeds) 1 2 1 2 39-1 39-3 39-4 39-5 39-1 39-3 39-4 39-5 16-1 16-2 16-3 16-4 16-5 16-6 16-7 16-8 16-1 16-2 16-3 16-4 16-5 16-6 16-7 16-8 % Resistant phenotype 100 100 0 0 100 100 100 100 72 80 80 82 100 100 100 100 100 100 100 100 100 100 92 100 74 100 76 100
Once the T1 generation gave mature seeds, they were tested by an antibiotic resistance test in order to determine if the seed were coming from a homozygous or hemizygous plant (Table 4).
The proportions of resistant plant in T2-generation sprouts allowed us to identify the T1 plants 16-1, 16-2, 16-4, 16-6, 16-8 as homozygotes and the plants 39-1, 39-3, 39-4, 39-5 and 16-3, 16-5, 16-7 as hemizygotes (Table 4).
If you consider that the outcome of this experiment follows a binomial distribution B(50;0.75), all data hereby obtained seem coherent except the result obtained for the line 16-3. Indeed, there should be about 75 % of resistant plantlets in the offspring of a hemizygous plant and the line 16-3 displays a proportion of resistant plantlets of about 92%. Considering the parameters of the experiment getting a proportion closer to 75% would be 99.7% more likely if the line 16-3 were hemizygous and the pattern of segregation Mendelian (See Appendix C) and impossible if 16-3 was homozygous.
a. Segregation pattern in T1
If you consider the Mendelian model of a purely autogamous reproduction the probability of getting a draw such as 6/0/4 (WT-homozygote/Transgenic Homozygote /Transgenic Hemizygote) or a less probable draw is below 3% (see Appendix D). A 3% value is below what most statistical test would accept, the significance level often being 5%. Then obtaining the draw of the line 39 is quite unlikely with the hypotheses made. On the other hand, the chance of obtaining a draw of 2/5/3 or something less likely is close to 20% which is a less surprising and then an acceptable draw considering the parameters and hypotheses made here (see Appendix D).
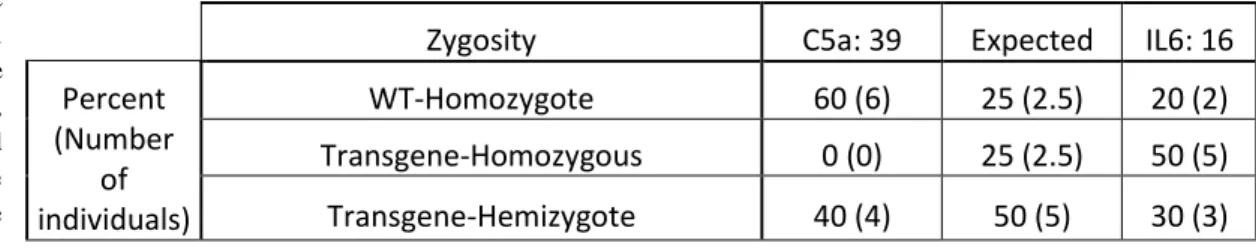
Table 5: Zigosity distribution pattern in T1 and comparison to the expected model
Zygosity C5a: 39 Expected IL6: 16
Percent (Number of individuals) WT-Homozygote 60 (6) 25 (2.5) 20 (2) Transgene-Homozygous 0 (0) 25 (2.5) 50 (5) Transgene-Hemizygote 40 (4) 50 (5) 30 (3)
Information given by the outcome of the PCR in T1 (Figure 4) and the resistance test in T2 (Table 4) are resumed and summed up in this table to reveal the zygosity segregation pattern of the T0 offspring. T1 plants can then be classified in 3 categories: non transgenic or wild type (WT-homozygote), transgenic homozygote and transgenic hemizygote. Both the line 39 for C5a and 16 for IL6 are compared to the theoretical result (Expected) of a simple Mendelian pattern that could be expected. In each cell is displayed both the proportion of each category of individual and the actual count (in brackets)
ANALYSIS OF A TYROSINE- AND LYSINE- RICH FUSION PROTEIN ENGINEERED FOR PRODUCTION OF CELL WALL-BOUND RECOMBINANT PROTEINS
2. Preliminary experiments
a. Total soluble protein content
i. Total Soluble Content of the protein fractions
In previous experiments performed by Henrik Nausch, some recombinant proteins were recovered using the TLRP system but only in very small amounts (unpublished data). These experiments were performed on the cell wall of leaves of the T0 plants that gave the lines 39 and 16. It was then questioned if the TRLP anchoring worked efficiently. The other fractions in which the protein could have ended up were then investigated. Therefore the total soluble protein contents of the apoplastic, cytoplasmic and “ionic” fractions were investigated (Table 6). The decision was made to investigate the stem tissue as well since the TLRP binds to the secondary cell wall of xylem vessels (Domingo et al., 1999) which should be more abundant in stems than in leaves.
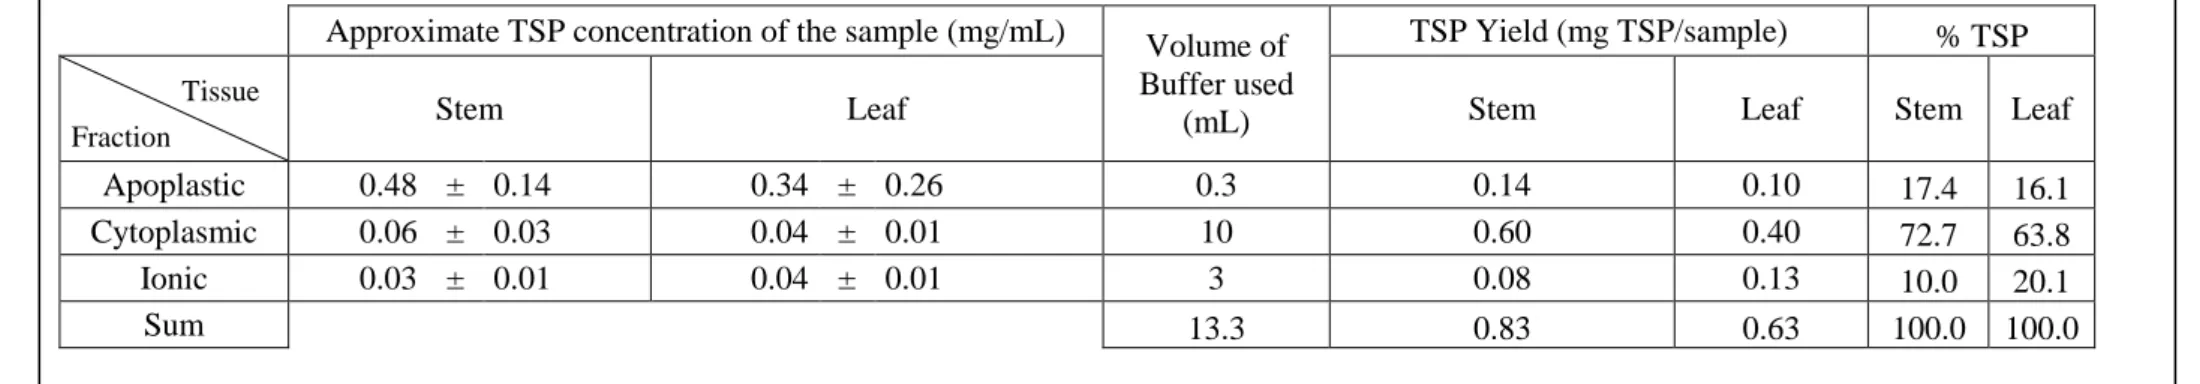
Table 6: Average TSP concentrations and yields
The data displayed in this table were acquired from three replicates: an untransformed plant (a NIC plant), a plant from the C5s line (39) and one from the Il6 line (16). The samples taken from those plants were submitted to a Bradford assay to measure TSP in both the stem and leaf samples (Tissue: Stem of Leaf) of the different protein fractions (Fraction: Apoplastic, cytoplasmic and ionic).Leaves and stems sections of each plant were sampled in equivalent amounts: about 12 cm2 of leaf surface and 1.3 cm3 of stem tissue were respectively sampled. This table gives the average protein concentrations measured in each kind of sample (Approximate TSP concentration of the sample) along with errors based on both standard deviations and technical accuracy. The average total protein yields of each sample (TSP yield) is deduced from the measured concentration. For each fraction a different volume of buffer (Volume of Buffer used) was used depending on the extraction method, this is why a higher TSP concentration does not mean a higher yield. Finally a sum of the amounts of TSP found in each fraction (Sum) was calculated and used to assess which proportions of the total TSP content (% TSP) each fraction contains.
Approximate TSP concentration of the sample (mg/mL) Volume of Buffer used
(mL)
TSP Yield (mg TSP/sample) % TSP
Stem Leaf Stem Leaf Stem Leaf
Apoplastic 0.48 ± 0.14 0.34 ± 0.26 0.3 0.14 0.10 17.4 16.1 Cytoplasmic 0.06 ± 0.03 0.04 ± 0.01 10 0.60 0.40 72.7 63.8 Ionic 0.03 ± 0.01 0.04 ± 0.01 3 0.08 0.13 10.0 20.1 Sum 13.3 0.83 0.63 100.0 100.0 Tissue Fraction
It was not always possible to determine the total soluble protein (TSP) concentrations during the first measurement due to some technical issues. These issues led to measurements being taken a second and a third time. However after the third measurement the problem was solved, the data could not be validated as it seemed that the protein concentrations progressively decreased over the measurements (data not shown). Indeed, proteins can be degraded by proteases or by microbial contaminants, be broken down by ice crystals during the freezing cycles or simply physically degraded over time. Consequently these preliminary results were acquired with a low accuracy. They are nevertheless displayed since they helped to explain some experimental results and set new protocols (Table 6).
Given the protocol and calculations applied, the data displayed in the Table 6 are naturally not representative of a biological context but of the concentrations in our samples and the yields of our extraction technique. However, this table reveals that most proteins are in the cytoplasm as expected. Nevertheless, a non-negligible amount of soluble proteins that need to be investigated is also present in the apoplast and the cell wall (since the “ionic” fraction contains the proteins bound to the cell wall by intermolecular forces).
ii. Complementary data about the protein sample’s stability
Protein samples are especially unstable when their concentrations are below 1 mg/mL as they will degrade rapidly in such conditions (Wang et al., 1999). From the data acquired it is obvious that the samples used in Table 6 have too low TSP concentrations to be properly stored. Considering that only the extraction protocol takes more than a day (only the thrombin digestion takes 16h at RT) and that the samples were on hold to be subjected several times to the Bradford assay, a better extraction or preservation method should be considered as the samples are likely to have already been subjected to degradation at the time of the measurement.
It is not advisable to keep fresh protein samples more than a day at 4°C. Nevertheless, the pH of some protein samples was tested at some point and a decreased of the pH values was measured after few days of storage at 4°C: the pH of the samples went from a 6-8 to a 5-7 range (the pH was dependent on the type of sample though the extraction solution was buffered at a pH of 7,4 - data not shown). This decrease in pH suggests a microorganism proliferation. Freezing was not the best option either since freezing cycles affect the quality of the samples as well. This is mainly due to the formation of ice crystals and the denaturation that happens during the freezing.
The compartment which gave the most concentrated samples and then likely the more stable ones was the apoplast. It is not because it was the compartment with the highest TSP content but because very small amount of buffer were used to extract it (only what could be vacuum infiltrated) whereas a lot of buffer was necessary to homogenize properly the tissues, diluting a lot the cytoplasmic fraction. This fact inspired to use less buffer for the protein extractions during the following experiments. Having more concentrated samples should not only help to preserve the samples but also to detect smaller amounts of protein using the same techniques.
b. ELISA C5a
Some tissues sampled on the T1 generation of the line 39 were extracted using the fractioning method and each fraction was analyzed with the C5a-ELISA. The dilutions of the standard permitted constructing a calibration curve but no signal was observed for any of the sample (data not shown).
ANALYSIS OF A TYROSINE- AND LYSINE- RICH FUSION PROTEIN ENGINEERED FOR PRODUCTION OF CELL WALL-BOUND RECOMBINANT PROTEINS
detected, (ii) the plant tested did not express C5a at all, (iii) the thrombin treatment did not worked or (iv) the C5a was already degraded by the time the analysis was made.
When the IL6 ELISA test was performed on the plants of the line 16 (II.A.3.a), some of the fractions gave some weak signals. Besides IL6 gave higher yields in planta in previous studies (Nausch et al., 2012b, 2012c). The higher yields of the IL6 plants were thought to be the result of the fact that IL6 was a more stable protein in this configuration (Nausch et al., 2012b, 2012c and Inge Broer, personal communication). The IL6-ELISA is also more precise than the C5a-ELISA which allowed detecting lower amounts of recombinant proteins. It was then decided to keep working with the IL6 plants.
3. Recovering the IL6 content from the plant material a. A first attempt to localize the IL6 in planta
The protein fraction separation protocol was used to obtain different samples from the IL6 plants from the line 16 and compare them. A total extraction protocol was performed as well. ELISA was used to measure the quantity of IL6 in each sample.
Overall the concentrations of IL6 found in the samples are low (Table 7). We cannot compare precisely the fractions studied in the Tables 6 and 7, however considering the amounts of buffer used for each fraction in both experiments and the TSP contents measured in the Table 7, it is possible to evaluate more or less the TSP concentrations’ magnitude of the samples in the Table 7 and it should be between 0.04 and 0.75 mg/mL. Considering this rough method of comparison, the total and apoplastic samples should be the ones with the highest TSP concentrations and it can be noticed that they also are the samples giving the highest IL6 yields. This could be explained by the fact that the apoplastic and total fractions simply contain more IL6 than the other fractions but it could also be a consequence to the fact that the lower the TSP concentration is the faster the protein samples degrade. Even though
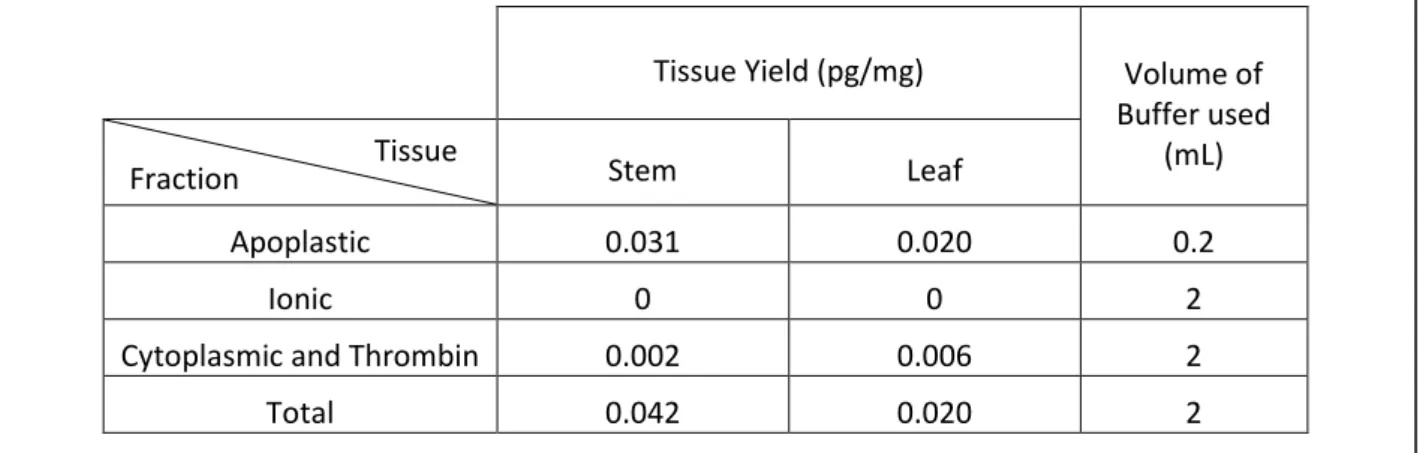
Table 7: IL6 yields primarily detected in the protein fractions
The samples used to acquire the data presented in this table came half from 16-1 and half from 16-5: both tissues were extracted at the same time using 500mg of 16-1 tissue with 500mg of 16-5 tissue pooled in a single sample. Stem and leaf tissues were taken and extracted following two protocols, one separating the different protein fractions (‘apoplastic’, ‘cytoplasmic and thrombin’ and ‘ionic’) and another extracting all the proteins from the tissue at once (total). The IL6 concentrations were then measured in the different samples using ELISA. Finally the concentrations found were converted into yields of IL6 per mg of fresh weight (Tissue Yield).
Tissue Yield (pg/mg) Volume of
Buffer used (mL)
Stem Leaf
Apoplastic 0.031 0.020 0.2
Ionic 0 0 2
Cytoplasmic and Thrombin 0.002 0.006 2
Total 0.042 0.020 2
less buffer was used in the experiment of the Table 7, it may still not be enough to keep the samples from degradation. It was then decided to use procellys® for homogenization which allowed reducing even more the amounts of buffer used and some albumin (BSA) was sometimes added to the samples as a carrier to increase their TSP concentrations to an acceptable level.
Knowing that the values displayed in Table 7 may have been influenced by degradation and that it could have occurred at different rates for the different samples, those values cannot be entirely trusted. However, they still offer useful information about the different samples, even if exact values are not part of it. Indeed it can be noticed that some IL6 is indeed found in these plants, that most of it is located in the apoplast and that the IL6 does not seem to bind to the cell wall via intermolecular forces since no IL6 was detected in the “ionic” fraction.
b. Analysis of the different IL6 individuals and tissues
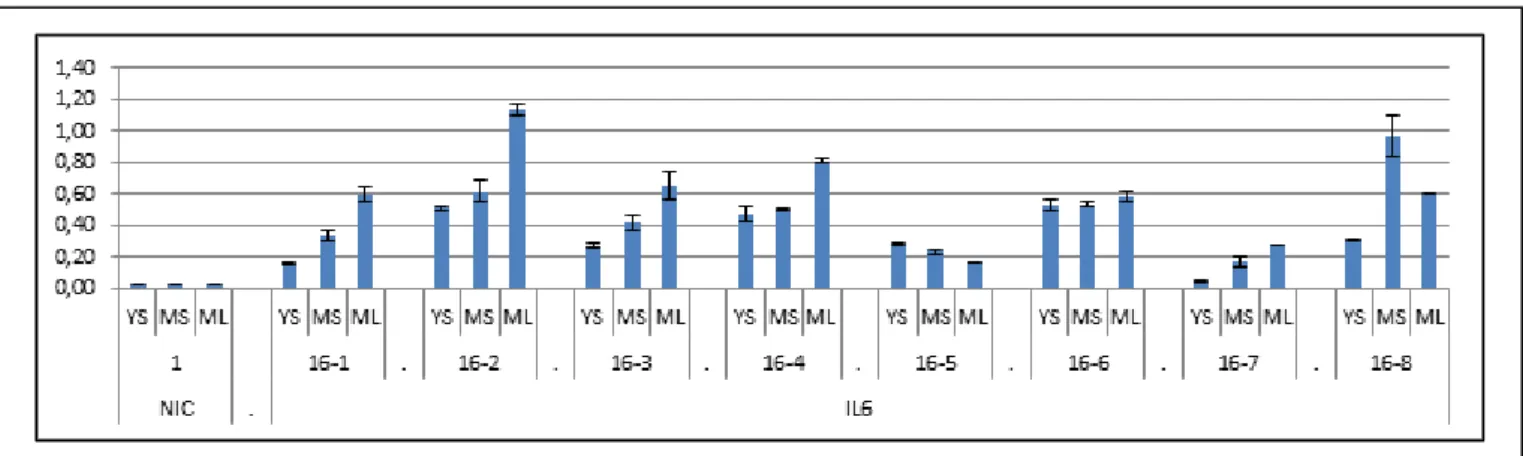
Even though it was expected to obtain higher yields using an improved protocol, the expected readings would stay quite low. Hence, it became important to determine which tissues and lines were giving the best yields in order to facilitate the detection of IL6 and the analysis of the samples. The eight transgenic T1 plants of the line 16 were then sampled to be submitted to total protein extractions and an ELISA in which young and mature tissues of both stems and leaves were tested (Figure 5).
Using BSA with the new batch of thrombin, much greater amounts of IL6 were obtained. The young leaf tissues gave the highest IL6 yields (data not shown), their lowest yield being 3.9 pg/mg for the 16-5 tobacco plant. The concentrations of IL6 in the samples were sometimes so high that it was not possible to determine the yields of some of the young leaf samples such as 16-2 or 16-4 because they were above the range of detection of the test, and it was not possible to remeasure it after dilution due to some technical issues that happened with the storing system (this is why they are not displayed in the Figure 5). However, based on the range of validity of the ELISA and the information about the biological material used, some yields up to 8 pg/mg could still have been measured; some of the young leaf samples had then an IL6 yield higher than 8 pg per mg of fresh weight.
The average yield of each tissue was calculated (Figure 6) to determine the best tissue to sample, YL as discussed hereinabove gave significantly higher yields than the other tissues which
Figure 5: Total IL6 Yields of the line 16: full set of data
Yields in this figure are expressed in pg of Il6 per mg of tissue sampled (same as ng/g). Each sample is characterized by the plant it is taken from (16-1, 16-2 …) and the tissue it was sampled from (YS=Young Stem, MS=Mature Stem, ML=Mature Leaf). A non-transgenic plant (NIC-1) was used as a control. (See Appendix E for the exact values)
ANALYSIS OF A TYROSINE- AND LYSINE- RICH FUSION PROTEIN ENGINEERED FOR PRODUCTION OF CELL WALL-BOUND RECOMBINANT PROTEINS
ML are slightly higher than the ones of MS which are themselves better than the ones of YS. Otherwise it was noticed that the homozygote individuals had higher yields than the hemizygous ones, to check this theory the averages of the yields of homozygous and hemizygous were calculated to be compared (Figure 7). However the different tissues were not pooled together as it did not make sense to pool together samples that were that different in our analysis. Moreover separating both the three kinds of tissue and the two zigosities allowed reducing the errors (based on standard deviations) which supports the theory that those kinds of sample could contain significantly different amounts of IL6. Even making those adjustments the errors are still very high and the differences of concentrations are consequently not “significant”, even though the different kinds of sample constantly give IL6 yields at least two times higher for the samples from homozygous plants than the ones from hemizygous plants (Figure 7).
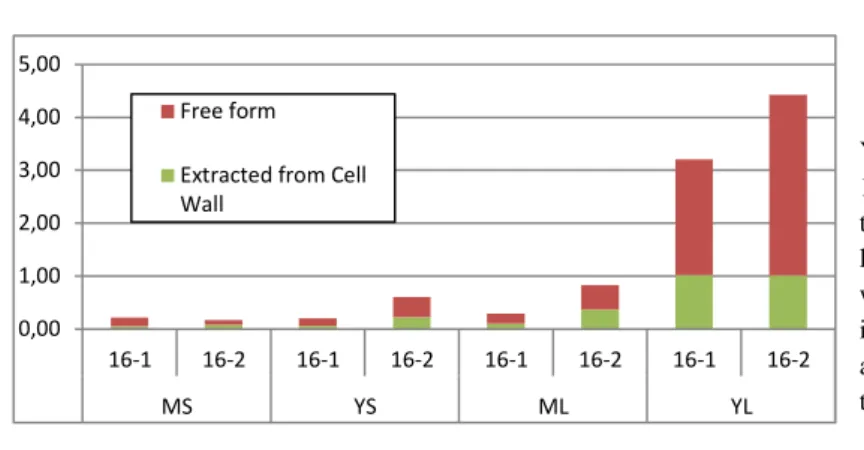
c. The IL6 bound to the cell wall
Given that much higher IL6 yields were detected using the new fresh batch of thrombin that contains BSA as a carrier protein, another attempt to recover some IL6 from the cell wall was performed. This was done by repeating the protein extraction and measuring the IL6 concentrations but in only two fractions this time (Figure 8). The first fraction corresponds to the proteins not-bound to the cell wall (obtained by simple homogenization in a “high salt” buffer), meaning the IL6 in its free form (virtually the sum of apoplastic, ionic and cytoplasmic proteins) and the other fraction analyzed corresponds to the protein extracted from the cell wall by the thrombin digestion (which correspond to the “thrombin” fraction in the previous experiments). The latter is particularly interesting, it is the one isolated from the washed cell wall; it theoretically only contains the IL6, the thrombin and the BSA (though the purity was not tested by comparing IL6 amounts to TSP contents because when the BSA was added, it was added in amounts that hid the original TSP contents from the biological samples, the Bradford assay could then not be used in a relevant way).
Figure 6: Comparison of homozygote and hemizygote plants’ yields
For each tissue (YS, MS and ML), the average yield (in mg/pg) was calculated splitting homozygote (homo) and hemizygote (hemi) plants (identified in II.A.1.b)
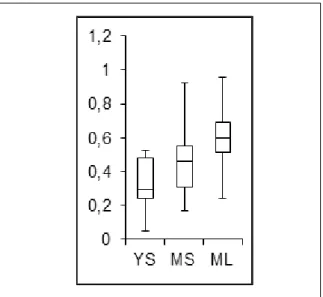
Figure 7: Comparison of the IL6 yields of the different tissues sampled
The data displayed in figure 5 were used to make this box plot. Yields are still expressed in mg/pg or ng/g.