HAL Id: hal-00327979
https://hal.archives-ouvertes.fr/hal-00327979
Submitted on 24 Oct 2005HAL is a multi-disciplinary open access
archive for the deposit and dissemination of sci-entific research documents, whether they are pub-lished or not. The documents may come from teaching and research institutions in France or abroad, or from public or private research centers.
L’archive ouverte pluridisciplinaire HAL, est destinée au dépôt et à la diffusion de documents scientifiques de niveau recherche, publiés ou non, émanant des établissements d’enseignement et de recherche français ou étrangers, des laboratoires publics ou privés.
Stratospheric intrusions induced by a Rossby Wave
breaking and its interaction with the subtropical jet
during PICO3 campaign
A. Carré, François Ravetta, Jean-Pierre Cammas, P. Mascart, J. Duron,
Gérard Ancellet, D. Lambert
To cite this version:
A. Carré, François Ravetta, Jean-Pierre Cammas, P. Mascart, J. Duron, et al.. Stratospheric intru-sions induced by a Rossby Wave breaking and its interaction with the subtropical jet during PICO3 campaign. Atmospheric Chemistry and Physics Discussions, European Geosciences Union, 2005, 5 (5), pp.10301-10337. �hal-00327979�
ACPD
5, 10301–10337, 2005Stratospheric intrusions
A. Carr ´e et al.
Title Page Abstract Introduction Conclusions References Tables Figures J I J I Back Close
Full Screen / Esc
Print Version
Interactive Discussion
EGU
Atmos. Chem. Phys. Discuss., 5, 10301–10337, 2005 www.atmos-chem-phys.org/acpd/5/10301/
SRef-ID: 1680-7375/acpd/2005-5-10301 European Geosciences Union
Atmospheric Chemistry and Physics Discussions
Stratospheric intrusions induced by a
Rossby Wave breaking and its interaction
with the subtropical jet during PICO3
campaign
A. Carr ´e1, F. Ravetta2, J.-P. Cammas1, P. Mascart1, J. Duron1, G. Ancellet2, and D. Lambert1
1
Laboratoire d’A ´erologie, Observatoire Midi-Pyr ´en ´ees, Toulouse, France
2
Service d’A ´eronomie, Institut Pierre Simon Laplace, Paris, France
Received: 23 June 2005 – Accepted: 25 July 2005 – Published: 24 October 2005 Correspondence to: A. Carr ´e ([email protected])
ACPD
5, 10301–10337, 2005Stratospheric intrusions
A. Carr ´e et al.
Title Page Abstract Introduction Conclusions References Tables Figures J I J I Back Close
Full Screen / Esc
Print Version
Interactive Discussion
EGU
Abstract
This study documents several processes of stratosphere-troposphere transport (STT) in the subtropical region. A case study of the interaction between a Rossby Wave breaking over the Canary Islands and a subtropical vortex core situated further south is analysed with ozone airborne measurements (in-situ and Lidar). The investigation is 5
conducted using a Reverse Domain Filling technique to reconstruct high-resolution po-tential vorticity fields with a Lagrangian approach and with simulations of a mesoscale model. Results show irreversible STT associated with tropopause folding, Rossby Wave Breaking and the filamentation of the subtropical vortex core.
1. Introduction
10
The troposphere and the stratosphere are characterised by very different dynamical and chemical properties, involving strong gradients of potential vorticity (PV), chem-ical species like ozone (O3) and relative humidity (RH) at the tropopause. Despite the isentropic PV gradient acting as a dynamical barrier for the transport of air masses across the tropopause, several mechanisms of exchange exist (see Holton et al., 1995, 15
for a general overview on stratosphere-troposphere exchanges). In this paper, the general term STE will refer to stratosphere-troposphere exchange in both directions, while the specific term STT will refer to stratosphere-troposphere transport and TST will refer to troposphere-stratosphere transport. For mid-latitudes, Keyser and Shapiro (1986) reviewed the dynamical properties of baroclinic waves leading to tropopause 20
folds and cut-off lows. Numerous case studies have documented STE associated with tropopause folds (e.g. Danielsen, 1968), with cut-off lows (e.g. Gouget et al., 2000) and with other observed meso-scale structures resulting from the fragmentation of strato-spheric intrusions near the mid-latitude tropopause (Appenzeller et al., 1996a). For the subtropics, Postel and Hitchman (1999) and Waugh and Polvani (2000) produced 25
proper-ACPD
5, 10301–10337, 2005Stratospheric intrusions
A. Carr ´e et al.
Title Page Abstract Introduction Conclusions References Tables Figures J I J I Back Close
Full Screen / Esc
Print Version
Interactive Discussion
EGU
ties leading to the associated irreversible deformation of PV contours on isentropic surfaces across the tropopause. In comparison, fewer case studies of RWB in the subtropics have been made (e.g. Scott et al., 2001; Baray et al., 2003) but those that exist show that substantial STT is involved. Quantifying the transport associated with the wide variety of STE presents a significant challenge on account of the many mul-5
tiscale processes involved, as witnessed by the large range of modelled estimates of stratosphere to troposphere flux of ozone, from 1400 Tg/yr (Crutzen et al., 1999) to 400 Tg/yr (Hauglustaine et al., 1998). Sensitivity arises from the surface taken to represent the tropopause across which fluxes are calculated. In most studies, the dy-namical tropopause is used, area based on a potential vorticity threshold expressed in 10
potential vorticity units (1 pvu=10−6m2Ks−1kg−1). However, the threshold ranges be-tween 1.6 pvu (WMO, 1986) and 3.5 pvu (Hoerling et al., 1991). Difficulties also arise from the method used. Eulerian methods that estimate the motion of air relative to the tropopause have been popularized by Wei (1987) but are highly sensitive to inac-curacies in the underlying data (Wirth and Egger, 1999). Many authors have recently 15
developed a Lagrangian approach (Stohl, 2001; Wernli and Bourqui, 2002; James et al., 2003a, b; Sprenger et al., 2003) and have demonstrated that computing the cross-tropopause flux alone is not sufficient to provide an understanding of the impact on the chemistry of these layers and the impact on climate. In fact, the subsequent paths of air crossing the tropopause should be taken into account, which is not the case in 20
the traditional methods using eulerian diagnostics (e.g. Wei, 1987). Clearly, the signif-icance for STE will differ between deep or shallow transport, rapid or long residence pathways, and finally between reversible and irreversible transport. Based on the 15-year ECMWF reanalyses, James et al. (2003b) show that, unlike shallow STE events, deep stratospheric intrusions present a winter maximum, thus a specific seasonal cy-25
cle. At the same time, more than 90% of all cross-tropopause flows return within 6 h and may not have a large impact on the seasonal cycle of stratospheric ozone in the troposphere. However, use of the ECMWF reanalysis data limited the scales of motion considered in previous studies because the best resolution of the input data was 6 h in
ACPD
5, 10301–10337, 2005Stratospheric intrusions
A. Carr ´e et al.
Title Page Abstract Introduction Conclusions References Tables Figures J I J I Back Close
Full Screen / Esc
Print Version
Interactive Discussion
EGU
time and 1◦in space.
In this paper we study an episode of RWB and its interaction with the subtropical jet with the objectives to infer STE structures from experimental evidence, and to detail from numerical simulations, the associated STTs. Without quantifying the associated transport, the aim is, as a first step, to infer the significance of these STTs in term of 5
irreversibility or not. The case study is documented by the airborne campaign PICO3 which took place in October 2000 over the Canary Islands (28◦N–14◦W). The aim of this campaign was to document the structure of stratospheric filaments in the subtrop-ical region linked to RWB at mid latitudes. The aircraft was equipped with in-situ and Lidar instruments for O3. Table1resumes the occurrence of the PICO3 flights used in 10
that study, and the stratospheric structures sampled during each flight. The structure of the paper is as follows. In Sect.2we present the synoptic situation from ECMWF analyses and, in particular, the evolution of the RWB at mid-latitude. Then, we de-scribe with observations and model results the associated structures leading to STE: a tropopause fold, a midlatitude upper-level trough filament and a subtropical vortex 15
core leading to another filament along the subtropical jet. In Sect.3, we discuss the irreversibility of STT for each structure. Finally, conclusions are drawn in Sect.4.
2. Several cases of subtropical STE
2.1. Meteorological context, numerical tools, and instrumentation
ECMWF data were chosen for the description of the meteorological situation. They 20
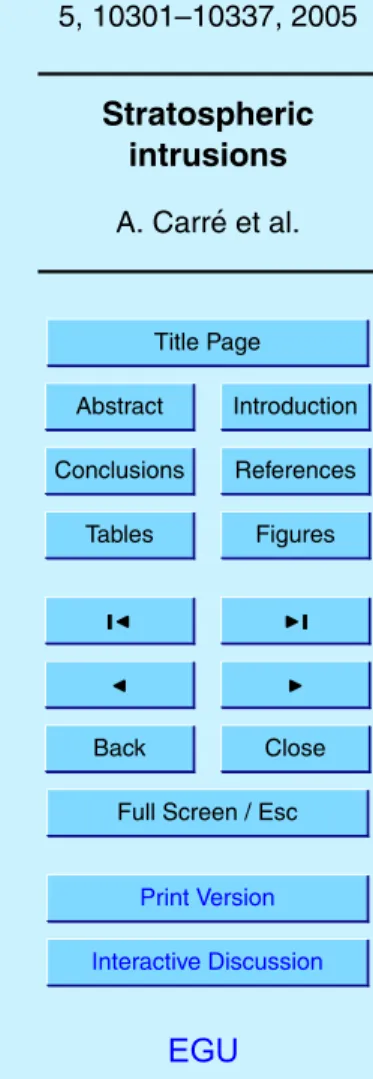
are composed of 6-hourly analyses (00:00, 06:00, 12:00 and 18:00 UTC) with 60 ver-tical levels from the surface up to 0.1 hPa plus intermediate 3-hourly forecasts (03:00, 09:00, 15:00 and 21:00 UTC). The ECMWF archive is spectral and is retrieved with an equivalent horizontal resolution of about 40 km×40 km. Figure 1 shows the mid-latitude Rossby Wave Breaking (RWB) which occurred during the PICO3 campaign. 25
ACPD
5, 10301–10337, 2005Stratospheric intrusions
A. Carr ´e et al.
Title Page Abstract Introduction Conclusions References Tables Figures J I J I Back Close
Full Screen / Esc
Print Version
Interactive Discussion
EGU
by Thorncroft et al. (1993). On 19 and 20 October, southward streching resulted in the breaking of this Rossby wave associated with the strong anticyclonic curved jet stream (Figs.1b and c). Finally, this wave continued breaking and moving eastward on 21 Oc-tober (Fig. 1d). At the southernmost tip of the wave, we observe the formation of a stratospheric filament due to the thinning of the advected high-PV air masses. PICO3 5
flights probed this filament over the Canary Islands on 20 October during flights 39 and 40 (Fig.1c), and on 21 October during flight 41 (Fig.1d).
On 18 October (Fig.1a) the PV distribution between 15 and 30◦N was characterised by a subtropical vortex which was documented by PICO3 flight number 37. As the baro-clinic wave broke over the region, the subtropical vortex evolved towards a subtropical 10
zonal filament (Figs.1c and d) with a predominant contribution of the meridional wind shear component of the potential vorticity compared to the curvature component (Bell and Keyser, 1993). The zonal state of the subtropical jet was documented by PICO3 flight number 39 on 20 October, 15:00 UTC (see red flight path on Fig.1c), at a time when the upper level filament of the baroclinic wave was further north. PICO3 flight 15
number 41 on 21 October, 09:00 UTC (Fig.1d) sampled it again at a time when it was coming into contact with the upper level filament according to ECMWF analyses.
To document the mesoscale aspects of the case study, several model runs were per-formed with the Non-Hydrostatic meso-scale model Meso-NH. The simulation period extended from 20 October at 00:00 UTC to 21 October at 09:00 UTC, to include the 20
three flights 39, 40 and 41. The Meso-NH model is based on the anelastic equations and was developed by the Centre National de Recherche M ´et ´eorologiques (CNRM) and the Laboratoire d’A ´erologie (Lafore et al., 1998). Full physical parametrisations are included in this model: Kain-Bechtold convective scheme, microphysical scheme with ice, turbulent scheme TKE, surface exchange ISBA with resolution physiography, and 25
radiation scheme of ECMWF (Morcrette, 1991). The domain of simulation is the region 39◦W–6◦E, 7◦N–49◦N centered on the Canary Islands, with a horizontal resolution of 30 km and 152 vertical levels to give a good representation at the tropopause region: the top of the model is at 40 km altitude with a vertical resolution of 300 m constant
ACPD
5, 10301–10337, 2005Stratospheric intrusions
A. Carr ´e et al.
Title Page Abstract Introduction Conclusions References Tables Figures J I J I Back Close
Full Screen / Esc
Print Version
Interactive Discussion
EGU
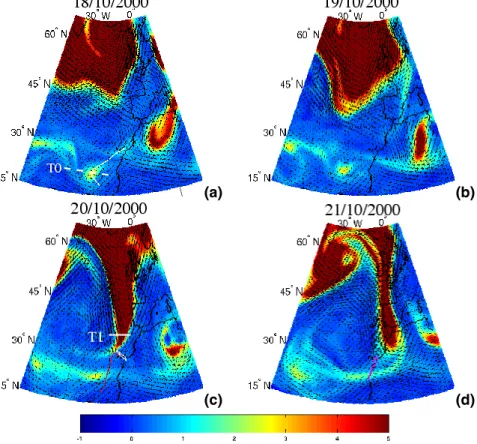
from mid-troposphere to model top. Chemical modules can also be activated on-line to simulate chemical processes (Meso-NH becomes “Meso-NH-C”) with online chemistry (Crassier et al., 2000). In addition, each run includes i) Lagrangian tracers to compute backward or forward trajectories, and ii) PICO3 flight emulation to give some direct comparisons with the in-situ measurements. Figure2presents a temporal evolution of 5
the Meso-NH PV field at flight levels. The dynamical pattern delivered by the model gathers STE structures shown by the ECMWF analyses, i.e. the southernmost tip of the upper-level trough and the associated filament, and the subtropical vortex evolution to a subtropical filament. A detailed evaluation of the simulation over the case study, made (not shown) by comparing synthetic and METEOSAT observed radiances in the 10
infrared and water vapour channels using a “model-to-satellite” approach (Chaboureau et al., 2000), showed good results. Consequently, Meso-NH outputs are jointly used with aiborne observations to document the STE structures.
Because of the predominant relevance of ozone to detect stratospheric intrusion near the tropopause region, Fig.3displays the in-situ O3measurements and O3 simu-15
lated by Meso-NH-C during the three flights 39, 40 and 41. In-situ measurements were sampled every 4 s (corresponding to a horizontal resolution of about 1 km). Ozone measurements were provided by the MOZAIC instrument (Marenco et al., 1998), a dual beam UV absorption instrument with a detection limit of 2 ppbv and overall ac-curacy of ±[2 ppbv+ 2%]. A good general agreement is observed on Fig. 3; a more 20
detailed comparaison is given below. Note that flights 40 and 41 made a loop trajectory (Figs.2b, c), so measurements present some symmetry of shape (around 08:30 UTC for flight 41 Fig.3d for instance).
To document the stratospheric structures and complete the ECMWF data, Meso-NH simulations and observations, we also used the Reverse Domain Filling (RDF) tech-25
nique on the ECMWF analyses. In fact, fields derived from meteorological analyses do not resolve fine scales of motion. This can be usefully remedied by the RDF technique (Sutton et al., 1994) which allows the fine-scale structure of PV to be examined (Schoe-berl et al., 1995; Hegglin et al., 2004). In this technique PV is used as a conservative
ACPD
5, 10301–10337, 2005Stratospheric intrusions
A. Carr ´e et al.
Title Page Abstract Introduction Conclusions References Tables Figures J I J I Back Close
Full Screen / Esc
Print Version
Interactive Discussion
EGU
tracer. Its field at time “t” is reconstructed with values taken at a time “t−∆t” by a set of backward trajectories regularly gridded between time ‘t’ and time “t−∆t”. Here, “∆t” is the backward trajectories integration time. We take it equal to 24–36 h as no additional information on the PV field is gained for larger time periods (not shown). Backward trajectories are performed by the Lagrangian Analysis Tool (LAGRANTO) (Wernli and 5
Davies, 1997) using 3-hourly sequences of ECMWF wind fields. As a preview, Fig.6
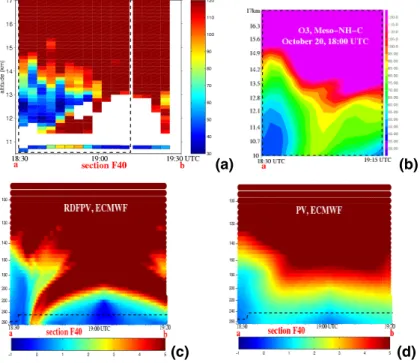
presents the reconstructed PV field (noted RDFPV, graph c) and the PV field from the ECMWF analysis (graph d) on 20 October, 18:00 UTC. These two PV structures are compared to the Meso-NH-C O3 field (graph b) and to the Lidar O3observations (graph a) during the flight 40. The Airborne Lidar ALTO was developed by the Ser-10
vice d’A ´eronomie (Ancellet and Ravetta, 1998). Using a UV differential absorption Lidar (DIAL), ozone vertical profiles have been measured from 500 m up to 6 km above the aircraft. On ozone vertical cross sections along flight tracks, each coloured pixel is about 40 km wide and 150 m thick. This give an idea of the horizontal and vertical reso-lution of this lidar during this campaign. White patches have been applied when aerosol 15
layers or cirrus have made ozone measurement inaccurate. Stratospheric intrusions observed with the lidar are well reproduced by RDFPV field. Given their horizontal resolution, the PV field derived from ECMWF analysis and the O3 field computed by Meso-NH-C are smoother than the RDFPV field and do not always perfectly match the observations. This will be further discussed below.
20
2.2. Wave breaking at mid-latitudes
The Rossby Wave Breaking occurring at mid-latitudes led to three different structures of stratospheric air-mass intrusions into the upper troposphere: a tropopause fold, an upper-level trough-filament (noted ULTF hereafter) and its intrusion further down into the troposphere. These three structures are described in the two following subsections. 25
ACPD
5, 10301–10337, 2005Stratospheric intrusions
A. Carr ´e et al.
Title Page Abstract Introduction Conclusions References Tables Figures J I J I Back Close
Full Screen / Esc
Print Version
Interactive Discussion
EGU
2.2.1. Tropopause fold
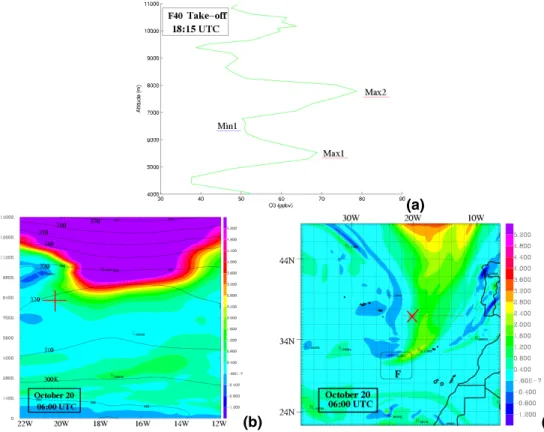
In-situ O3measurements during the take-off of flight 40 are displayed on Figs.3c and
4a. They show ozone-rich layers (up to 80 ppbv) and we investigate those noted Max1 and Max2 at low altitudes, around 5.5 km and 8 km, respectively. To determine the origin of ozone layers Max1 and Max2, we computed Meso-NH 18-h backward tra-5
jectories of air parcels (not shown) initialized along the take-off path of flight 40 back to 20 October, 00:00 UTC. Some air parcels were situated in a tropopause fold from 00:00 to 06:00 UTC. Figure4b shows the structure of this fold at 06:00 UTC, with the Meso-NH PV field. The tropopause is defined dynamically as the 2 pvu isoline of poten-tial vorticity following Hoskins et al. (1985). The PV structure displays the well known 10
tropopause fold structure developed in relationship with an upper level frontal system as described by Danielsen (1968) and Keyser and Shapiro (1986). The fold develops on the western flank of the trough at 320 K. High PV air (around 1 pvu) penetrates into the troposphere down to 7 km above ground with a transverse width of fold of about 100 km. The red cross marks an example of an air parcel which is located in the fold at 15
06:00 UTC and at the location of the in-situ O3maximum labelled Max1 at 18:00 UTC. Between 06:00 and 18:00 UTC, this air parcel subsided by about 3 km, covering about 2000 km on a horizontal plane southeasterly over the Atlantic Ocean. Other backward trajectories confirm that the stratospheric origin of Max2 is associated with the same folding process (not shown). Note, however, that the fine scale vertical layering seen 20
on Fig.4a is not totally explained as there is no evidence in backward trajectories of a tropospheric-origin layer associated to Min1. The vertical resolution of the Meso-NH run may not be sufficient for such an objective.
2.2.2. Upper level trough filamentation
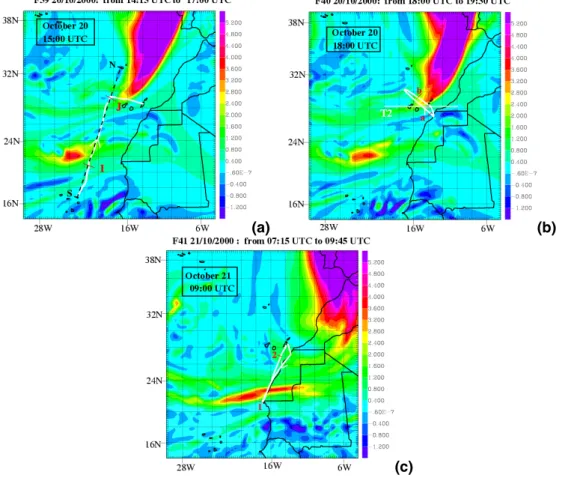
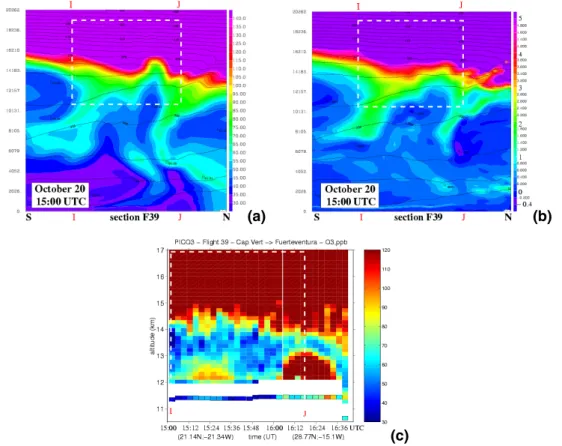
Figure 5c presents the vertical time series of O3 Lidar measurements along flight 39 25
path (section I–J on Fig.2a). It shows a tropopause at about 14 km altitude and two O3features below: the subtropical filament on the south (at about 15:20 UTC) and the
ACPD
5, 10301–10337, 2005Stratospheric intrusions
A. Carr ´e et al.
Title Page Abstract Introduction Conclusions References Tables Figures J I J I Back Close
Full Screen / Esc
Print Version
Interactive Discussion
EGU
ULTF on the north (at about 16:20 UTC) on both sides of the point J, which marks the change of direction along the air path (Fig.2a). In that section, we only focus on the ULTF structure. High O3 concentrations characterize the intrusion, in excess of 120 ppbv between 12 and 13 km altitude and in excess of 80 ppbv at the flight level (Fig.3b). Unlike flight 40 (dicussed below), the flight 39 did not fly Northward enough 5
to capture the joining of the ULTF to the lower stratosphere. Its joining is documented by Meso-NH vertical cross-sections (Figs.5a and b) along the line “S-N” on Fig. 2a. The model reproduces the two stratospheric intrusions associated with the subtropical filament to the south and the ULTF to the north. It shows that the vertical structure of the ULTF slopes downwards to the south. It confirms that the Lidar cross-section only 10
captures the stratospheric intrusion below the tropopause at the southernmost tip of the ULTF. A comparison to the Lidar observations is possible between marks I and J (see the dashed white box). The underestimation of O3 concentrations of about 40 ppbv between 12 and 13 km, and the smoothing of the detailed ULTF vertical structure show the inherent difficulties to perform detailled comparisons at the fine scales along the 15
airpath.
The ULTF was again sampled about three hours later, during flight 40 (Figs.2b and
3c). During this flight, the in-situ O3 concentrations reached 90–100 ppbv just before 19:00 UTC, over a distance of about 300 km. As the aircraft followed a loop path the ULTF was probed again at the beginning of the landing of flight 40 at around 19:20 UTC, 20
when O3 concentrations increased to 80 ppbv (Fig. 3c). The vertical extension of the ULTF along the section marked “a–b” along flight 40 path (Fig.2b) is described by Li-dar O3measurements, the Meso-NH-C O3field, the RDFPV field and ECMWF PV field (Fig.6). The time-series of the O3Lidar profile (Fig.6a) clearly shows the subtropical tropopause (about 100 ppbv O3) at 14.5 km altitude going down to 13 km. This section 25
shows how the ULTF hangs below the tropopause and penetrates into the upper tropi-cal troposphere down to below 12 km, which is in agreement with the in-situ 100 ppbv O3 maximum observed at the aircraft flight altitude. Nonetheless the Lidar measure-ments do not completly describe the vertical structure of the ULTF due to the presence
ACPD
5, 10301–10337, 2005Stratospheric intrusions
A. Carr ´e et al.
Title Page Abstract Introduction Conclusions References Tables Figures J I J I Back Close
Full Screen / Esc
Print Version
Interactive Discussion
EGU
of a cirrus after 19:00 UTC. An alternative vertical structure of the ULTF is offered by the RDFPV field (Fig.6c). Ozone Lidar and RDFPV field are in good agreement and the RDFPV field nicely completes the view across the extratropical air mass. Because of the loop path of the aircraft the vertical structure is repeated again at the end of the time series. Note that the PV field from the ECMWF analysis (Fig.6c) only suggests 5
the possibility of a stratospheric intrusion. O3 simulated by Meso-NH-C is plotted on Fig.6b. Compared to the Lidar O3 and RDFPV fields, the ULTF simulated by Meso-NH-C is almost twice larger below 12.5 km altitude, and the O3concentrations into the intrusion under 13 km are underestimated of about 30 ppbv. Further, Fig.6b confirms (as evocated previously concerning flight 39), that the detailed vertical structure of the 10
ULTF and the tropopause is smoothed in Meso-NH O3 field. Coming back to the O3 in-situ comparaison along the aircraft path shown on Fig.3c, the vertical cross-section (Fig.6b) explains why O3 concentrations simulated along the flight 40 do not exhibit any tropospheric values of 40 ppbv after 19:00 UTC. Indeed, at the flight level (around 12 km), the aircraft in the model is not entering the upper troposphere before 19:15 UTC 15
but is looping within the UTLF intrusion (see Fig.2b). This underlines again the limit of the meso-scale simulation to document such high-resolution filaments, although it provides a more accurate view compared to the global ECMWF analysis.
A further description is given of the intrusion of the ULTF with in-situ O3 measure-ments during the landing of flight 39 (Fig.3b). During this landing across the southern-20
most tip of the upper-level trough (Fig.2a), the in-situ O3concentrations (Figs.3b and
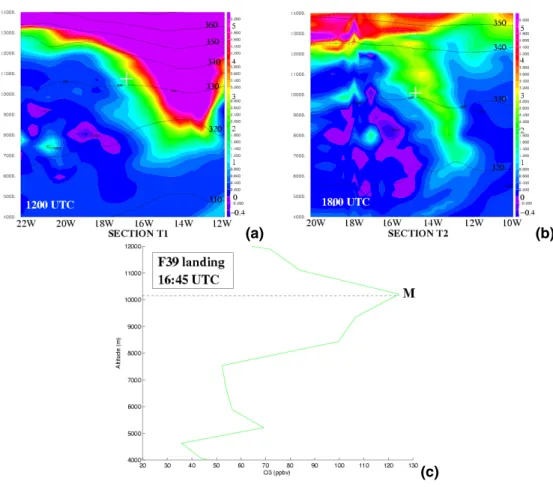
7c) increased abruptly, reaching more than 100 ppbv between 10 and 8 km altitude. An example of Meso-NH 18-h backtrajectories initialized along the landing airpath of flight 39 at 18:00 UTC (i.e. the Meso-NH output that has the shortest time lag with aircraft measurements) will be discussed now. The air parcel initialized on the 120 ppbv ozone 25
maximum (point M on Fig.7c) is shown by a white cross in two vertical cross-sections (Figs.7a and b), the locations of which are shown on Figs. 1c and 2b, respectively. This air parcel is situated from 06:00 to 12:00 UTC on the western side of the upper-level trough between 10 and 11 km, as seen at 12:00 UTC on Fig.7a. Note that this
ACPD
5, 10301–10337, 2005Stratospheric intrusions
A. Carr ´e et al.
Title Page Abstract Introduction Conclusions References Tables Figures J I J I Back Close
Full Screen / Esc
Print Version
Interactive Discussion
EGU
air parcel leaved the simulation domain before 06:00 UTC. At 18:00 UTC (Fig.7b) it is situated in the upper level stratospheric intrusion of the ULTF at about 10 km. Thus, in this 12-hour period of time, the air parcel went down about 1 km along the 330 K isen-tropic surface with a practically perfect conservation of potential vorticity (PV'2.2 pvu). Meanwhile, the time evolution of the potential vorticity structure (Figs.7a and b) sug-5
gests that the air parcel comes from the stratospheric reservoir. The backtrajectory of this air parcel is representative of all other backtrajectories initialized at points of the vertical sounding (Fig. 7c) where the ozone concentration exceeds 80 ppbv (not shown). The irreversible nature of the formation of this ULTF and its intrusion with regard to STT is tested in Sect.3.
10
After these descriptions of the stratospheric intrusions directly linked to the RWB at midlatitudes (tropopause fold, ULTF and its intrusion), we will focus now on the subtropical filament along the subtropical jet.
2.3. Subtropical features
At the end of the PICO3 campaign (Fig.1d), the subtropical jet was characterized by 15
a zonal state with a strong PV shear component on its cyclonic-shear side (Bell and Keyser, 1993). This zonal state resulted from the interaction between the RWB and the subtropical vortex core characterized by a strong PV curvature component (Figs.1a–c). The subtropical vortex core was specially documented during flight 37 on 18 October (Fig. 1a). Along the north-westward crossing of the vortex, in-situ ozone increases 20
(Fig.3a) during about 370 km from 45 to about 85 ppbv just before the turn of the flight (Fig.1a). The vertical extension of the vortex is given by the O3 Lidar measurements on Fig.8a. It is compared to the vertical structure along the aircraft path of PV from ECMWF analyse on 18 October at 15:00 UTC (Fig.8c) and of RDFPV (Fig.8b). O3 Lidar measurements at about 240 hPa well join up with O3 in-situ measurements and 25
show a relative maximum of 95 ppbv in the subtropical vortex core. Interesting enough is the relative ozone minimum observed at about 200 hPa that separates the structure of the subtropical vortex core observed below from the stratosphere above. Such a
ACPD
5, 10301–10337, 2005Stratospheric intrusions
A. Carr ´e et al.
Title Page Abstract Introduction Conclusions References Tables Figures J I J I Back Close
Full Screen / Esc
Print Version
Interactive Discussion
EGU
mesoscale disruption of the tropopause is totally missed by the ECMWF PV structure (Fig. 8c). The comparison also shows that ECMWF data put the subtropical vortex core a bit too much on the southeast, so that the aircraft airpath may have been a few tens kilometers too short to enter the centre of the subtropical vortex and has likely sampled its eastern side. The RDFPV structure along the aircraft path (Fig.8b) allows 5
a more accurate comparison with O3 Lidar observations in the sense that an outline of the separation of the vortex core from the stratosphere is reconstructed from the Lagrangian technique. To go further on the dynamics associated with the mesoscale disruption of the tropopause above the subtropical vortex, the vertical structure of the subtropical vortex is examined in a longer zonal cross-section (noted T0, see loca-10
tion on Fig. 1a). The PV structure (Fig. 8e) confirms the smooth topography of the tropopause across the subtropical jet on the left part and across the subtropical vortex just right of the center. The RDFPV structure (Fig. 8d) shows that the disruption of the tropopause above the subtropical vortex comes from a tropospheric intrusion that went up on the western side and that is transported southward round the vortex to the 15
eastern side where it is observed by the aircraft. Individual air parcel backtrajectories (not shown) indicate that the source of the tropospheric intrusion that surmounts the subtropical vortex is the upper troposphere just north of the vortex. The observation of this tropospheric intrusion fitting between the subtropical jet and the subtropical vortex indicates that the two previous features are two separate dynamical entities and that 20
the subtropical vortex is an ageing structure coming off the stratospheric reservoir. It implicitly shows that all air parcels within the subtropical vortex are subject to STT.
Flight 39 flew through the subtropical vortex core evolving towards a filament on 20 October (Fig. 1c and 2a). The in-situ O3 concentrations (Fig. 3b) characterise this structure between about 15:05 UTC and 15:35 UTC with values around 60 ppbv. 25
Meso-NH-C also captures this feature, though the O3 modeled concentration is over-estimated. This demonstrates a crossing into the filament over a distance of about 450 km. The vertical structure of this subtropical filament in the Meso-NH vertical cross section (Fig. 5) shows a stratospheric intrusion (on the left side) penetrating into the
ACPD
5, 10301–10337, 2005Stratospheric intrusions
A. Carr ´e et al.
Title Page Abstract Introduction Conclusions References Tables Figures J I J I Back Close
Full Screen / Esc
Print Version
Interactive Discussion
EGU
troposphere down to 8 km in altitude, with air characterised by modeled ozone con-centrations ≥65 ppbv and PV value ≥1.5 pvu. The vertical structure of the subtropical filament in the Lidar times series (Fig.5c) confirms that the latter has finally been rooted out of the stratospheric reservoir, as already inferred from O3Lidar observations during flight 37 (Fig.8a). Meso-NH being initialized with the coarse structure of the subtropical 5
vortex that does not include the tropospheric intrusion (compare Figs.8d and e), the process to root out the subtropical filament from the stratosphere can not be simulated. This time, the RDF technique also failed to reproduce the extraction of the subtropical filament (not shown) because of a too large integration time (≥3 days) to recover the tropospheric intrusion captured on Fig.8d. Such a failure will hamper the reconstruc-10
tion of PV along the flight 41 as far as the upper level part of the subtropical filament is concerned.
On 21 October, both the ULTF and the subtropical filament came closer together as the first feature moved south-eastward and the second one extended eastward. Such a deformation can be seen on the evolution of the ECMWF PV fields (Fig. 1) 15
and of Meso-NH PV fields (Fig.2). In-situ O3 measurements during flight 41 (Fig.3d) document the joining of the 2 filaments with a southward in-bound and a northward bound time series across the two features. The nearly identical in-bound and out-bound flight paths (Figs.2c,3d) explain the symmetrical shape of the in-situ O3 mea-surements. The aircraft sampled the ULTF (100 ppbv between 08:10 and 08:20 UTC) 20
and the subtropical filament (60 ppbv between 08:20 and 08:35 UTC) with only a short passage in tropospheric air in between. In comparison, flight 39, which flew through the subtropical filament and the ULTF one day earlier, sampled tropospheric air (O3 value around 40 ppbv) during about 375 km between these two structures (Fig. 3b). Therefore, it turns out that the Rossby wave breaking comes with a meridional contrac-25
tion and a zonal stretching of conservative parameters (PV, ozone) in the subtropical region. It is noticeable that the time response of the ozone instrument is short enough to still distinguish the two features on flight 41, indicating that mixing processes had not yet smoothed the strong ozone gradients forced by large horizontal shears during the
ACPD
5, 10301–10337, 2005Stratospheric intrusions
A. Carr ´e et al.
Title Page Abstract Introduction Conclusions References Tables Figures J I J I Back Close
Full Screen / Esc
Print Version
Interactive Discussion
EGU
zonal stretching.
Figure9presents a comparison along the northward out-bound part of flight 41 (be-tween marks 1 and 2 shown on Fig.2c) between the ozone Lidar vertical profile time series (graph a) and Meso-NH-C vertical cross-sections of PV (graph b) and ozone (graph c), and with ECMWF vertical cross-sections of PV (graph d) and RDFPV (graph 5
e). Lidar O3 measurements are presented all along the flight (hence the symmetrical shape of the ozone field), but we focus only on the second part between marks 1–2 to compare with other graphs. Even averaged at the time resolution of the Lidar mea-surements, ozone in-situ measurements (bottom coloured line on graph a) still show the crossing of the subtropical filament (between 08:48 and 08:54 UTC) followed by 10
the crossing of the ULTF (at 09:00 UTC). Although the interruptions of measurements and the presence of aerosol put a strain on the continuity of Lidar measurements, combining the north- and southward outbounds of the flight lead to the statement that the ULTF observed at the in-situ level slopes northwards up to the tropopause level at about 14.5 km altitude, giving it a vertical depth of about 4 km. The time resolution of 15
the Lidar does not allow to clearly separate the ULTF from the subtropical filament (as done by the in-situ instrument), but again, the vertical resolution of the Lidar confirms that the subtropical filament is rooted of the stratosphere.
Both Meso-NH-C (Fig.9c) and the RDF technique (Fig. 9e) succeed to coarsly re-produce the vertical structure of the ULTF, yet with an advantage of the RDF PV as far 20
as the tip of tropospheric air stuck between the ULTF and the subtropical filament is concerned. Both of the two tools also suggest the presence of the subtropical filament at flight level, but neither of the two shows its extraction of the stratospheric reservoir.
To conclude, we show in that section that the numerous stratospheric intrusions sam-pled during the PICO3 campaign are filamentary structures associated to the RWB 25
linked to the upper-level trough and to an ageing subtropical vortex. Meso-NH simu-lations, ECMWF analyses and RDF technique complete the in-situ and Lidar O3 mea-surements to document their 2-D structures in horizontal or vertical view. We show the ability of Meso-NH simulations to reproduce these filamentary structures and the
con-ACPD
5, 10301–10337, 2005Stratospheric intrusions
A. Carr ´e et al.
Title Page Abstract Introduction Conclusions References Tables Figures J I J I Back Close
Full Screen / Esc
Print Version
Interactive Discussion
EGU
tribution of the RDF technique to provide a better high-resolution stratospheric tracer field to describe the fine resolution of such filaments, as long as integration time is not too large.
3. Reversibility of stratosphere-troposphere transport
We focus here on the STT associated to each stratospheric structure highlighted in the 5
previous section. The method is based on the use of the Lagrangien tracers available in Meso-NH simulations and developed by Gheusi and Stein (2002). We already have presented results from Meso-NH backward trajectories, but this Lagrangian tool also permit to perform forward trajectories. In that case, Meso-NH trajectories track the evolution of a set of Lagrangian parcels that are initially in a 3-D box at a time taken 10
as the “initial” time. It gives also the ability to track the evolution of fields like PV, O3 . . . for the parcels situated at the top of the plume. The Lagrangian technique used in Meso-NH is based on Eulerian passive tracers which are the initial coordinates (deter-mined at an arbitrary initial time) of air parcels. These initial coordinates are passive scalars driven by the flow: their evolution is governed by the advection equation. But 15
as the advection equation is dicretized into finite elements, it implies that the passive tracer fields experience not only advection (as is the case for LAGRANTO trajectories from ECMWF), but also sub-grid turbulent and convective transports through the cor-responding parametrizations in Meso-NH. Sub-grid turbulence is parametrized with a 1-D, 1.5-order scheme using the turbulent kinetic energy as a prognostic value (Cuxart 20
et al., 2000); subgrid convection is parametrized with a 1-D mass flux sheme (Bechtold et al., 2001). This method provides a response to the limitations of the LAGRANTO tra-jectories calculated from ECMWF analyses, due to the absence of sub-grid transport parametrization in the trajectory computation and from time and space interpolations of coarse wind fields (Gheusi and Stein, 2002).
ACPD
5, 10301–10337, 2005Stratospheric intrusions
A. Carr ´e et al.
Title Page Abstract Introduction Conclusions References Tables Figures J I J I Back Close
Full Screen / Esc
Print Version
Interactive Discussion
EGU
3.1. Tropopause fold and the subtropical filament
In the previous section, we saw from the Meso-NH simulations (backward trajectories) as well as the RDF results, that ozone maxima recorded during flight 40 take-off had a stratospheric origin through a tropopause folding process. In favour of the irreversibility of the STT of these air parcels are forward trajectories (not shown) that demonstrated 5
that no dynamic agent was available to make them re-integrate the lower stratosphere after they had subsided 7 km beneath the subtropical tropopause. At the time of the observation, their residence time in the troposphere exceeded 12 h, which, according to James et al. (2003b), is a threshold beyond which irreversible transport impacts on the tropospheric ozone budget and upper-troposheric chemistry.
10
It was clear from the Lidar observations shown at the previous section that the sub-tropical filament has been irreversibly extracted from the stratosphere: the rooted fil-ament intrusion is observed at flight 37, 39 and 41, thus during 4 consecutive days. Considering these flight paths (Fig. 1), it illustrates also its eastward streching dur-ing the filamentary process associated to the strongest zonal state of the subtropical 15
jet during this period. Meso-NH forward trajectories (not shown) confirm that the air parcels of the subtropical filament are subject to irreversible STT.
3.2. Upper-level trough filament and its intrusion
The ULTF was sampled during PICO3 flights 39, 40 and 41 at cruising altitude. For each flight, the associated ozone concentration was higher than 80 ppbv. To focus 20
on the fate of these ozone-rich air parcels with regard to the STT, we used Meso-NH forward trajectories.
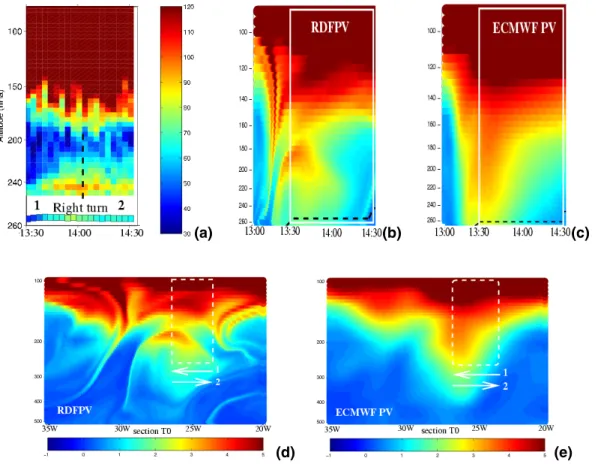
The localisation of a box F that captures ozone-rich air parcels of the ULTF observed during flight 39 is shown on Fig.10. For convenience, the plume of air parcels in that box is called plume F. This plume F is contained in a box with a horizontal extension of 25
about 200 km×100 km and a vertical extension of 1.7 km. It emerges from the time evo-lution (Fig.11) that air parcels in box F have two distinct types of behaviour: i) plume
ACPD
5, 10301–10337, 2005Stratospheric intrusions
A. Carr ´e et al.
Title Page Abstract Introduction Conclusions References Tables Figures J I J I Back Close
Full Screen / Esc
Print Version
Interactive Discussion
EGU
1F seen along the Sect. 1 (graph c) moves southward and spreads in the zonal direc-tion, while ii) plume 2F seen along the section 2 (graph d) moves southeastward and spreads in the meridional direction. The western part of plume 1F is embedded in the anticyclonic circulation (so moves westward) and the eastern part is embedded in the polar jet circulation. Such a deformation by the large scale wind field can be detected 5
on the PV evolution (Figs.1c and d), and is directly associated with the Rossby Wave Breaking. These particles, along Sect. 1 (Fig.11c and d), were situated well under the tropopause level at 2 pvu, around 11.8 km (Fig.11d, dashed pink line) on 21 October. They subsided by at least 1.5 km on 21 October (Figs.11d and f), and the farther west-ward they were situated, the earlier the subsidence began (see the diagonal shape 10
of the left side of the plume on graphs b, d, f). This movement is accompanied by a loss of modeled O3 concentration (at least for the top of the plume), which reaches 40 ppbv on 21 October at 03:00 UTC, and also by a loss of PV which varies between 0 and 0.4 pvu at this date (not shown). These elements indicate an irreversible transport over a significant time (more than twenty hours) certainly associated with a mixing of 15
tropospheric air.
For plume 2F, we observe fast transport of air parcels embedded in the polar jet. Air parcels were situated over Spain on 21 October at 09:00 UTC (Fig.11e). During this transport, concentrations of O3 (about 70 ppbv) tend to be conserved, as do PV values (about 1.5 pvu, not shown). The Sect. 2 (Fig. 11f) is situated along plume 2F, 20
elongated meridionally around the Greenwich meridian. We observe that air parcels stay at about the same altitude and are situated below or above the tropopause at 2 pvu around 11.8 km. The bottom part of plume 2F, situated around 11 km, is made of air parcels clearly situated in the upper troposphere, where PV values are less than 1 pvu (not shown). It highlights an irreversible transport of stratospheric air into the 25
troposphere, with air parcels transported into the troposphere from the ULTF over a period of 21 h from 20 October 12:00 UTC to 21 October 09:00 UTC.
For air parcels of plume 2F that are situated around 11.8 km, irreversible transport is not demonstrated. In fact, the upper part of this plume is situated just around the 2 pvu
ACPD
5, 10301–10337, 2005Stratospheric intrusions
A. Carr ´e et al.
Title Page Abstract Introduction Conclusions References Tables Figures J I J I Back Close
Full Screen / Esc
Print Version
Interactive Discussion
EGU
isoline, with PV values between 1.2 and 2.4 pvu. For these air parcels, initially situated in the southern part of the ULTF, a possible return into the stratosphere may occur later on.
Thus, even if a reversible transport may occured, we see that a major part of the ULTF presents an irreversible transport from the stratosphere to the troposphere. 5
Discussing the intrusion of the ULTF into the troposphere (Figs.5 and 7), we have seen that the intrusion descends as low as 8 km altitude, as observed during the land-ing of flight 39 (Fig.7c). We investigated the time evolution of this stratospheric intru-sion by computing Meso-NH forward plumes from a 3-D box situated in the intruintru-sion on 20 October at 12:00 UTC. We chose a box extending from 8.6 to 9.6 km. For the 10
sake of brevity, we do not show the corresponding plots because the method is the same as for the previous section. The forward plume shows a transport at the local scale for this intrusion until 21 October, 09:00 UTC. Air parcels stay in the vicinity of the Canary Islands. The plume evolves with a slight anticyclonic movement, a mean PV decreasing to 0.4 pvu and a descent into the upper troposphere about 1 km deep. 15
It is concluded that the intrusion of the ULTF is irreversible and acts as a source for the ozone budget in the upper troposphere.
4. Conclusions
This study analysed in-situ and Lidar observations of the airborne PICO3 campaign over the Canary Islands during a mid-latitude Rossby wave-breaking and its interac-20
tion with the subtropical jet. PICO3 campaign succeeds to capture high-resolution stratospheric-origin filament structures and several events of stratosphere-troposphere transport have been examined. The series of 4 flights analysed involves i) a tropopause folding process, ii) the filamentation of the upper-level trough consecutive to the Rossby wave-breaking event, iii) the further deep tropospheric intrusion of the latter filamen-25
tary structure, and iv) the evolution along the subtropical jet of a subtropical vortex core towards a subtropical filament under the large scale deformation effect of the
ACPD
5, 10301–10337, 2005Stratospheric intrusions
A. Carr ´e et al.
Title Page Abstract Introduction Conclusions References Tables Figures J I J I Back Close
Full Screen / Esc
Print Version
Interactive Discussion
EGU
Rossby wave-breaking. To investigate the three-dimensional fine scale structure of all structures we have used two numerical models. Anomalously high tropospheric ozone in-situ and Lidar observations were interpreted by reconstruction of the fine scale struc-tures in potential vorticity using the Reverse Domain Filling (RDF) technique applied to ECMWF analyses. The RDF technique is particularly suitable to capture the potential 5
vorticity signatures associated with STE. The comparison of the model results using a stratospheric tracer and online chemistry with ozone in-situ observations indicate that the model is crudely consistent with the filamentary structures found. We show that the RDF technique complete these data with the stratospheric tracer finest scale showing the best agreement with observations.
10
We took advantage of the Meso-NH simulation to document the irreversible nature of the stratosphere-troposphere transport of air parcels involved in filaments. Modelled internal backward and forward trajectory calculations show totally irreversible transport for the tropopause fold and the tropospheric intrusion of the upper-level trough filament, and major irreversible transport for the upper-level trough. The subtropical filament 15
presents also totally irreversible transport, as directly demonstrated by the O3 Lidar measurements. A large impact of filamentary structures left behind a Rossby wave-breaking on to the budget of the upper-level tropospheric ozone in the subtropics can be anticipated from our results.
Acknowledgements. The authors would like to thank IDRIS for allocating computer ressources,
20
Meteo-France for providing MOCAGE analysis initializing Meso-NH-C, INSU-DT and IGN for the airborne infrastructures, and ECMWF for providing the analyses. Also, we thank C. Mari for helping in Meso-NH simulations and J.-P. Chaboureau, P. N ´ed ´elec and R. Scott for assisting in the operation of the campaign. We express our appreciation to the Mystere 20 flight crew for their dedication in making PICO3 observations.
ACPD
5, 10301–10337, 2005Stratospheric intrusions
A. Carr ´e et al.
Title Page Abstract Introduction Conclusions References Tables Figures J I J I Back Close
Full Screen / Esc
Print Version
Interactive Discussion
EGU
References
Ancellet, G. and Ravetta, F.: Compact airborne lidar for tropospheric ozone (ALTO): description and field measurements, Appl. Opt., 37, 5509–5521, 1998.
Appenzeller, C., Holton, J. R., and Norton, W. A.: Fragmentations of stratospheric intrusions, J. Geophys. Res., 101, 1435–1456, 1996a.
5
Baray, J.-L., Baldy, S., Diab, R. D., and Cammas, J.-P.: Dynamical study of a tropical cut-off low over South Africa and its impact on tropospheric ozone, Atmos. Environ., 37, 1475–1488, 2003.
Bechtold, P., Kain, J., Bazile, E., Mascart, P., and Richard, E.: A mass flux convection scheme for regional and global models, Quart. J. Roy. Meteor. Soc., 127, 869–886, 2001.
10
Bell, G. D., and Keyser, D.: Shear and curvature vorticity and potential-vorticity interchanges: Interpretation and application to a cutoff cyclone event, Mon. Wea. Rev., 121, 76–102, 1993. Crassier, V., Suhre, K., Tulet, P., and Rosset, R.: Development of a reduced chemical scheme
for use in mesoscale meteorological models, Atmos. Environ., 34, 2633–2644, 2000. Crutzen, P., Lawrence, M., and P ¨oschl, U.: On the background photo chemistry of tropospheric 15
ozone, Tellus, 51, 123–146, 1999.
Cuxart, J., Bougeault, P., and Redelsperger, J.-L.: A turbulence scheme allowing for mesoscale and large-eddy simulations, Quart. J. Roy. Meteor. Soc., 126, 1–30, 2000.
Danielsen, E. F.: Stratospheric-tropospheric exchange based on radioactivited, ozone and po-tential vorticity, J. Atmos. Sci., 25, 502–518, 1968.
20
Gheusi, F. and Stein, J.: Lagrangian description of air-flows using Eulerian passive tracers, Quart. J. Roy. Meteor. Soc., 128, 337–360, 2002.
Gouget, H., Vaughan, G., Marenco, A., and Smit, H. G. J.: Decay of a cut-off low and contri-bution to stratosphere-troposphere exchange, Quart. J. Roy. Meteor. Soc., 126, 1117–1141, 2000.
25
Hauglustaine, D. A., Brasseur, G. P., Waters, S., Rasch, P. J., Muller, J.-F., Emons, L. K., and Carroll, M. A.: MOZART, a global chemical transport model for ozone and related chemical tracers, Part 2: Model results and evaluation, J. Geophys. Res., 103, 28 291–28 335, 1998. Hegglin, M. I., Brunner, D., Wernli, H., Schwierz, C., Martius, O., Hoors, P., Fisher, H., Spelten,
N., Schiller, C., Krebsbach, M., Parchatka, U., Weers, U., Staehelin, J., and Peter, T.: Tracing 30
troposphere-to-stratosphere transport above a mid-latitude deep convective system, Atmos. Chem. Phys. Discuss., 4, 169–206, 2004,
ACPD
5, 10301–10337, 2005Stratospheric intrusions
A. Carr ´e et al.
Title Page Abstract Introduction Conclusions References Tables Figures J I J I Back Close
Full Screen / Esc
Print Version
Interactive Discussion
EGU
SRef-ID: 1680-7375/acpd/2004-4-169.
Hoerling, M. P., Schaack, T. K., and Lenzen, A. J.: Global objective tropopause analysis, Mon. Wea. Rev., 119, 1816–1831, 1991.
Holton, J. R., Haynes, P. H., McIntyre, M. E., Douglass, A. R., Rood, R. B., and Pfister, L.: Stratosphere-Troposphere Exchange, Reviews of Geophysics, 33, 403–439, 1995.
5
Hoskins, B. J., McIntyre, M. E., and Robertson, A. W.: On the use and significance of isentropic potential vorticity maps, Quart. J. Roy. Meteor. Soc., 111, 877–946, 1985.
James, P., Stohl, A., Forster, C., Eckhardt, S., Seibert, P., and Frank, A.: A 15-year climatol-ogy of stratosphere-troposphere exchange with a Lagrangian particle dispersion model: 1, Methodology and validation, J. Geophys. Res., 108(D12), 8519, doi:10.1029/2002JD002637, 10
2003a.
James, P., Stohl, A., Forster, C., Eckhardt, S., Seibert, P., and Frank, A.: A 15-year climatology of stratosphere-troposphere exchange with a Lagrangian particle dispersion model: 2, Mean climate and seasonal variability, J. Geophys. Res., 108(D12), 8522, doi:10.1029/2002JD002639, 2003b.
15
Keyser D. and Shapiro, M. A.: A review of the structure of upper-level frontal zones, Mon. Wea. Rev., 114, 452–499, 1986.
Lafore, J. P., Stein, J., Asencio, N., Bougeault, P., Ducrocq, V., Duron, J., Fischer, C., H ´ereil, P., Mascart, P., Masson, V., Pinty, J. P., Redelsperger, J. L., Richard, E., and Vil `a-Guerau de Arellano, J.: The Meso-NH Atmospheric Simulation System, Part I: adiabatic formulation 20
and control simulations, Ann. Geophys., 16, 90–109, 1998, SRef-ID: 1432-0576/ag/1998-16-90.
Marenco, A., Thouret, V., N ´ed ´elec, P., Smit, H., Helten, G. M., Kley, D., Karcher, F., Simon, P., Law, K., Pyle, J., Poschmann, G., Von Wrede, R., Hume, C., and Cook, T.: Measurement of ozone and water vapour by Airbus in-service aircraft : The MOZAIC airborne program, an 25
overview, J. Geophys. Res., 103, 25 631–25 642, 1998.
Morcrette, J.-J.: Radiation and cloud radiative properties in the European Center for Medium range Weather Forcasts operational weather forecast system, J. Geophys. Res., 96, 9121– 9132, 1991.
Postel, G. A. and Hitchman, M. H.: A climatology of Rossby wave breaking along the subtropical 30
tropopause, J. Atmos. Sci., 56, 359–373, 1999.
Scott, R. K., Cammas, J.-P., Mascart, P., and Stolle, C.: Stratospheric filamentation into the upper tropical troposphere, J. Geophys. Res., D106, 11 835–11 848, 2001.
ACPD
5, 10301–10337, 2005Stratospheric intrusions
A. Carr ´e et al.
Title Page Abstract Introduction Conclusions References Tables Figures J I J I Back Close
Full Screen / Esc
Print Version
Interactive Discussion
EGU
Schoeberl, M. R. and Newman, P. A.: A multiple-level trajectory analysis of vortex filaments, J. Geophys. Res., 100, 25 801–25 815, 1995.
Sprenger, M., Croci Maspoli, M., and Wernli, H.: Tropopause folds and cross-tropopause trans-port: A global investigation based upon ECMWF analyses for the time period March 2000 to February 2001, J. Geophys. Res., 108(D12), 8518, doi:10.1029/2002JD002587, 2003. 5
Stohl, A.: A 1-year Lagrangian climatology of airstreams in the Northern Hemisphere tropo-sphere and lowermost stratotropo-sphere, J. Geophys. Res., 106, 7263–7279, 2001.
Sutton, R., Maclean, H., Swinbank, R., O’Neill, A., and Taylor, F. W.: High-resolution strato-spheric tracer fields estimated from satellite observations using lagrangian trajectory calcu-lations, J. Atmos. Sci., 51, 2995–3005, 1994.
10
Thorncroft, C. D., Hoskins, B. J., and McIntyre, M. E.: Two paradigms of baroclinic-wave life cycle behaviour, Quart. J. Roy. Meteor. Soc., 119, 17–55, 1993.
Waugh, D. W. and Polvani, L. M.: Climatology of intrusions into the tropical upper troposphere, Geophys. Res. Lett., 27, 3857–3860, 2000.
Wei, M.-Y: A new formulation of the exchange of mass and trace constituents between the 15
stratosphere and troposphere, J. Atmos. Sci., 44, 3079–3086, 1987.
Wernli, H. and Bourqui, M.: A Lagrangian 1-year climatology of (deep) cross-tropopause exchange in the extratropical Northern Hemisphere, J. Geophys. Res., 107(D2), 4021, doi:10.1029/2001JD000812, 2002.
Wernli, H. and Davies, H. C.: A Lagrangian-based analysis of extratropical cyclones, I, The 20
method and some applications, Quart. J. Roy. Meteor. Soc., 123, 467-489, 1997.
Wirth, V. and Egger, J.: Diagnosing extratropical synoptic-scale stratosphere-troposphere ex-change: A case study, Quart. J. Roy. Meteor. Soc., 126, 635–656, 1999.
ACPD
5, 10301–10337, 2005Stratospheric intrusions
A. Carr ´e et al.
Title Page Abstract Introduction Conclusions References Tables Figures J I J I Back Close
Full Screen / Esc
Print Version
Interactive Discussion
EGU
Table 1. Occurrence of PICO3 flights and associated stratospheric structures sampled.
Date 18 Oct. 2000 20 Oct. 2000 21 Oct. 2000
Flight and 37 (13:00 to 16:00 UTC) 39 (14:15 to 17:00 UTC) 41 (07:15 to 09:45 UTC)
Hours 40 (18:00 to 19:30 UTC)
Stratospheric subtropical vortex trough and subtropical filaments (39) trough and subtropical filaments
ACPD
5, 10301–10337, 2005Stratospheric intrusions
A. Carr ´e et al.
Title Page Abstract Introduction Conclusions References Tables Figures J I J I Back Close
Full Screen / Esc
Print Version
Interactive Discussion
EGU
(a) (b)
(c) (d)
Fig. 1. ECMWF analyses at 12:00 UTC from 18 October (a) to 21 October 2000 (d): evolution
of PV distribution (pvu) at 250 hPa with the horizontal wind vectors superposed (largest vectors indicate a horizontal wind of about 70 m/s). The trajectory of flight 37 is indicated on the 18 Oc-tober picture (white line, graph a), as are the paths of flights 39 (in red) and 40 (in white) on the 20 October graph(c), and the path of flight 41 (in dark pink) on the 21 October graph (d).
White lines on gaphs (a) and (c) represent the location of cross sections noted T0 and T1 wich will be discussed in next sections.
ACPD
5, 10301–10337, 2005Stratospheric intrusions
A. Carr ´e et al.
Title Page Abstract Introduction Conclusions References Tables Figures J I J I Back Close
Full Screen / Esc
Print Version
Interactive Discussion
EGU
(a) (b)
(c)
Fig. 2. Flight paths over the Canary Islands during PICO3 campaign on Meso-NH field (in pvu)
at 11 km altitude:(a) Flight 39 over PV field at 15:00 UTC on 20 October. (b) Flight 40 over PV
field at 18:00 UTC on 20 October.(c) Flight 41 over PV field at 09:00 UTC on 21 October. The
real time occurrence of each flight is reported at the top of each graph. The lines S-N (graph a); T2 (graph b) and marks I, J (graph a); a, b (graph b) and 1, 2 (graph c) will be used in the next sections.
ACPD
5, 10301–10337, 2005Stratospheric intrusions
A. Carr ´e et al.
Title Page Abstract Introduction Conclusions References Tables Figures J I J I Back Close
Full Screen / Esc
Print Version
Interactive Discussion
EGU
(a) (b)
(c) (d)
Fig. 3. (a): In-situ O3concentrations (ppbv every 4 s) plotted in green during F37. (b), (c) and (d): In-situ O3 concentrations (ppbv) plotted in green during F39, F40 and F41, respectively, compared to the O3 simulated by Meso-NH-C (in blue). The frequency is that of Meso-NH: every 30 s. The altitude (km) of each flight is plotted in black. The horizontal axis gives the time in hours.
ACPD
5, 10301–10337, 2005Stratospheric intrusions
A. Carr ´e et al.
Title Page Abstract Introduction Conclusions References Tables Figures J I J I Back Close
Full Screen / Esc
Print Version
Interactive Discussion
EGU
(a)
(b) (c)
Fig. 4. (a): Vertical profile of in-situ O3(ppbv) during the take-off of flight 40, at 18:15 UTC. We
investigate strong variations labelled Max1, Max2 (maximum) and Min1 (minimum).(b) and (c):
Meso-NH PV (pvu) on 20 October, 06:00 UTC showing the structure of a tropopause fold on a zonal vertical cross-section (in meters) (b) and on a horizontal plane at 8272 m (c). This is the altitude of the air parcel marked by a red cross situated in the fold at this date. At 18:00 UTC, the red air parcel corresponds to the maximum of O3 labelled Max1. Red line indicates the location of the cross-section. Isolines of potential temperature (K) are plotted on graph (b). Dark box labelled F shows the trough filament discussed in Sect. 2.2.
ACPD
5, 10301–10337, 2005Stratospheric intrusions
A. Carr ´e et al.
Title Page Abstract Introduction Conclusions References Tables Figures J I J I Back Close
Full Screen / Esc
Print Version
Interactive Discussion
EGU
(a) (b)
(c)
Fig. 5. (a) and (b): Meso-NH-C vertical cross sections (from South to North) on 20 October,
2000 at 15:00 UTC along the line drawn on Fig.2a. This section is along the trajectory of flight 39 and includes marks I, J. (a) O3 field (ppbv). (b) PV field (pvu). Altitude is in m. Black lines show isolines of potential temperature (K).(c): Lidar O3 measurement (ppbv) time series during flight 39 between 15:00 UTC and 16:40 UTC. The vertical extension is in km. The dotted colored line indicates the in-situ measurements at the altitude of the aircraft, at the Lidar resolution. The white dashed boxes on the three graphs show the same section of the atmosphere between marks I, J along the flight 39 path.
ACPD
5, 10301–10337, 2005Stratospheric intrusions
A. Carr ´e et al.
Title Page Abstract Introduction Conclusions References Tables Figures J I J I Back Close
Full Screen / Esc
Print Version
Interactive Discussion
EGU
(a) (b)
(c) (d)
Fig. 6. (a): Lidar O3measurement (ppbv) time series during flight 40 from 18:30 to 19:20 UTC along path “a–b” (Fig.2b). The vertical extension is between 11 and 17 km altitude. The dotted colored line indicates the O3 in-situ measurement at the altitude of the aircraft, at the Lidar resolution. The dotted black box corresponds to the vertical cross-section extension of graph
(b). (b): O3field (ppbv) from Meso-NH-C along a part of flight 40, on the 20 0ctober, 18:00 UTC. Altitude is in km.(c): RDFPV vertical cross-section along the same section of the atmosphere
as on graph (a) (flight 40 “a–b”). The vertical extension is in pressure level between 260 and 90 hPa, which corresponds to an extension of around 10.5–17 km. Integration time is 24 h, from the ECMWF analysis on 20 October, 18:00 UTC.(d): Corresponding PV from ECMWF
analysis on 20 October, 18:00 UTC. Horizontal axis (b, c, d) indicates hours but these times are provided simply for comparison with the time-evolving Lidar measurements. The dashed black line indicates the approximative flight path altitude.
ACPD
5, 10301–10337, 2005Stratospheric intrusions
A. Carr ´e et al.
Title Page Abstract Introduction Conclusions References Tables Figures J I J I Back Close
Full Screen / Esc
Print Version
Interactive Discussion
EGU
(a) (b)
(c)
Fig. 7. Zonal vertical cross-sections of PV (pvu) on 20 October 2000, at 12:00 UTC (a) along
section “T1” (Fig.1c) and at 18:00 UTC(b) along section “T2” (Fig.2b). (c) In-situ sounding
of O3 concentration (ppbv) during flight 39 landing. White cross indicates the location into the ULTF of the air parcel corresponding to the maximum M, as seen by Meso-NH backward trajectories.
ACPD
5, 10301–10337, 2005Stratospheric intrusions
A. Carr ´e et al.
Title Page Abstract Introduction Conclusions References Tables Figures J I J I Back Close
Full Screen / Esc
Print Version
Interactive Discussion
EGU
(a) (b) (c)
(d) (e)
ACPD
5, 10301–10337, 2005Stratospheric intrusions
A. Carr ´e et al.
Title Page Abstract Introduction Conclusions References Tables Figures J I J I Back Close
Full Screen / Esc
Print Version
Interactive Discussion
EGU
Fig. 8. (a): Lidar O3 measurement (ppbv) time series during the part of flight 37 from 13:30 to 14:30 UTC. The vertical extension is between 260 and 90 hPa on logarithmic scale (it is about from 11 to 17 km). The dotted colored line indicates the O3in-situ measurements at the altitude of the aircraft, at the Lidar resolution. The white box show the section corresponding to the Lidar O3obersvations.(b): corresponding RDFPV (pvu) vertical cross-section along the
flight 37 between 13:00 and 14:30 UTC from the PV of ECMWF analysis on 18 October 2000 at 15:00 UTC(c). The white box corresponds to the Lidar O3vertical section. Horizontal axis (b, c) indicates hours but these times are provided simply for comparison with the time-evolving Lidar measurements. The dashed black line indicates the approximative flight path altitude.(d):
RDFPV along the zonal cross-section T0 plotted on Fig.1a from the PV of ECMWF analysis on 18 October 2000 at 15:00 UTC(d) plotted along section T0. Dashed white box show the
ACPD
5, 10301–10337, 2005Stratospheric intrusions
A. Carr ´e et al.
Title Page Abstract Introduction Conclusions References Tables Figures J I J I Back Close
Full Screen / Esc
Print Version
Interactive Discussion
EGU
(a)
(b) (c)
ACPD
5, 10301–10337, 2005Stratospheric intrusions
A. Carr ´e et al.
Title Page Abstract Introduction Conclusions References Tables Figures J I J I Back Close
Full Screen / Esc
Print Version
Interactive Discussion
EGU
(d) (e)
Fig. 9. Vertical cross-sections along the northward, out-bound part of flight 41, along the
section “1–2” (Fig. 2c). (a): Lidar O3 vertical profile time series (ppbv). The vertical scale is in lnP between 260 (10.5 km) and 100 hPa (16 km). The bottom colored line shows O3 in-situ measurements (ppbv) averaged at the O3 Lidar time resolution. (b) and (c): Meso-NH-C
fields on 21 October, at 09:00 UTC, with PV (pvu) (b and O3 (ppbv) (c). Horizontal scale is the distance in meters along the cross-section. (d): PV (pvu) from ECMWF analysis on 21
October, at 09:00 UTC.(e): RDFPV (pvu) from the same analysis, with an integration time of
24 h. Horizontal scale represents longitude along the section here. Dashed black line indicates the altitude of the aircraft, around 11 km.
ACPD
5, 10301–10337, 2005Stratospheric intrusions
A. Carr ´e et al.
Title Page Abstract Introduction Conclusions References Tables Figures J I J I Back Close
Full Screen / Esc
Print Version
Interactive Discussion
EGU
(a) (b)
Fig. 10. Location of the initial 3-D box F taken in the ULTF on 20 October, 12:00 UTC for
computation of a Meso-NH forward plume. (a): Meso-NH PV field (pvu) at 11 km. Horizontal
wind is superimposed and plotted as vectors (the largest represent a wind of about 70 m/s).
ACPD
5, 10301–10337, 2005Stratospheric intrusions
A. Carr ´e et al.
Title Page Abstract Introduction Conclusions References Tables Figures J I J I Back Close
Full Screen / Esc
Print Version
Interactive Discussion
EGU
(a) (b)
(c) (d)
ACPD
5, 10301–10337, 2005Stratospheric intrusions
A. Carr ´e et al.
Title Page Abstract Introduction Conclusions References Tables Figures J I J I Back Close
Full Screen / Esc
Print Version
Interactive Discussion
EGU
(e) (f)
Fig. 11. Forward plume of air parcels computed by Meso-NH-C on 20 October at 12:00 UTC.
The plume evolution is plotted, from top to bottom, on 20 October at 18:00 UTC(a, b), on 21
October at 03:00 UTC(c, d) and at 09:00 UTC (e, f). Graphs (a), (c), (e): plume on horizontal
projection, colour-coded with O3(ppbv) of air parcels at the top of the plume (i.e. at the point of the maximum altitude air parcel in the plume on a given vertical). Graphs (b), (d), (f): plume in a vertical W-E section (b, d) or S-N section (f). On graphs (d, f), the pink dashed line at 11.8 km represents the tropopause at 2 pvu. Locations of Sects. 1 and 2 plotted on graphs (c), (e) are reported on graphs (d) and (f), respectively.