HAL Id: hal-01962754
https://hal.laas.fr/hal-01962754
Submitted on 20 Dec 2018
HAL is a multi-disciplinary open access
archive for the deposit and dissemination of
sci-entific research documents, whether they are
pub-lished or not. The documents may come from
teaching and research institutions in France or
abroad, or from public or private research centers.
L’archive ouverte pluridisciplinaire HAL, est
destinée au dépôt et à la diffusion de documents
scientifiques de niveau recherche, publiés ou non,
émanant des établissements d’enseignement et de
recherche français ou étrangers, des laboratoires
publics ou privés.
using PostMark ™ Workloads *
Karama Kanoun, Yves Crouzet, Ali Kalakech, Ana-Elena Rugina, Philippe
Rumeau
To cite this version:
Karama Kanoun, Yves Crouzet, Ali Kalakech, Ana-Elena Rugina, Philippe Rumeau. Benchmarking
the Dependability of Windows and Linux using PostMark ™ Workloads *. 16th IEEE International
Symposium on Software Reliability Engineering, ISSRE 2005, Nov 2005, Chicago, United States.
pp.11-20. �hal-01962754�
Benchmarking
the Dependability of Windows and Linux
using PostMark
™Workloads
*Karama Kanoun, Yves Crouzet, Ali Kalakech, Ana-Elena Rugina and Philippe Rumeau
LAAS-CNRS, 7, Avenue Colonel Roche 31077 Toulouse Cedex 4, France
[email protected]
Abstract
This paper presents a dependability benchmark for general-purpose operating systems and its application to six versions of Windows operating system and four versions of Linux operating system. The benchmark measures are: operating system robustness (as regards possible erroneous inputs provided by the application software to the operating system via the application programming interface), reaction and restart times in the presence of faults. The workload is PostMark, a file system performance benchmark for operating systems.
1. Introduction
Software is playing an increasingly important role in our day-to-day life. In particular, operating systems (OSs) are more and more used even in critical application domains. Choosing the operating system that is best adapted to one’s needs is becoming a necessity. For a long time, performance was the main selection criterion for most users and several performance benchmarks were developed and are widely used. However, an OS should not only have good performance but also a high dependability level. Dependability benchmarks emerged as a consequence. Their role is to provide useful information regarding the dependability of software systems [4-6, 24, 25]. This paper is devoted to the specification, application and validation of a dependability benchmark of OSs using PostMark, a file system performance benchmark, as the workload.
An OS dependability benchmark is intended to objectively characterize the OS behavior in the presence of faults. Its results are intended i) to characterize qualitatively and quantitatively the OS behavior in the presence of faults and ii) to evaluate performance-related measures in the presence of faults. Our dependability benchmark is a robustness benchmark. Robustness is defined as the degree to which a system operates correctly
* This work is partially supported by the European Commission - IST
DBench project (IST-2000-25425) http://www.laas.fr/DBench/
in the presence of exceptional inputs or stressful environmental conditions. Robustness of OS can be viewed as its capacity to resist/react to faults induced by the applications running on top of it, or originating from the hardware layer or from device drivers. In this paper we address the OS robustness as regards possible erroneous inputs provided by the application software to the OS via the Application Programming Interface (API). More explicitly, we consider corrupted parameters in system calls. For sake of conciseness, such erroneous inputs are shortly referred to as faults.
To be meaningful under acceptable conditions, a dependability benchmark should satisfy a set of properties. For example, a benchmark must be representative, reproducible, repeatable, portable and cost effective. These properties should be taken into consideration from the earliest phases of the benchmark specification as they have a deep impact on almost all benchmark components. Verification of the benchmark key properties constitutes a large part of the benchmark validation. The last section of the paper will outline the main benchmark properties that are meaningful to the current benchmark, and briefly show what has been achieved to ensure them.
The work reported in this paper is part of the European project on Dependability Benchmarking, DBench [3, 13, 17]. Our previously published work on OS dependability benchmarks was based on TPC-C Client performance benchmark for transactional systems and devoted to the comparison of Windows NT4 Workstation, Windows 2000 Professional and Windows XP professional [12]. This paper extends our previous work using another performance benchmark workload, PostMark and applying the benchmark to six Windows OSs and four Linux OSs. Also, we introduce the benchmark properties and show how they have been addressed.
Several relevant attempts have already been proposed to help characterize the failure modes and robustness of software executives. A comprehensive analysis of the issues linking robustness and dependability can be found in [20]. The executives targeted in these studies encompass real time microkernels [2, 6, 9], general
purpose OSs [15, 24], as well as CORBA middleware implementations [18, 21]. The work reported in [22] addressed the robustness of the POSIX and Win32 API as in our case. However, they concentrated on OS "robustness" while we are interested in robust and non-robust behavior. Results concerning the non-robustness with respect to faults in device drivers can be found in [1, 7, 8]. The remainder of the paper is organized as follows. Section 2 gives the specification of the OS benchmark. Section 3 presents implementation prototypes developed to benchmark Windows and Linux families. Section 4 is devoted to benchmark results that are refined in Section 5. Section 6 addresses benchmark properties validation and Section 7 concludes the paper.
2. Specification of the Benchmark
A dependability benchmark should define clearly: 1) The benchmark target and the benchmarking context. 2) The benchmark measures to be evaluated and the
measurements to be performed on the system to provide the information required for obtaining them. 3) The benchmark execution profile to be used to
activate the operating system.
4) Guidelines for conducting benchmark experiments and implementing benchmark prototypes.
These items items are summarized hereafter. It is worth mentioning that the benchmark results are meaningful, useful and interpretable only if all these items are provided with the results.
2.1. Benchmarking Context
An OS can be seen as a generic software layer that manages all aspects of the underlying hardware. The OS provides i) basic services to the applications through the API and ii) communication with peripherals devices via device drivers. From the dependability benchmarking viewpoint, the benchmark target corresponds to the OS with the minimum set of device drivers necessary to run the OS under the benchmark execution profile. However, for the benchmark target to be assessed, it is necessary to run it on top of a hardware platform and to use a set of libraries. Thus, the benchmark target along with the hardware platform and libraries form the system under benchmarking. Although, in practice, the benchmark measures characterize the system under benchmarking (e.g., the OS reaction and restart times are strongly dependent on the underlying hardware), for clarity purpose we will state that the benchmark results characterize the OS.
The benchmark addresses the user perspective, i.e., it is primarily intended to be performed by (and to be useful for) someone or an entity who has no in depth knowledge about the OS and whose aim is to significantly improve her/his knowledge about its behavior in the presence of
faults. In practice, the user may well be the developer or the integrator of a system including the OS.
The OS is considered as a “black box” and the source code does not need to be available. The only required information is the description of the OS in terms of system calls (in addition of course to the description of the services provided by the OS).
2.2. Benchmark Measures
The benchmark measures include a robustness measure and two temporal measures.
After execution of a corrupted system call, the OS is in one of the states summarized in Table 1.
Table 1: OS outcomes
SEr An error code is returned
SXp An exception is raised, processed and notified SPc Panic state
SHg Hang state SNS No-signaling state
SEr: corresponds to the case where the OS generates an
error code that is delivered to the application.
SXp: corresponds to the case where the OS issues an
exception. Two kinds of exceptions can be distinguished depending on whether it is issued during the application software execution (user mode) or during execution of the kernel software (kernel mode). In the user mode, the OS processes the exception and notifies the application (the application may or may not take into account explicitly this information). However, for some critical situations, the OS aborts the application. An exception in the kernel mode is automatically followed by a panic state (e.g., blue screen for Windows and oops messages for Linux). Hence, hereafter, the latter exceptions are included in the panic state and the term exception refers only to user mode exceptions.
SPc: In the panic state, the OS is still “alive” but it is not
servicing the application. In some cases, a soft reboot is sufficient to restart the system.
SHg: In this state, a hard reboot of the OS is required. SNS: In the no-signaling state, the OS does not detect the
presence of the erroneous parameter. As a consequence, it accepts the erroneous system call and executes it. It may thus abort, hang or complete its execution. However, the response might be erroneous or correct. For some system calls, the application may not require any explicit response, so it simply continues execution after sending the system call. SNS is presumed when none of the previous outcomes (SEr, SXp, SPc, SHg) is observed. Panic and hang outcomes are actual states in which the OS can stay for a while. Conversely, SEr and SXp characterize only events. They are easily identified when the OS provides an error code or notifies an exception.
OS Robustness (POS) is defined as the percentages of
experiments leading to any of the outcomes listed in Table 1. POS is thus a vector composed of 5 elements.
Reaction Time (Texec) corresponds to the average time
necessary for the OS to respond to a system call in presence of faults, either by notifying an exception or by returning an error code or by executing the required instructions.
Restart Time (Tres) corresponds to the average time
necessary for the OS to restart after the execution of the workload in the presence of faults. Although under nominal operation the OS restart time is almost deterministic, it may be impacted by the corrupted system call. The OS might need additional time to make the necessary checks and recovery actions, depending on the impact of the fault applied.
The OS reaction time and restart time are also observed in absence of faults for comparison purpose. They are respectively denoted τexec and τres.
2.3. Benchmark Execution Profile
For performance benchmarks, the benchmark execution profile is a workload that is as realistic and representative as possible for the system under benchmarking. For a dependability benchmark, the execution profile includes, in addition, corrupted parameters in system calls. The set of corrupted parameters is referred to as the faultload. Our benchmark is defined so that the workload could be any performance benchmark workload (and, more generally, any user specific application) intended to run on top of the target OS. In our previous work, we have used the workload of TPC-C Client, [23]. We use the workload of PostMark [14]. PostMark creates a large pool of continually changing files and measures the transaction rates for a workload approximating a large Internet electronic mail server. It generates an initial pool of random text files ranging in size from a configurable low bound to a configurable high bound. The file pool is of configurable size and can be located on any accessible file system. The workload of this benchmark, referred to as PostMark for simplicity, is responsible for realizing a number of transactions. Each transaction consists of a pair of smaller transactions: i) create file or delete file and ii) read file or append file. PostMark is developed in C language. From a practical point of view PostMark needs to be compiled separately for each OS.
The faultload consists of corrupted parameters of system
calls. For Windows, system calls are provided to the OS through the Win32 environment subsystem. In Linux OSs, these system calls are provided to the OS via the POSIX API. During runtime, the workload system calls are intercepted, corrupted and re-inserted.
Depending on the OS version considered, PostMark activates between 25 and 27 Win32 system calls for Windows, and 16 or 17 POSIX system calls for Linux.
We use a parameter corruption technique relying on thorough analysis of system call parameters to define selective substitutions to be applied to these parameters (similar to the one used in [16]). A parameter is either a data or an address. The value of a data can be substituted either by an out-of-range value or by an incorrect (but not out-of-range) value, while an address is substituted by an incorrect (but existing) address (containing usually an incorrect or out-of-range data). We use a mix of these three corruption techniques.
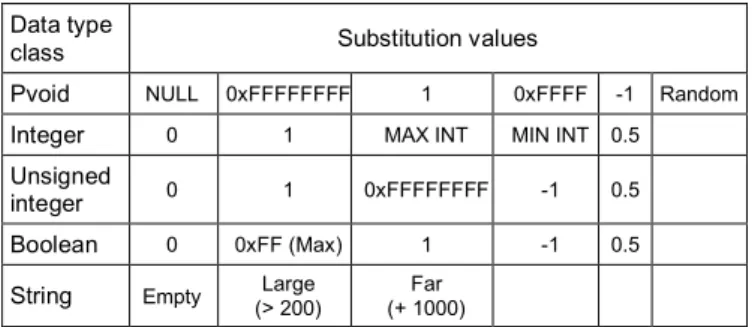
To reduce the number of experiments, the parameter data types are grouped into classes. A set of values is defined for each class. They depend on the definition of the class. Some values require a pre and a post processing such as the creation and the destruction of temporary files. For example, for Windows, we group the data types into 13 classes. Among these classes, 9 are pointer classes. Apart from pvoid (pointer which points to anything), all other pointers point to a particular data type.Substitution values for these pointers are combination of pointer substitution values and the corresponding data type substitution values. Similarly, for Linux, we group the data types into 13 classes among which 5 are pointer classes. We use the same substitution values for basic data types (i.e., integer) both for Windows and Linux. Nevertheless, some data types are system-dependent. Consequently, they have specific substitution values. In Linux, for example, we define a class corresponding to the type mode. A mode is an integer with a particular meaning: read/write modes or permission flags. As the validity domain of this data type can be identified precisely, pertinent substitution values are defined for it. Table 2 reviews the substitution values associated with the basic data type classes.
Table 2: Parameter substitution values
Data type
class Substitution values
Pvoid NULL 0xFFFFFFFF 1 0xFFFF -1 Random
Integer 0 1 MAX INT MIN INT 0.5
Unsigned
integer 0 1 0xFFFFFFFF -1 0.5 Boolean 0 0xFF (Max) 1 -1 0.5
String Empty (> 200) Large (+ 1000) Far
2.4. Benchmark Conduct
Since perturbing the operating system may lead the OS to hang, a remote machine, referred to as the benchmark controller, is required to reliably control the benchmark experiments, mainly in case of OS Hang or Panic states or workload hang or abort states (that cannot be reported by the machine hosting the benchmark target). Accordingly, for running an OS dependability benchmark we need at least two computers: i) the Target Machine for hosting the
benchmarked OS and the workload, and ii) the Benchmark Controller that is in charge of diagnosing and collecting part or all benchmark data.
The two machines perform the following functions: i) restart of the system before each experiment and launch of the workload, ii) interception of system calls with parameters, ii) corruption of system call parameters, iii) re-insertion of corrupted system calls, vi) observation and collection of OS outcomes.
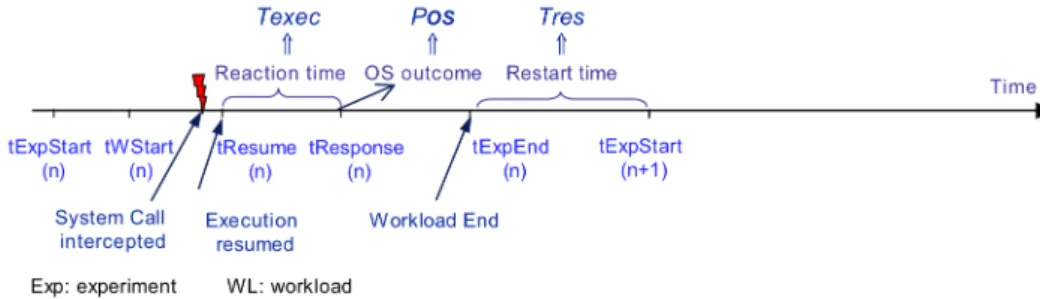
The experiment steps in case of workload completion are illustrated in Figure 1. In case of workload non-completion state (i.e., the workload is in abort or hang state), the end of the experiment is provided by a watchdog timeout as illustrated in Figure 2. The timeout duration is fixed to a value that is greater than the largest workload execution time. The timeout used is 3 times the workload execution time without faults.
3. Benchmark Implementation Prototype
Six versions of Windows OSs are targeted: Windows NT4 Workstation with SP6, Windows 2000 Professional with SP4, Windows XP Professional with SP1,Windows NT4 Server with SP6, Windows 2000 Server with SP4 and Windows 2003 Server. In the rest of this paper, Windows 2000 Professional and Windows NT4 Workstation will be referred to as Windows 2000 and Windows NT4 respectively. Four Linux OSs are targeted (Debian distribution): Linux 2.2.26, Linux 2.4.5, Linux 2.4.26 and Linux 2.6.6. Each one of them is a revision of one of the stable versions of Linux (2.2, 2.4, 2.6). Table 3 summarizes the number of system calls (SC) targeted by the benchmark experiments carried out along with the number of corresponding parameters (par) and the
number of experiments (Exp) for each OS.
To intercept Win32 functions, we used the Detours tool [10], a library for intercepting arbitrary Win32 binary functions on X86 machines. The part of Detours in charge of system call interception is composed of 30 Kilo lines of code (KLOC). The modifications we carried out on this tool concern i) the replacement of system call parameters by corrupted values (this module is 3 KLOC) and ii) the addition of modules to observe the reactions of the OS after parameter corruption, and to collect the required measurements (this module is 15 KLOC). To intercept POSIX system calls, we used another interception tool, Strace [19]. Strace is composed of 26 KLOC. Also, we added two modules to this tool to allow i) substitution of the parameters and ii) observation of Linux behavior after parameter corruption (these modules correspond to 4 KLOC together). To intercept POSIX system calls, we used another interception tool, Strace [19]. Strace is composed of 26 KLOC. Also, we added two modules to this tool to allow i) substitution of the parameters and ii) observation of Linux behavior after parameter corruption (these modules correspond to 4 KLOC together).
Table 3: Number of system calls, corrupted parameters and experiments for each OS
Windows Family Linux Family NT4 2000 XP NT4S 2000S 2003S 2.2.26 2.4.5 2.4.26 2.6.6 #SC 25 27 26 25 27 27 16 16 16 17 #Par 53 64 64 53 64 64 38 38 38 44 #Exp 418 433 424 418 433 433 206 206 206 228
Figure 3 summarizes the various components of the benchmark environment. All the experiments have been run on the same target machine, composed of an Intel Pentium III Processor, 800 MHz, and a memory of 512 Mega Bytes. The hard disk is 18 Giga Bytes, ULTRA 160 SCSI. The benchmark controller in both prototypes for Windows and Linux is a Sun Microsystems workstation. Before each benchmark run (i. e., before execution of the series of experiments related to a given OS), the target kernel is installed, and the interceptor is compiled for the current kernel (interceptors are kernel-dependent both for Windows and Linux). Once the benchmarking tool is compiled, it is used to identify the set of system calls
activated by the workload. Parameters of these system calls are then analyzed and placed into the corresponding class. A database of corrupted values is then generated accordingly.
Figure 3. Benchmark environment
Following the benchmark execution sequence presented in Figures 1 and 2, at the beginning of each experiment, the target machine (TM) records the experiment start instant
t
ExpStart and sends it to the benchmark controller (BC) along with a notification of experiment start-up. The workload starts its execution. The Observer module records, in the experiment execution trace, the start-up instant of the workload, the activated system calls and their responses. This trace also collects the relevant data concerning states SEr, SXp and SNS. The recorded trace is sent to the BC at the beginning of the next experiment. The parameter substitution module checks whether the current system call has parameters. If it is not the case, the execution is simply resumed; otherwise, the execution is interrupted, a parameter value is substituted and the execution is resumed with the corrupted parameter value (t
Resume is saved in the experiment execution trace). The state of the OS is monitored so as to diagnose SEr, SXp, SNS. The corresponding OS response time (t
Response) is recorded in the experiment execution trace. For each run, the OS reaction time is calculated as the difference betweent
Response andt
Resume.At the end of the execution of PostMark, the OS notifies the end of the experiment to the BC by sending an end signal along with the experiment end instant,
t
ExpEnd. If the workload does not complete, thent
ExpEnd is governed by the value of a watchdog timer. The BC collects the SHg state and the workload abort/hang states. It is in charge of restarting the system in such cases. When no faultload is applied, the average time necessary for the OS to execute PostMark is far less than 1 minute for Windows and for Linux. We have fixed the watchdog timer to 3 minutes. If, at the end of this watchdog timer, the BC has not received the end signal from the OS, it then attempts to connect to the OS. If this connection issuccessful, then a workload abort or hang state is diagnosed, otherwise SHg is assumed.
At the end of a benchmark execution, all files containing raw results corresponding to all experiments are on the BC. A processing module extracts automatically the relevant information from these files (two specific modules are required for Windows and Linux families). The relevant information is then used to evaluate automatically the benchmark measures (the same module is used for Windows and Linux).
4. Benchmark Results
The robustness measure is given in Figure 4. It shows that all OSs of the same family are equivalent, which is in conformance with our previous results, related to Windows using TPC-C Client [12]. It also shows that none of the catastrophic outcomes (Panic or Hang OS states) occurred for all Windows and Linux OSs. Linux OSs notified more error codes (59-67%) than Windows (23-27%), while more exceptions were raised with Windows (17-22%) than with Linux (8-10%). More no-signaling cases have been observed for Windows (55-56%) than for Linux (25-32%). In [22] it was observed that on the one hand Windows 95, 98, 98SE and CE had a few Catastrophic failures and on the other hand Windows NT, Windows 2000 and Linux are more robust and did not have any Catastrophic failures as in our case.
Windows Family Linux Family
Figure 4: OS Robustness (%)
The reaction time is given in Table 4. Globally, Windows OSs have shorter response times than Linux OSs. The standard deviation is significantly larger than the average for all OSs. Except for the two revisions of Linux 2.4, τexec is always larger than Texec, the reaction time in the presence of faults. This can be explained by the fact that after parameter corruption, the OS detects the anomaly in almost 45% of cases for Windows and 75% of cases for Linux, and stops system call execution, returns an error code or notifies an exception.
Note that for the Windows family, Windows XP has the best reaction time in the presence of faults and for the Linux family, Linux 2.6.6 has the lowest reaction time. For Linux 2.6.6, we notice that τexec is almost two times larger than for the other revisions. A detailed analysis of the results showed that this is due to one system call,
execve, for which the execution time is 15000 µs for Linux 2.6.6 and 6000 µsfor other versions.
Table 4: Reaction time
Windows Family
NT4 2000 XP
Avg. S. Dev. Avg. S. Dev. Avg. S. Dev. τexec 248 µs 136 µs 315 µs Texec 148 µs 219 µs 118 µs 148 µs 219 µs 118 µs
NT4 Server 2000 Server 2003 Server τexec 125 µs 175 µs 173 µs Texec 110 µs 221 µs 131 µs 110 µs 221 µs 131 µs Linux Family 2.2.26 2.4.5 2.4.26 τexec 485 µs 479 µs 450 µs Texec 465 µs 1505 µs 695 µs 2499 µs 465 µs 1505 µs The restart times are shown in Table 5. The average restart time without faults, τres, is always lower than the average restart time with faults (Tres), but the difference is not significant. Linux seems to be globally faster (71-83s) than Windows (74-112s). However, if we consider only OS versions introduced in the market after 2001, the other OSs rank as follows: Linux 2.2.26 (71s), Windows XP (74s), Windows 2003 server (77s), Linux 2.4.5 (79s), Linux 2.6.6 (82s), Linux 2.4.26 (83s).
Table 5: Restart time
Windows Family
NT4 2000 XP
Avg. S. Dev. Avg. S. Dev. Avg. S. Dev. τres 91 s 95 s 74 s Tres 92 s 4 s 96 s 92 s 4 s 118 µs
NT4 Server 2000 Server 2003 Server τres 90 s 111 s 76 s Tres 91 s 4 s 112 s 91 s 4 s 112 s Linux Family 2.2.26 2.4.5 2.4.26 τres 64 s 74 s 82 s Tres 71 s 32 s 79 s 23 s 71 s 32 s Concerning Linux family, we note that i) the standard deviations are important and ii) the restart time decreases with new versions or revisions, except for Linux 2.6.6. This exception is justified by the fact that the Linux kernel was restructured in its version 2.6.
5. Results Refinement
The benchmark temporal measures are refined to provide more insights into those presented in Section 4.
5.1. Reaction Time
Table 6 presents the detailed reaction times with respect to OS outcomes after execution of corrupted system calls (Error Code, Exception and No Signaling). Thus, three average times are added to detail Texec: TSEr, TSXp (the times necessary to return respectively an error code or an exception) and TSNS (the execution time of the corrupted system call, in case of no-signaling state).
Table 6: Detailed reaction time
Windows Family
NT4 2000 XP
Avg. S. Dev. Avg. S. Dev. Avg. S. Dev. Texec 148 µs 219 µs 118 µs 289 µs 114 µs 218 µs TSEr 45 µs 107 µs 34 µs 61 µs 45 µs 118 µs TSXp 40 µs 15 µs 37 µs 15 µs 50 µs 96 µs TSNS 234 µs 437 µs 186 µs 375 µs 168 µs 265 µs
NT4 Server 2000 Server 2003 Server Texec 110 µs 221 µs 131 µs 289 µs 102 µs 198 µs TSEr 41 µs 66 µs 29 µs 33 µs 25 µs 61 µs TSXp 35 µs 15 µs 37 µs 15 µs 48 µs 20 µs TSNS 166 µs 280 µs 210 µs 396 µs 156 µs 252 µs Linux Family 2.2.26 2.4.5 2.4.26 Texec 167 µs 300 µs 466 µs 2276 µs 167 µs 300 µs TSEr 208 µs 361 µs 92 µs 105 µs 208 µs 361 µs TSXp 88 µs 5 µs 91 µs 8 µs 88 µs 5 µs TSNS 85 µs 5 µs 1545 µs 4332 µs 85 µs 5 µs
For Windows family, it can be seen that for Windows 2000, 2000 Server, XP and 2003 Server, returning an error code takes less time than notifying an exception. This can be explained by the fact that when returning an error code, tests are carried out on the parameter values at the beginning of the system call code and the system call is abandoned, while the exceptions are raised from a lower level of the system under benchmarking. Nevertheless, in the cases of Windows NT4 and NT4 Server, TSEr is higher than TSXp. The cause of this anomaly lies in the long duration of time necessary to GetCPInfo system call to return an error code when its first parameter is corrupted.
Concerning Linux family, the averages presented in this table do not take into account execve system call execution time. For Linux OSs, we notice the high values of TSNS corresponding to the two revisions of version 2.4, compared to the two other versions. Also, the very high standard deviation suggests a large variation around the average, which is confirmed in Figure 5 that gives the OS reaction time for all system calls leading to the no-signaling state for all Linux OSs. We can clearly see that
for Linux 2.4 the average time necessary for executing mkdir is larger than for all other system calls.
Also, a very large average time to return an error code is observed for Linux 2.2.26, with a high standard deviation. Figure 6 details the times necessary to return error codes for Linux system calls. It is clear that these times are very similar except for unlink system call in Linux 2.2.26, which explains the high TSEr of Linux 2.2.26 compared to the other versions. After discarding the exceptional values corresponding to execve, mkdir and unlink system calls, the average reaction times Τexec of the four targeted Linux OSs become very close. Furthermore,
τexec and Τexec become very close.
0 40 80 120 160 200 _llseek brk close mkdir munmapold_mmap
open read write
2.2.26 2.4.5 2.4.26 2.6.6
b a
a=14070 b=12739
Figure 5: Linux reaction time in case of SNS
0 40 80 120 160 200
_llseek access close fstat64 mkdir
munmapold_mmap
open read rmdir uname unlink write
2.2.26 2.4.5 2.4.26 2.6.6
a=863
a
Figure 6: Linux reaction time in case of SER
5.2. Restart Time
The detailed analysis of the restart time showed that all OSs of the same family have similar behavior and that the two families exhibit very different behaviors.
For Windows, there is a correlation between the restart time and the state of the workload at the end of the experiment. When the workload is completed, the average restart time is statistically equal to the restart time without parameter substitution. On the other hand, the restart time is larger and statistically equal for all experiments with workload abort/hang. This is illustrated in Figure 7 for Windows XP in which the average restart time in case of workload completion is 73 seconds and 80 seconds in case of workload abort/hang.
Linux restart time is not affected by the workload final state. Detailing Linux restart times shows high values appearing periodically. These values correspond to a “check-disk” performed by the Linux kernel every 26
Target Machine restarts. This is illustrated for Linux 2.2.26 in Figure 7, and explains the important standard deviation on this measure.
Figure 7: Detailed restart time
6. Benchmark Validation
In order to gain confidence in dependability benchmark results, one has to check that the key properties are fulfilled. These properties are addressed successively in the rest of this section. We first define the property, then we show what has been achieved to satisfy and check it.
6.1. Representativeness
Representativeness concerns the benchmark measures, the workload and the faultload.
The measures evaluated provide information on the OS
state and temporal behavior after execution of corrupted system calls. We emphasize that these measures are of interest to a system developer (or integrator) for selecting the most appropriate OS for his/her own application. Of course other measures would help.
PostMark workload is representative if the OS is used as
a file server (60 % of system calls activated by PostMark belong to the file management functional component). If the OS is used for other purposes, other workloads should be investigated. Nevertheless, the selection of any other workload does not affect the concepts and specification of our benchmark. Currently, we are investigating the Java Virtual Machine.
The faultload is without any doubt the most critical
component of the OS benchmark and more generally of any dependability benchmark. Faultload representa-tiveness concerns i) the parameter corruption technique used and ii) the set of corrupted parameters.
Parameter corruption technique
In our previous work [11], performed for Linux, we have used two techniques for system call parameter corruption: the systematic bit-flip technique consisting in flipping systematically all bits of the target parameters (i.e., flipping the 32 bits of each considered parameter) and the selective substitution technique described in Section 2. This work showed the equivalence of the errors induced by the two techniques. In [12] we obtained the same robustness for Windows 2000 using the systematic bit-flip technique and the selective substitution technique. The application of the bit-flip technique requires much more experimentation time compared to the application of selective substitution technique. Indeed, in the latter case, the set of values to be substituted is simply determined by the data type of the parameter (see Section 2), which leads to a more focused set of experiments. We have thus preferred the selective substitution technique for pragmatic reasons: it allows derivation of results that are similar to those obtained using the well-known and accepted bit-flip fault injection technique, with much less experiments. Our benchmark is based on selective substitutions of system call parameters to be corrupted. Parameters to be corrupted
The selective substitution technique used is composed of a mix of three corruption techniques as mentioned in Section 2: out-of-range data (OORD), incorrect data (ID) and incorrect addresses (IA). Let us denote the faultload used in our benchmarks by FL0. To analyze the impact of the faultload, we consider two subsets, including respectively i) IA and ODRD only (denoted FL1), and ii) ODRD only (denoted FL2). These faultloads are summarized in Table 7, which gives also the number of substitutions (hence the number of experiments) for Windows NT4 and Linux 2.4 as examples.
We ran the benchmarks of all OSs considered using successively FL0, FL1 and FL2. The results obtained confirm the equivalence between Linux family OSs as well as the equivalence between Windows family OSs, using the same faultload (FL0, FL1 or FL2). Figure 8 shows the robustness of Windows NT4, 2000 and XP with respect to FL1 and FL2. (robustness with respect to FL0 is given in Figure 3). Note that for each OS, its robustness with respect to FL0, FL1 or FL2 is different but the robustness of all OSs of the same family with respect to the same faultload is equivalent. The same results have been obtained in [12], using TPC-C Client as workload.
Further validation concerning selective substitution For each parameter type class, we performed a sensitivity analysis regarding specific values of parameter substitution. This analysis revealed that different random values chosen to substitute the original parameter lead to the same outcome of benchmark experiments. Hence the
benchmark results are not sensitive to the specific values given to the corrupted parameters as substitution values. Moreover, we checked the representativeness of incorrect data faults. One could argue that the OS is not assumed to detect this kind of faults as the substitution values are inside the validity domain of the parameter type. The analysis of the execution traces corresponding to experiments with incorrect data substitution that led to notification of error codes in the case of Linux, revealed that 88.6% of the faults correspond to out-of-range data in the very particular context of the workload execution. Consequently, the notification of error codes was a normal outcome in these cases. Incorrect data are thus very useful: they can provide a practical way for generating out-of-range data in the execution context. Note that an enormous effort would be needed to analyze all execution contexts for all system calls to define pertinent substitution values for each execution context.
Table 7: Faultloads considered
ID IA OORD (Windows NT4) # experiments # experiments (Linux 2.4)
FL0 x x x 418 206
FL1 x x 331 135
FL2 x 77 55
FL1 FL2
Figure 8: OS Robustness using FL1 and FL2 (%)
6.2. Repeatability and Reproducibility
The benchmarking of a given system can be based either on an existing benchmark implementation (an existing prototype) or on an existing specification only. Repeatability concerns the benchmark prototype while reproducibility is related to the benchmark specification. Repeatability is the property that guarantees statistically equivalent results when the benchmark is run more than once in the same environment (i.e., using the same system under benchmark and the same prototype). This property is central to benchmarking. Our OS dependability benchmark is composed of a series of experiments. Each experiment is run after system restart. The experiments are independent from each other and the order in which the experiments are run is not important at all. Hence, once the system calls to be corrupted are selected and the
substitution values defined, the benchmark is fully repeatable. We have repeated all the benchmarks presented three times to check for repeatability.
Reproducibility is the property that guarantees that another party obtains statistically equivalent results when the benchmark is implemented from the same specifica-tion and is used to benchmark the same system under benchmarking. Reproducibility is strongly related to the amount of details given in the specification. The specifi-cation should be at the same time i) general enough to be applied to the class of systems addressed by the bench-mark and ii) specific enough to be implemented without distorting the original specification. We managed to sat-isfy such a tradeoff. Unfortunately, we have not checked explicitly the reproducibility of the benchmark results by developing several prototypes by different people. On the other hand, the results seem to be independent from the technique used to corrupt system call parameters. This makes us confident about reproducibility. However, more verification is still required.
6.3. Portability
Portability concerns essentially the faultload (i.e., its applicability to different OS families).
At the specification level, in order to ensure portability of the faultload, the system calls to be corrupted are not identified individually. We decided to corrupt all system calls of the workload. This is because OSs from different families do not necessarily comprise the very same system calls as they may have different APIs. However, most OSs feature comparable functional components. At the implementation level, portability can only be ensured for OSs from the same family because different OS families have different API sets.
The first prototype developed concerns Windows 2000. It revealed to be portable without modification for Windows 2000 Server and Windows 2003 Server (PostMark activatesthe same 27 system calls with parameters), and with minor adaptations for the others. One system call (FreeEnvironmentStringA) is not activated under Windows NT4, NT4 Server and XP and another system call (LockResource) is not activated under NT4 and NT4 Server. In these cases, the system calls that are not activated are dropped from the corrupted values database.
For Linux, the prototype revealed to be portable across all OSs except the interceptor Strace that is kernel-dependent. Consequently, we used one version of Strace for Linux 2.2 and 2.4 and another version for Linux 2.6. Also, PostMark activates the same system calls for Linux 2.2.26 and 2.4 while it activates a supplementary system call (mmap2) for Linux 2.6.6. Consequently, we added this system call to the set of activated system calls and an entry in the corrupted values database.
6.4. Cost
Cost is expressed in terms of effort required to develop the benchmark, run it and obtain results. These steps require some effort that is relatively affordable. In our case, most of the effort was spent in defining the concepts, characterizing the faultload and studying its representativeness. The installation of PostMark took one day both for Windows and Linux. The implementation of the different components of the controller took about two weeks for each OS family, including the customization of the respective interceptors (Detours and Strace). The implementation of the faultload took one week for each OS family, during which we have i) defined the set of corrupted values related to each data type and ii) created the database of corrupted values. Both databases are portable on OSs belonging to their family (one database for Windows family and one database for Linux family). However, small adaptations were necessary.
The benchmark execution time for each OS is less than two days. More precisely, the duration of an experiment with workload completion is less than 3 min (including the workload completion time and the restart time), while it is less than 6 min without workload completion (including the watchdog timeout and the restart time). Thus, on average, an experiment lasts less than 5 min.
7. Conclusion
We presented the specification of a dependability benchmark for OSs with respect to erroneous parameters in system calls, along with prototypes for two families of OSs, Windows and Linux. These prototypes allowed us to obtain the benchmark measures defined in the specification. We stress that the measures obtained for the different OSs are comparable as i) the same workload (PostMark) was used to activate all OSs, ii) the faultload corresponds to similar selective substitution techniques applied to all system calls activated by the workload and iii) the benchmark conduct was the same for all OSs. Concerning the robustness measure, the benchmark results show that all OSs of the same family are equivalent. They also show that none of the catastrophic states of the OS (Panic or Hang) occurred for any of the Windows and Linux OSs considered. Linux OSs notified more error codes (59-67 %) than Windows (23-27 %), while more exceptions were raised with Windows (17-22%) than with Linux (8-10 %). More no-signaling cases have been observed for Windows (55-56 %) than for Linux (25-32 %).
Concerning the OS reaction time measure, results show that globally Linux reaction time, related to system calls activated by the workload (450-953 µs) is longer than Windows reaction time (102-148 µs). Refinement of this measure revealed a great variation around the average and that a minority of system calls with large execution times
dodged the average. When these system calls are not considered, the reaction times of all the OSs of the same family become equivalent.
With respect to the restart time measure, Linux seems to be globally faster (71-83s) compared to Windows (74-112 s). However, if we consider only OS versions introduced after 2001, the restart times of the other OSs are ranked as follows: Linux 2.2.26 (71 s), Windows XP (74 s), Windows 2003 server (77 s), Linux 2.4.5 (79 s), Linux 2.6.6 (82 s), Linux 2.4.26 (83 s). Detailed analysis of the restart time showed i) a correlation between Windows restart time and the workload final state (in case of workload hang or abort, the restart time is 10 % higher than in case of workload completion) and ii) that Linux performs a “check disk” after each 26 restarts after which the restart time is 3 times higher than the average.
We validated our benchmark paying a particular attention to representativeness of faultload, and to the properties of repeatability, reproducibility, portability and cost effectiveness of the benchmark.
Acknowledgement
We would like to thank all the DBench colleagues who, through the numerous discussions all over the project, helped us in defining the OS benchmark as it is in this paper. In particular, we are grateful to Jean Arlat who contributed to the OS benchmark based on TPC-C Client.
References
[1] A. Albinet, J. Arlat, and J.-C. Fabre, “Characterization of the Impact of Faulty Drivers on the Robustness of the Linux Kernel”, Int. Conf. on Dependable Systems and Network, Florence, Italy, 2004, pp. 867-876.
[2] J. Arlat et al., “Dependability of COTS Microkernel-Based Systems”, IEEE Trans. on Computers, Vol.51 (2), pp. 138-163, 2002.
[3] J. Arlat et al., “The DBench Framework for Dependability Benchmarking”, http://www.laas.fr/DBench, 2002. [4] A. Brown, L. C. Chung, and D. A. Patterson, “Including
the Human Factor in Dependability Benchmarks”, DSN 2002 Workshop on Dependability Benchmarking, Washington, D.C., USA, 2002, pp. F-9-14.
[5] A. Brown and D. A. Patterson, “Towards Availability Benchmarks: A Case study of Software RAID Systems”, USEUNIX 2000, San Diego, CA, USA, 2000
[6] P. Chevochot and I. Puaut, “Experimental Evaluation of the Fail-Silent Behavior of a Distributed Real-Time Run-Time Support Built from COTS Components”, Int. Conference on Dependable Systems and Networks, Göteborg, Sweden, 2001, pp. 304-313.
[7] A. Chou et al. “An Empirical Study of Operating Systems Errors”, 18th ACM Symp. on Operating Systems Principles Banff, AL, Canada, 2001, pp. 73-88.
[8] J. Durães and H. Madeira, “Characterization of Operating Systems Behavior in the Presence of Faulty Drivers through Software Fault Emulation”, Pacific Rim Int. Sym.
on Dependable Computing, Tsukuba, Japan, 2002, pp. 201-209.
[9] W. Gu, Z. Kalbarczyk, and R. K. Iyer, “Error Sensitivity of the Linux Kernel Executing on PowerPC G4 and Pentium 4 Processors”, Int. Conf. on Dependable Systems and Networks, Florence, Italy, 2004, pp. 887-896.
[10] G. Hunt and D. Brubaher, “Detours: Binary Interception of Win32 Functions”, 3rd USENIX Windows NT Symp., Seattle, Washington, USA, 1999, pp. 135-144.
[11] T. Jarboui, J. Arlat, Y. Crouzet, K. Kanoun and T. Marteau, “Analysis of the Effects of Real and Injected Software Faults: Linux as a Case Study”, 2002 Pacific Rim International Symposium on Dependable Computing, Tsukuba, Japan, 2002, pp. 51-58.
[12] A. Kalakech, K. Kanoun, Y. Crouzet, and A. Arlat, “Benchmarking the Dependability of Windows NT, 2000 and XP”, Int. Conf. on Dependable Systems and Networks, Florence, Italy, 2004, pp. 681-686.
[13] K. Kanoun et al., “DBench – Dependability Benchmarking”, Supplement of the Int. Conf. on Dependable Systems and Networks, Göteborg, Sweden, 2001, pp. D.12-D.15.
[14] J. Katcher, “Postmark: A New File System Benchmark”, Network Appliance,
www.netapp.com/tech_library/3022.html 3022, 1997. [15] P. Koopman and J. DeVale, “Comparing the Robustness of
POSIX Operating Systems”, 29th Int. Symp. on Fault-Tolerant Computing, Madison, 1999, pp. 30-37.
[16] P. J. Koopman et al., “Comparing Operating Systems using Robustness Benchmarks”, 16th Int. Symp. on Reliable Distributed Systems, Durham, USA, 1997, pp. 72-79. [17] H. Madeira et al. “Dependability Benchmark Definition:
DBench Prototypes”, DBench Project deliverable, 2002 http://www.laas.fr/DBench
[18] E. Marsden, J.-C. Fabre, and J. Arlat, “Dependability of CORBA Systems: Service Characterization by Fault Injection”, 21st Int. Symposium on Reliable Distributed Systems, Osaka, Japan, 2002, pp. 276-285.
[19] R. McGrath and W. Akkerman, “Source Forge Strace Project, http://sourceforge.net/projects/strace/”, 2004. [20] A. Mukherjee and D. P. Siewiorek, “Measuring Software
Dependability by Robustness Benchmarking”, IEEE Trans. of Software Engineering, Vol. 23 (6), pp. 366-378, 1997. [21] J. Pan et al. “Robustness Testing and Hardening of
CORBA ORB Implementations”, Int. Conference on Dependable Systems and Networks, Göteborg, Sweden, 2001, pp. 141-150.
[22] C. Shelton et al., “Robustness Testing of the Microsoft Win32 API”, Int. Conf. on Dependable Systems and Networks, New York, 2000, pp. 261-270.
[23] TPC-C, “TPC Benchmark C, Standard Specification 5.1, available at http://www.tpc.org/tpcc/.” 2002.
[24] T. K. Tsai et al., “An Approach Towards Benchmarking of Fault-Tolerant Commercial Systems”, 26th Int. Symp. on Fault-Tolerant Computing, Sendai, Japan, 1996, pp. 314-323.
[25] J. Zhu, J. Mauro, and I. Pramanick, “R3: Rate, Robustness, and Recovery - An Availability Benchmark Framework”, Sun Microsystems Lab, CA TR-2002-109, 2002.