HAL Id: hal-00001553
https://hal.archives-ouvertes.fr/hal-00001553
Submitted on 11 May 2004
HAL is a multi-disciplinary open access
archive for the deposit and dissemination of
sci-entific research documents, whether they are
pub-lished or not. The documents may come from
teaching and research institutions in France or
abroad, or from public or private research centers.
L’archive ouverte pluridisciplinaire HAL, est
destinée au dépôt et à la diffusion de documents
scientifiques de niveau recherche, publiés ou non,
émanant des établissements d’enseignement et de
recherche français ou étrangers, des laboratoires
publics ou privés.
To cite this version:
R. Terrier, F. Lebrun, Guillaume Bélanger, A. Goldwurm, Andrew Strong, et al.. Contribution of
point sources to the soft gamma-ray Galactic emission. 5th INTEGRAL Workshop, Feb 2004, Munich,
France. pp.513-518. �hal-00001553�
ccsd-00001553, version 1 - 11 May 2004
CONTRIBUTION OF POINT SOURCES TO THE SOFT γ-RAY GALACTIC EMISSION
R. Terrier1 , F. Lebrun2 , G. B´elanger2 , A. Goldwurm2 , A. W. Strong3 , V. Schoenfelder3 , L. Bouchet4, J.P. Roques4, and A. Parmar5
1
Astroparticules et cosmologie, 11 place M. Berthelot, 75231 Paris, France
2Service d’Astrophysique, DAPNIA/CEA Saclay, 91911, Gif/Yvette, France 3
MPE, Giessenbachstrasse, 85748 Garching, Germany
4
CESR, 9 av. du Colonel Roche, BP 4346, 31028 Toulouse, France
5ESA, RSSD, Keplerlaan 1, NL-2201, AZ Nordwijk, The Netherlands
ABSTRACT
The nature of the soft gamma-ray (20-200 keV) Galactic emission has been a matter of debate for a long time. Previous experiments have tried to sep-arate the point source contribution from the real in-terstellar emission, but with a rather poor spatial res-olution, they concluded that the interstellar emission could be a large fraction of the total Galactic emis-sion. INTEGRAL, having both high resolution and high sensitivity, is well suited to reassess more pre-cisely this problem. Using the INTEGRAL core pro-gram Galactic Center Deep Exposure (GCDE), we estimate the contribution of detected point sources to the total Galactic flux.
Key words: Interstellar emission; INTEGRAL; IBIS/ISGRI.
1. INTRODUCTION
The interstellar emission is known to be mostly due to diffuse processes (that is interaction of cosmic rays with the interstellar medium) above 10 MeV (Hunter et al. 1997). In the X-ray band, deep Chandra expo-sures have shown that up to 90% of the total emis-sion is due to purely diffuse emisemis-sion (Ebisawa et al. 2001). The situation is much less clear in the soft γ ray domain: an intense and steep spectrum has been measured by OSSE up to 300 keV (Kinzer et al. 1999) where the hard positronium component starts to dominate (in the Galactic central regions). Ex-plaining this spectrum has always been a very dif-ficult task: γ-rays from 20 keV to 300 keV can be produced by Inverse Compton interaction of inter-mediate energy electrons (of the order of 100 MeV) (Skibo et al. 1996). This is constrained by radio ob-servations (Webber 1983; Strong et al. 2000). Another approach involves the bremsstrahlung of low energy electrons in the interstellar medium. But
since the Coulomb losses are dominant under a few hundred MeV, most of the energy is dissipated through ionization. Therefore, the power required to sustain such a population of electron is very large (of the order of 1041
− 1043
ergs−1, that is the equivalent
of the Glactic cosmic ray power). Besides, the large ionization should also produce an excessive dissocia-tion of the molecules in the central regions. Hence, a major contribution from point sources was assumed (Skibo et al. 1996; Lebrun et al. 1999).
Observation of the diffuse emission in this energy range is a difficult task. OSSE with its 11ox4o
(FWHM) collimator had no imaging capabilities, and was only able to measure the total Galactic emission, i.e. point sources and diffuse emission, the resulting spectrum was therefore varying with time (Kinzer et al. 1999). To remove the point source contribution, Purcell et al. (1996) performed simul-taneous observations with OSSE and SIGMA. The latter, with its coded mask system, had good imag-ing capabilities and a sensitivity of about 30 mCrab (Paul et al. 1991). The total spectrum of sources detected by SIGMA was then subtracted from the total Galactic spectrum of OSSE. The resulting spec-trum is of the order of about 40 to 60% of the total emission; the limited sensitivity of SIGMA suggests that a significant part of the residuals are due to un-resolved point sources. Similar studies were made using OSSE and RXTE in the Scutum arm region (l=30). The spectra of sources detected by RXTE, were extrapolated up to 50 keV and subtracted from the OSSE spectrum. A diffuse contribution of 50 to 70% remained (Valinia & Marshall 1998). The ballon-borne experiment HIREGS with its system of two collimators had the possbility to observe si-multaenously small (≤ 3.7o) and large scale emission
from the Galactic plane. By fitting the spectra of a few bright sources, Boggs et al. (2000) found a dif-fuse emission spectrum much harder than previously. One should also bear in mind, that observations of the Galactic ridge emission show non-thermal hard X-rays tails up to 20 keV. They have been detected in the Galactic plane (Valinia et al. 2000) as well as
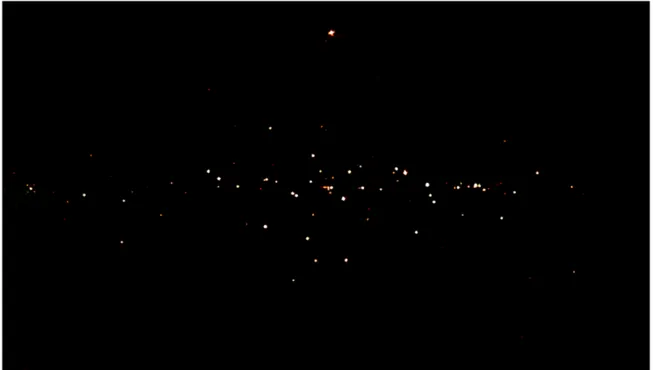
Figure 1. Significance map of the GCDE survey. A total of 91 sources are detected above 6 σ.. Nearly half of them are identified as LMXB. This figure is taken from Lebrun et al. (2004)
in the Galactic bulge (Revnivtsev 2003).
Since one needs both a good angular resolution and a large field-of-view (FOV) to disentangle point sources from extended emission, IBIS (Ubertini et al. 2003), the INTEGRAL imager, with its low energy camera ISGRI (Lebrun et al. 2003), seems well suited to perform this task. It has a good angular resolution of about 12’ (FWHM), a wide FOV (19o
FWHM) and last but not least a mCrab sensitivity.
2. COMPACT SOURCES EXTRACTION
2.1. The observations
Observations of the whole Galactic Center Deep Ex-posure (GCDE) have been used as well as two Target of Opportunity observations in the Galactic central regions. This amounts to about 2000 science win-dows. They were analyzed with the standard analy-sis described in Goldwurm et al. (2003), in 4 energy bands 20-40 keV, 40-60 keV, 60-120 keV and 120-220 keV. In order to remove large scale residual back-ground non-uniformities (Terrier et al. 2003), the maps were filtered and the variance was computed from local fluctutations in the intensity images. This variance is larger than the theoretical one and pro-vides a more robust estimate of the significance and limits the possible false detections.
2.2. Source detection
Source detection was performed in each of the 20 - 40 , 20 - 60, 20 - 120 and 20 - 220 keV energy bands. Excesses above 6 σ in any of these bands were considered and. A list of 91 sources candidates was produced, and counterparts were looked for in the SIMBAD database. About 40 Low Mass X ray Binaries (LMXB) were found, mostly in the Galactic bulge. 7 High-mass binaries (HMXB), a few plerionic supernovae remnants, pulsars, a few active Galactic nuclei and a soft γ-ray repeater are also detected. About 15 sources are identified but don’t have known types (among which we find the new IGR sources), and about 15 have no acceptable counterparts in the databases. Most of these results are in full agreement with the IBIS survey findings (Bird et al. 2004).
3. USING IBIS AS A COLLIMATOR
The coded-mask imaging removes structures larger that the PSF, the diffuse emission is therefore to-tally washed out during the analysis. To compare it to the detected sources flux, one has to use IBIS as a collimator, that is compare point sources and total Galactic emission count rates. To do so, it is necessary to correct the measured count rates for the internal and cosmic background, and to estimate the source count rate using their flux estimated by the imaging.
revolution number
40 50 60 70 80 90 100 110 120 130
veto count rate c/s
20 21 22 23 24 25 26 27 3 x10
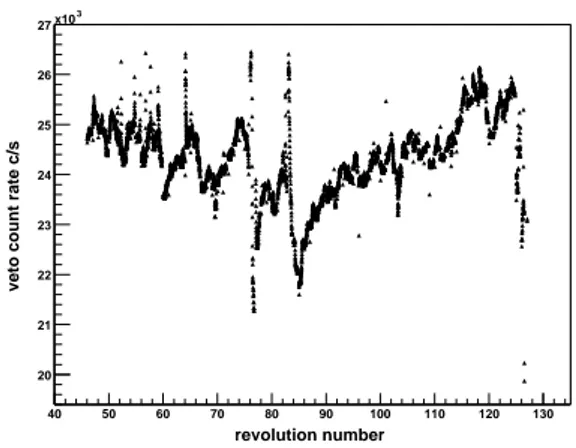
Figure 2. IBIS veto count rate as a function of revo-lution number. There are strong variations of the cosmic-ray activity during the two GCDE periods which induce significant variations in the measured count rate. These variations are estimated using the ISGRI high energy count rate (≥500 keV) which is strongly correlated to the veto count rate because it is mostly due to cosmic ray activation of the detector and its environment.
3.1. Count rate corrections
Here we assume that the measured count rate is due to:
• a time varying background caused by the cosmic-rays interactions
• a contant and uniform background due to the diffuse cosmic and internal backgrounds
• point sources
• Galactic diffuse emission
The effects of the time variable background are very strong and have to be corrected: the variation of the veto count rate are large over the extent of the ob-servations (see figure 2). The high-energy count rate (E ≥ 500 keV) is mainly due to CR induced events: an on-axis source of 1 Crab would contribute at ap-proximately 0.3 counts/s, which is more than two orders of magnitude lower than the average of 60 counts/s in this energy range. We will therefore use this information to estimate the level of time-variable background. The correlation with low energy count rates is computed at high latitudes (|b| ≥ 30o) in
regions depleted of point sources and Galactic emis-sion, where all the count rate is due to cosmic ray induced and the isotropic backgrounds. Using this correlation in the other pointings allows us to cor-rect for the time variable background. The error in the coefficient determination introduces systematic errors in the corrected count rate.
Figure 3. Imaging efficiency applied to find the source count rate on the detector from its position in the FOV. It is the product of the acceptance (frac-tion of the detector pixels seen from a point in the sky) and the absorption.
3.2. Estimation of the source count rate on the detector
The source fluxes estimated through the imaging are corrected for inclination on the telescope axis and averaged over all the observations. We therefore have to recover the sources count rate for individ-ual science windows. To do this, we use the angu-lar response of IBIS/ISGRI which is the product of the acceptance (the fraction of the detector actually light up through the mask) and the absorption and vignetting effects in the mask and mask structure. The resulting function is shown in figure 3.
For each science window, the fluxes of all sources are estimated using their position in the FOV and then summed. Since there are some inaccuracies in the acceptance model, the count rates obtained from the image fluxes have to be calibrated on the Crab observed count rates. This calibration has been done in each energy band. Systematic errors of the order of 10% are introduced this way.
3.3. Looking for Galactic emission: fitting the residuals
In order to improve the determination of the Galactic diffuse emission contribution, we assumed it is dis-tributed uniformly along the Galactic plane with a 5o
FWHM gaussian latitude distribution as suggested by Kinzer et al. (1999). To be more precise the CO and HI distribution could also be used (Strong et al. 2004). The count rate due to interstellar emission is estimated by convolution of the acceptance response described above with this spatial distribution. The resulting latitude distribution of the diffuse emission count rates is approximately 15o wide (FWHM)
be-cause of the wide FOV.
The corrected and source count rates of pointings lying between l = −20O
and l = +20O
4. RESULTS
4.1. Longitude profiles
In order to check for the consistency of this approach, the longitude profiles of corrected and source count rates have been compared. Only pointings close to the Galactic plane (|b| < 2o) have been considered.
In each longitude bin, the mean count rate of all the science windows pointing in that bin have been com-puted. The constant background obtained through the latitude fit described above has been added to the source count rate in order to be comparable to the corrected count rate. The resulting profile res-olution is limited by the 19o FOV. The source and
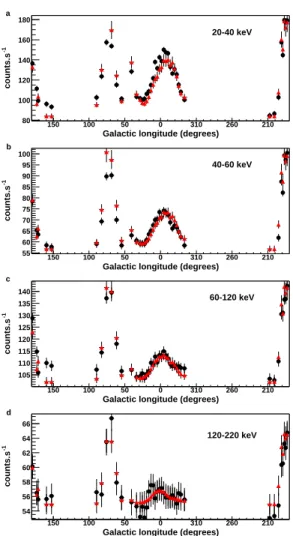
corrected count rate profiles are in good agreement in each of the 4 energy ranges, leaving only a small room to diffuse emission (see figure 4).
4.2. Latitude profiles
We show here the latitude profiles of the corrected and source count rates averaged in longitude from l=340o to l=20o (see figure 5). In the first energy
band (20-40 keV), a small contribution of the order of 14% is not accounted for by the detected sources. At higher energies, no significant residual emission is detected. The 3σ upper limit in the 40-60 keV band is 18% and 27% in the 60 to 120 keV energy band. At higher energies, the transparency of the shielding becomes large and the count rate correction is not any more valid. The structure at l = 20o in the
low energy band is due to Sco-X1 whose flux is not well estimated because of remaining inaccuracies in the large angle off axis response of ISGRI. Since the systematic errors are still large a contribution less than 20% of the total count-rate cannot be excluded.
4.3. Diffuse emission spectrum
The corrected count rate can be calibrated on the Crab response to determine an effective area in each of the energy bands. We deduce the spectrum of the residual emission per radian in figure 6. There is a significant improvement compared to the values ob-tained by Purcell et al. (1996) at least up to 100 keV. These results are in good agreement with an analy-sis using a fit of SPI data using the list of sources produced in this work (Strong et al. 2004).
Galactic longitude (degrees)
-1 counts.s 80 100 120 140 160 180 150 100 50 0 310 260 210 20-40 keV a
Galactic longitude (degrees)
-1 counts.s 55 60 65 70 75 80 85 90 95 100 150 100 50 0 310 260 210 40-60 keV b
Galactic longitude (degrees)
-1 counts.s 105 110 115 120 125 130 135 140 150 100 50 0 310 260 210 60-120 keV c
Galactic longitude (degrees)
-1 counts.s 54 56 58 60 62 64 66 150 100 50 0 310 260 210 120-220 keV d
Figure 4. Longitude profile of total Galactic emis-sion. The black squares give the corrected count-rate, and the red triangles the sum of the estimated source count-rate and the constant isotropic back-ground. Subfigures a to d are respectively in the 20 to 40, 40 to 60, 60 to 120 and 120 to 220 keV energy bands. This figure is taken from Lebrun et al. (2004)
Galactic latitude (degrees) -25 -20 -15 -10 -5 0 5 10 15 20 25 -1 counts.s 80 100 120 140 160 20-40 keV a
Galactic latitude (degrees)
-25 -20 -15 -10 -5 0 5 10 15 20 25 -1 counts.s 55 60 65 70 75 40-60 keV b
Galactic latitude (degrees)
-25 -20 -15 -10 -5 0 5 10 15 20 25 -1 counts.s 95 100 105 110 115 60-120 keV c
Galactic latitude (degrees)
-25 -20 -15 -10 -5 0 5 10 15 20 25 -1 counts.s 52 54 56 58 60 62 120-220 keV d
Figure 5. Latitude profile of total Galactic emis-sion. The black squares give the corrected count-rate, and the red triangles the sum of the estimated source count-rate and the constant isotropic back-ground. Subfigures a to d are respectively in the 20 to 40, 40 to 60, 60 to 120 and 120 to 220 keV energy bands. A small fraction (∼ 14%) of the Galactic emission is not accounted for by point sources. At higher energies no significant residuals are detected. In the last energy band, the transparency of shielding becomes large, which limits the relevance of the anal-ysis. This figure is taken from Lebrun et al. (2004)
keV 10 102 -1 rad -1 Mev -1 s -2 cm 2 MeV -3 10 -2 10
Figure 6. Residual Galactic flux. The blue circles give the total source spectrum, the red triangles the remaining emission possibly of diffuse origin and the black squares give the estimated interstellar emission taking into account SIGMA sources (Purcell et al. 1996; Kinzer et al. 1999). The diffuse spectrum is consistent with the one obtained by SPI with the same source list (Strong et al. 2004)
5. CONCLUSIONS
It appears that the total Galactic emission is dom-inated by point sources emission. The main results of the study can be summarized as follows:
• At 30 keV, a small fraction of the total Galactic emission (∼ 14%) is unaccounted for by detected sources. It can be caused by diffuse emission as well as unresolved point sources
• No significant diffuse emission is detected at higher energies
• The non-detection is not a strong constraint above 120 keV
• Taking into account the large systematic errors, one can estimate that the residual diffuse emis-sion should be less than 20% of the total Galac-tic emission from 20 to 100 keV.
Those results are in rather good agreement with SPI results (Strong et al. 2004). Some futher studies will be undertaken in the future to try to determine the flux of diffuse emission in this energy range. One of the main tasks is to lower the systematics. To do so one has to improve ISGRI angular response, take into account the source variability, and increase the background statistics at high latitudes to have a better count rate correction. Ultimately, a combined SPI-IBIS approach should give the best constaints. Studies of the logN-logS distribution will also provide insights to the level of diffuse emission due to unre-solved point sources. One should also keep in mind
cles produced in SNR (Dogiel et al. 2002). Their con-tribution to the interstellar Galactic emission should be falling in the soft γ-ray domain. The Inverse-Compton and positronium components should have much harder spectra and begin to dominate above a few hundred keV. A similar study is in progress to assess the level of diffuse emission seen by ISGRI between 15 and 20 keV.
ACKNOWLEDGMENTS
R.T. would like to thank CNES for financial sup-port. This research has made use of the SIMBAD database, operated at CDS, Strasbourg, France
REFERENCES
Bird A.J., Barlow E.J., Bassani L., et al., May 2004, ApJ, 607, L33
Boggs S.E., Lin R.P., Slassi-Sennou S., Coburn W., Pelling R.M., Nov. 2000, ApJ, 544, 320
Dogiel V.A., Sch¨onfelder V., Strong A.W., Feb. 2002, A&A, 382, 730
Ebisawa K., Maeda Y., Kaneda H., Yamauchi S., Aug. 2001, Science, 293, 1633
Goldwurm A., David P., Foschini L., et al., Nov. 2003, A&A, 411, L223
Hunter S.D., Bertsch D.L., Catelli J.R., et al., May 1997, ApJ, 481, 205
Kinzer R.L., Purcell W.R., Kurfess J.D., Apr. 1999, ApJ, 515, 215
Lebrun F., Goldoni P., Goldwurm A., et al., 1999, Astrophysical Letters Communications, 38, 457 Lebrun F., Leray J.P., Lavocat P., et al., Nov. 2003,
A&A, 411, L141
Lebrun F., Terrier R., Bazzano A., et al., Mar. 2004, Nature, 428, 293
Paul J., Ballet J., Cantin M., et al., 1991, Advances in Space Research, 11, 289
Purcell W.R., Bouchet L., Johnson W.N., et al., Dec. 1996, A&AS, 120, C389+
Revnivtsev M., Nov. 2003, A&A, 410, 865
Skibo J.G., Ramaty R., Purcell W.R., Dec. 1996, A&AS, 120, C403+
Strong A.W., Moskalenko I.V., Reimer O., Jul. 2000, ApJ, 537, 763
Strong A.W., et al., 2004, In: astro-ph/0405023 Terrier R., Lebrun F., Bazzano A., et al., Nov. 2003,
A&A, 411, L167
Ubertini P., Lebrun F., Di Cocco G., et al., Nov. 2003, A&A, 411, L131