HAL Id: tel-01127226
https://tel.archives-ouvertes.fr/tel-01127226
Submitted on 7 Mar 2015HAL is a multi-disciplinary open access archive for the deposit and dissemination of sci-entific research documents, whether they are pub-lished or not. The documents may come from teaching and research institutions in France or
L’archive ouverte pluridisciplinaire HAL, est destinée au dépôt et à la diffusion de documents scientifiques de niveau recherche, publiés ou non, émanant des établissements d’enseignement et de recherche français ou étrangers, des laboratoires
Evolution of inequalities in access to secondary schooling
in Uganda
Christian Kakuba
To cite this version:
Christian Kakuba. Evolution of inequalities in access to secondary schooling in Uganda. Sociology. Université René Descartes - Paris V, 2014. English. �NNT : 2014PA05H019�. �tel-01127226�
Université Paris Descartes
Ecole doctorale 180
CEPED / Education et Savoirs au Sud
EVOLUTION OF INEQUALITIES IN ACCESS
TO SECONDARY SCHOOLING IN UGANDA
Par Christian KAKUBA
Thèse de doctorat de Socio-démographie
Dirigée par Marc PILON
Présentée et soutenue publiquement le 25/11/2014Devant un jury composé de :
M. BOURDON Jean, Docteur Emérite, CNRS (IREDU) Université de Bourgogne, Rapporteur Mme CUSSO Roser, Professeure, Université Paris 1 Panthéon-Sorbonne, Rapporteure
Mme GOLAZ Valérie, Chargée de Recherche, Institut National d’Etudes Démographiques M. PILON Marc, Directeur de Recherche, Institut de Recherche pour le Développement M. RUTAREMWA Gideon, Associate Professor, Makerere University, Kampala, Uganda
TABLE OF CONTENTS LIST OF FIGURES ... 7 LIST OF TABLES ... 8 LIST OF ACRONYMS ... 9 ACKNOWLEDGEMENTS ... 10 ABSTRACT ... 11 RÉSUMÉ ... 12 INTRODUCTION ... 13
CHAPTER ONE: THE ROLE OF DEMAND AND SUPPLY FACTORS IN INFLUENCING SCHOOLING OUTCOMES ... 23
1.1 Child factors and primary schooling ... 24
1.1.1 Sex of child ... 25
1.1.2 Age of Child ... 26
1.1.3 Relationship to household head ... 27
1.1.4 Orphanhood status... 29
1.2 Household level factors and primary schooling ... 29
1.2.1 Household wealth or income ... 29
1.2.2 Parents’ education ... 31
1.2.3 Family size ... 33
1.2.4 Sex of household head ... 33
1.2.5 Household size and structure ... 34
1.2.6 Religion and ethnicity ... 35
1.2.7 Employment of parents ... 36
1.2.8 Marital status ... 37
1.3 Community factors and primary schooling ... 38
1.3.1 Place of residence... 38
1.3.2 Region of residence ... 40
1.3.3 Distance to school ... 41
1.4 The role of demand and supply factors in secondary schooling ... 42
1.4.1 Individual factors and secondary schooling ... 42
1.4.1.1 Sex of child ... 42
1.4.1.2 Age of child ... 43
1.4.1.3 Relationship to household head ... 43
1.4.2 Household factors and secondary schooling ... 44
1.4.2.1 Household wealth or income ... 44
1.4.2.4 Religion of head ... 46
1.4.2.5 Employment of parents ... 46
1.4.3 Community factors and secondary schooling ... 46
1.4.3.1 Place of residence... 47
1.4.3.2 Distance to school ... 47
1.5 Emerging issues from the review of Literature ... 47
CHAPTER TWO :THE PROBLEMATIC, METHODOLOGY AND COUNTRY CONTEXT 53 2.1 Growth of schooling populations ... 56
2.2 Survival to the end of primary and transition to secondary ... 58
2.3 Quality of Education ... 60
2.4 Privatization of Education ... 62
2.5 The Role of Government... 64
2.6 Other structural challenges to accessing secondary schooling... 66
2.7 Conceptual Framework ... 67
2.8 Objectives and hypotheses of the Study ... 71
2.9 Data and Methodology ... 72
2.9.1 Uganda National Household Survey data ... 72
2.9.2 Independent Variables as used in Modelling ... 74
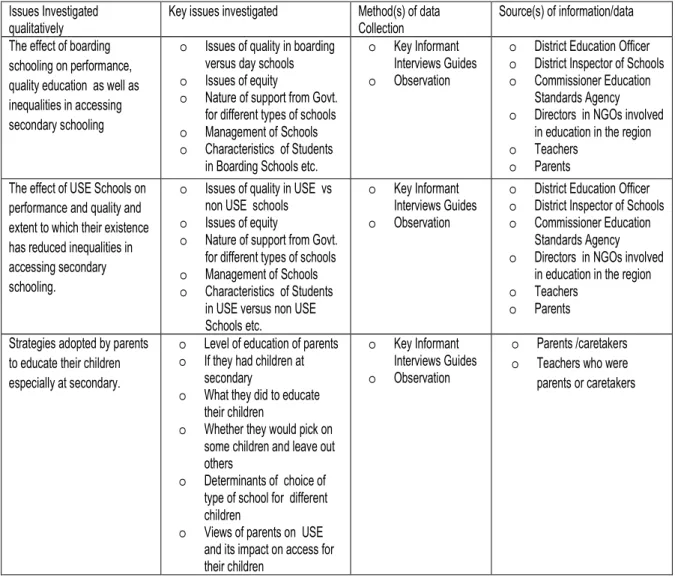
2.9.3 Qualitative Data from the field ... 80
2.10 Data Analysis and Modelling ... 82
2.10.1 Other methodological considerations ... 84
2.11 Demographic and Economic Context of Uganda ... 86
2.11.1 Demographic context ... 87
2.11.1.1 Population growth and dependency ... 90
2.11.2 Economic Context ... 92
2.11.2.1 Economy and Education Financing ... 95
2.12 Concluding Remarks ... 96
CHAPTER THREE: EDUCATION POLICY AND EVOLUTION OF SUPPLY AND DEMAND FOR EDUCATION SINCE INDEPENDENCE ... 99
3.1 The 1963 Castle Commission ... 100
3.2 The 1977 Education Policy Review Commission ... 101
3.3 The 1989 Education Policy Review Commission ... 102
3.4 The 1992 Government White Paper ... 105
3.5 The advent of Universal Primary and Secondary education ... 107
3.6 Education Strategic Investment Plan-ESIP (1998-2003) ... 109
3.7 Education Sector Strategic Plan- ESSP (2004-2015) ... 110
3.9 Structure of Uganda’s education system ... 113
3.10 Supply of Primary Education ... 114
3.11 Supply of Secondary Education ... 115
3.11.1 Secondary schools by ownership and foundation body ... 116
3.11.2 Secondary schools by boarding type ... 120
3.11.3 Secondary schools by number, boarding type and region ... 121
3.12 Evolution of School Enrolments and Rates since Independence ... 127
3.12.1 Evolution of Inequalities by sex and region ... 129
3.12.2 Growth in gender equity in education at various levels ... 129
3.12.3 Evolution of Enrolment Rates by region at Secondary ... 132
3.13 Emerging issues on Education Policy, Supply and Demand since Independence ... 134
CHAPTER FOUR : EDUCATIONAL ATTAINMENT BY BACKGROUND CHARACTERISTICS OF INDIVIDUALS AGED 13-24 YEARS. ... 139
4.1 Individual Characteristics and Educational Attainment ... 144
4.1.1 Age of Child ... 145
4.1.2 Sex of Child ... 145
4.1.3 Relationship to the Household Head ... 146
4.2 Characteristics of the household head and Educational Attainment ... 147
4.2.1 Education of household head ... 148
4.2.2 Sex of household head ... 148
4.2.3 Age of household head ... 149
4.2.4 Marital Status of household head ... 150
4.3 Characteristics of other household members and Educational Attainment ... 150
4.3.1 Household size ... 152
4.3.2 Proportion of Older adults ... 152
4.3.3 Proportion of children under five ... 152
4.3.4 Presence of natural father in household ... 153
4.3.5 Presence of natural mother in household ... 153
4.4 Household Characteristics and Educational Attainment ... 154
4.4.1 Household Wealth ... 154
4.4.2 Main Source of Income for Household ... 155
4.5 Community Characteristics and Educational Attainment ... 156
4.5.1 Place of Residence ... 156
4.5.2 Region of Residence ... 157
CHAPTER FIVE : EVOLUTION OF INEQUALITIES IN ACCESSING SECONDARY
SCHOOLING: A GLOBAL MULTIVARIATE MODEL. ... 161
5.1 Household Wealth ... 164
5.2 Education of household head ... 171
5.3 Place of Residence ... 173
5.4 Region of Residence ... 177
5.5 Age of Child ... 180
5.6 Marital Status of household head ... 181
5.7 Main Occupation for Household ... 183
5.8 Relationship to Household Head ... 184
5.9 Proportion of children under five ... 185
5.10 Sex of Child ... 186
5.11 Proportion of Older adults... 188
5.12 Age of household head ... 189
5.13 Sex of household head ... 189
5.14 Household size ... 190
5.15 Presence of natural father in household ... 190
5.16 Presence of natural mother in household ... 190
5.17 Concluding Remarks ... 190
CHAPTER SIX : EVOLUTION OF INEQUALITIES IN ACCESSING SECONDARY SCHOOLING: A TRANSITION MODEL. ... 195
6.1 Household Wealth ... 199
6.2 Education of household head ... 204
6.3 Marital Status of household head ... 205
6.4 Region of Residence ... 206
6.5 Place of Residence ... 206
6.6 Age of Child ... 208
6.7 Household size ... 209
6.8 Age of household head ... 209
6.9 Presence of natural mother in household ... 210
6.10 Proportion of children under five ... 210
6.11 Proportion of Older adults... 211
6.12 Main Occupation for Household ... 212
6.13 Relationship to Household Head ... 212
6.14 Sex of household head ... 212
6.15 Sex of Child ... 213
6.16 Presence of natural father in household ... 213
6.17 Evolution of Inequalities by level of access ... 213
CHAPTER SEVEN : EVOLUTION OF INEQUALITIES IN ACCESSING BOARDING ... 219
7.1 The place of boarding schools in the Ugandan Education System ... 222
7.2 Evolution of Inequalities in accessing boarding ... 226
7.2.1 Household Wealth ... 228
7.2.2 Region of residence ... 231
7.2.3 Relationship to household head ... 233
7.2.4 Marital Status of household head ... 234
7.2.5 Education of household head ... 235
7.2.6 Household size ... 235
7.2.7 Proportion of Children under Five ... 235
7.2.8 Proportion of Older Adults ... 236
7.2.9 Non-significant factors ... 236
7.3 Concluding Remarks ... 237
GENERAL CONCLUSION ... 240
BIBLIOGRAPHY ... 246
Annex 1: Univariate Analysis for General Model ... 260
Annex 2: List of top 200 Secondary Schools at Ordinary Level in 2012 ... 262
Annex 3: Univariate analysis for children currently attending Secondary School and Above .. 267
Annex 4 : Data for figures ... 269
LIST OF FIGURES
Figure 1 : Net enrolment rates at Primary and Secondary by Region of the World for 2005 ... 54
Figure 2 : Population and School Enrolments at primary and secondary from 1980 to 2010 ... 56
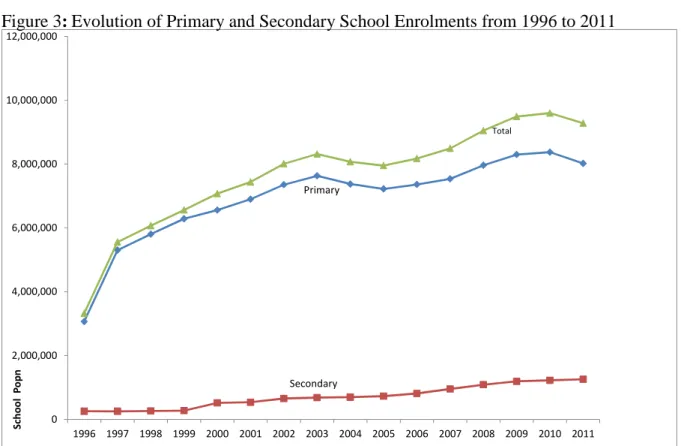
Figure 3: Evolution of Primary and Secondary School Enrolments from 1996 to 2011 ... 57
Figure 4 : Survival cohorts at primary level between 1988 and 2010... 58
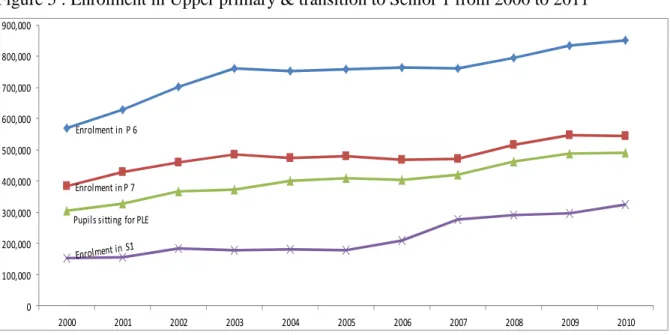
Figure 5 : Enrolment in Upper primary & transition to Senior 1 from 2000 to 2011 ... 59
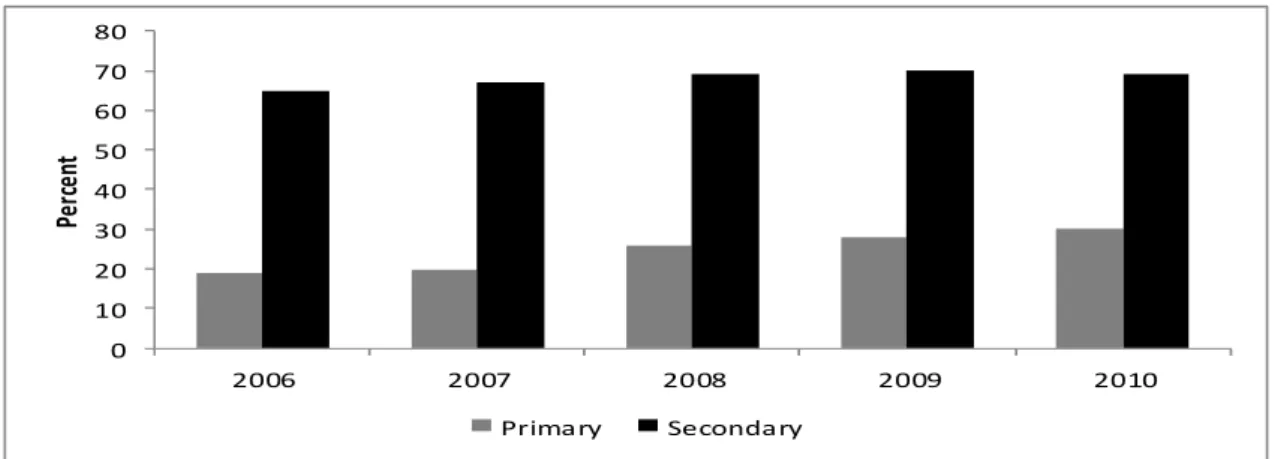
Figure 6 : Proportion of Privately Owned Primary & Secondary schools from 2006 to 2010 ... 63
Figure 7 : Access and Zones of exclusion from primary and secondary schooling ... 68
Figure 8: Location of Uganda in Africa ... 87
Figure 9 : Evolution of Fertility and Mortality in Uganda ... 88
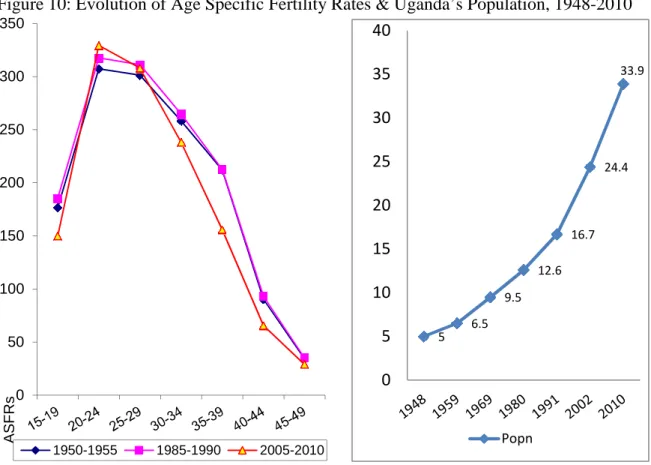
Figure 10: Evolution of Age Specific Fertility Rates & Uganda’s Population, 1948-2010 ... 89
Figure 11 : Distribution of Uganda’s Population by Age and Sex in 2010 ... 90
Figure 12 : Evolution of Total Dependency Ratio in Eastern Africa ... 91
Figure 13: Evolution of Uganda’s GDP growth rate ... 93
Figure 14 : Evolution of Uganda’s GDP per capita ($USD) ... 94
Figure 15 : Evolution of Population below poverty line by region ... 95
Figure 16 : Formal Education Pathways in Uganda... 113
Figure 17 : Evolution of Primary schools and Teachers ... 114
Figure 18 : Evolution of Secondary Schools and Teachers ... 115
Figure 19 : Evolution of Secondary schools by Ownership from 2000 to 2010 ... 117
Figure 20 : Evolution of Secondary schools by Foundation Body from 2000 to 2010 ... 119
Figure 21: Evolution of Secondary Schools by boarding type between 2000 and 2010... 120
Figure 22 : Secondary Schools and Student Classroom ratio (SCR) by Region in 2006 and 2010 .... 124
Figure 23 : Distribution of Secondary schools by type and region in 2006 & 2010 ... 125
Figure 24 : Evolution of School enrolments and Net Enrolment Rate (NER) at Primary ... 127
Figure 25: Evolution of School Enrolments and Net Enrolment Rate at Secondary ... 128
Figure 26: Evolution of the proportion of females enrolled by level of education ... 130
Figure 27: Evolution of NERs at Secondary by Sex between 2000 and 2011 ... 131
Figure 28: Evolution of Net Enrolment Rates at Secondary between 2006 and 2010 ... 133
Figure 29: Evolution of NER and Number of Children aged 13-18 out of Secondary ... 133
Figure 30 : Education Status of Household members aged 13-24 by Single Ages... 142
Figure 31 : Educational attainment for household members aged 13-24 in 2006 and 2010 ... 143
Figure 32 : Relationship to household head by age of head in 2006 and 2010 ... 149
Figure 33 : Reasons for Leaving School by Level of Education in 2006 and 2010 ... 166
Figure 34 : Students enrolled by school type and type of secondary school in 2006 & 2010 ... 221
Figure 35 : Distribution of Students by Occupation of parents and by type of Secondary School ... 229
LIST OF TABLES
Table 1 : Qualitative Data Collection Matrix ... 81
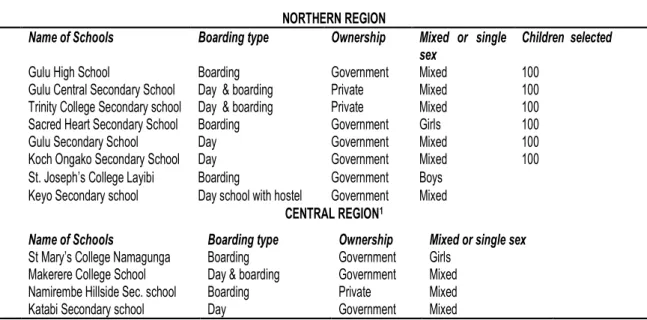
Table 2 : List of schools by type and Region for selected students ... 82
Table 3: Percent of the Population urban between 1969 and 2011 in Uganda ... 88
Table 4 : Evolution of Population density between 1948 and 2010... 90
Table 5: Government’s financing of Education ... 96
Table 6: Evolution of Hypothetical Student Classroom Ratios by Region ... 122
Table 7: Distribution of Members by Educational Attainment and by Individual Characteristics ... 144
Table 8: Distribution of Members by educational attainment and by Characteristics of the Household head ... 147
Table 9: Distribution of Members by educational attainment and by Characteristics of other Household members ... 151
Table 10: Distribution of Members by educational attainment and by Household Characteristics .... 154
Table 11: Distribution of Members by educational attainment and by Community Characteristics .. 157
Table 12: Evolution of Inequalities in access to secondary Schooling between 2006 and 2010 ... 163
Table 13: Evolution of Inequalities in making a transition to secondary for 2006 and 2010 ... 198
Table 14: School Requirements for Term I in some Secondary Schools in Northern & Central Regions by type in 2013... 201
Table 15: Evolution of Inequalities in accessing various levels of education in 2010 ... 214
Table 16 : Comparison of day and boarding schools, a perspective of respondents ... 223
Table 17: Evolution of Inequalities in accessing a boarding facility ... 227
Table 18: Cost of accessing term I by type of School in the North & Central in 2013 ... 229
LIST OF ACRONYMS
A-Level-Advanced Level
CEDAW - Committee on Elimination of Discrimination against Women
EFA- Education for All
EMIS - Education Management Information Systems
GER - Gross enrolment rate
LRA- Lord’s Resistance Army
MDGs- Millennium Development Goals
MoES - Ministry of Education and Sports
NAPE -National Assessment of Progress in Education
NER - Net enrolment rate
O-Level- Ordinary Level
P1-Primary One
PCR- Pupil Classroom ratio
PLE- Primary Leaving Examinations
PTA-Parent-Teachers’ Association
PTR - Pupil Teacher ratio
S1-Senior One
UBOS - Uganda Bureau of Statistics
UNDP -United Nations Development Program
UNEB - Uganda National Examinations Board
UNESCO- United Nations Educational, Scientific and Cultural Organization
UNHS- Uganda National Household Survey
UPE - Universal Primary Education
UPPET- Universal Post Primary Education and Training
ACKNOWLEDGEMENTS
I am very greatly indebted to my Supervisor, Marc Pilon for having accepted to supervise my PhD work. I thank him most especially for his professional guidance, timely response in case I submitted any work to him, patience with me and his parental approach while working with me. I am equally grateful to Valerie Golaz, for having enabled me to meet Marc Pilon and Gideon Rutaremwa that had linked me to Valerie Golaz. The guidance of Valerie before and during this PhD work was helpful. I thank her for her time and professional guidance for this long and for being able to respond to any of my other challenges whether professional or not, all of which enabled me complete this scholarly work. I want to take this opportunity to thank Professor Keith Lewin of the University of Sussex for accepting to share some professional information with me through email although he did not know me.
I thank my wife Joselyne for encouraging me to do a PhD and for her being patient with me during the course of this work. Equally patient and understanding were my children, Charlene, Collin, Charlotte and Calvin. They equally deserve a pat on the back. I cannot forget to thank my parents but more so my surviving mother, Mrs. Magdalene Ngonzi for having taken me to school and for her support all through my life.
I also hereby thank the French government which through the French Embassy in Uganda funded my first three stays in Paris. I also thank INED (Institut National d’études démographiques) for having funded my fourth stay in Paris and given me an office to be able to write this thesis. I am also grateful to CEPED (Centre Population et Développement) for hosting me for most of this time and its management for being parental and caring.
I would also like to express my gratitude to the Carnegie Corporation of New York which through Makerere University Graduate School, funded my fieldwork as well as the fifth and sixth stays in Paris. I cannot forget IRD (Institut de Recherche pour le Développement) which hosted me at Bondy and funded my travel to Paris at some point.
I would like to thank all friends at CEPED, INED, BONDY and those in Kampala that encouraged, guided and comforted me in the course of this work. Last but not least, my thanks also go the families of Marc and Valerie for the affection they exhibited towards me.
ABSTRACT
While access to basic education is at the heart of development, the fact that sustained and meaningful education is critical for emancipation of the individual and entire society is no longer a matter of debate. Indeed, the myriad of advantages associated with sustained and quality mass education presuppose that it should be enjoyed by all as espoused in Education for All Goal 2 and Millennium Development Goals 2 and 3. Since Uganda was one of the first countries in Sub-Saharan Africa to introduce universal primary and secondary education in 1997 and 2007 respectively, this study endeavored to understand the extent to which the said democratization of education has eclipsed inequalities in accessing secondary schooling. This study largely used Uganda National Household Survey data for 2005/6 and 2009/10 that had information on schooling profiles of the household population and other characteristics that have been found to explain schooling outcome differentials. Through appropriate multivariate models, it was possible to map the evolution of inequalities in accessing secondary schooling for all children aged 13-24, making a transition for the ones that completed primary and accessing boarding facilities. Universalizing education at both levels has failed both to enhance completion of primary and dampen inequalities in accessing secondary schooling. Indeed, completion of primary and transition to secondary remain a prerogative of largely children from better socio-economic backgrounds, urban areas and the central region. Children in households below the 25th top percentile of household income, those in the rural, East, West and North, and those under household heads with less than secondary education, remain largely excluded from secondary schooling. Besides, whereas boarding schools (some of which are government schools) are known to offer better quality education that would enable social mobility for disadvantaged children, they are largely inaccessible to the poor as a matter of policy and this exacerbates inequalities in accessing quality secondary schooling. While inequalities in accessing secondary education for all eligible children have largely persisted, making a transition by children from poorer socio-economic backgrounds seems to be more difficult in the recent past than before implying that most children previously entangled in a vicious cycle of disadvantage, are most likely to remain so.
RÉSUMÉ
Alors que l’accès à l’éducation est au cœur du développement, le fait qu’une éducation soutenue et de qualité soit un facteur critique pour l’émancipation d’individus et de sociétés entières ne fait plus l’objet de débats. En effet, la myriade d’avantages liés à une éducation de masse soutenue et de qualité présuppose qu’elle soit à la portée de tous, comme il est décrit dans l’objectif 2 de l’Education pour tous et les buts 2 et 3 des Objectifs du millénaire pour le développement. L’Ouganda étant l’un des premiers pays d’Afrique Subsaharienne à introduire l’éducation primaire et secondaire universelle, respectivement en 1997 et 2007, cette thèse s’attache à comprendre jusqu’à quel point ces politiques de démocratisation de l’éducation ont permis de réduire les inégalités d’accès à l’école secondaire. Ce travail utilise principalement les données des enquêtes nationales de ménages de 2005/2006 et 2009/2010 qui procurent des informations sur le profil éducatif des membres du ménage ainsi que d’autres caractéristiques qui selon les études préalables influent sur les parcours scolaires. Par le moyen de modèles multivariés pertinents, il a été possible de décrire l’évolution des inégalités d’accès à l’école secondaire, de transition du primaire au secondaire, et d’accès aux internats, ce pour l’ensemble des enfants de 13 à 24 ans. L’universalisation de l’éducation au niveau primaire comme secondaire n’a ni pu améliorer l’achèvement du cycle primaire ni réduire les inégalités d’accès au secondaire. En effet, achever le cycle primaire et accéder au secondaire demeurent principalement la prérogative d’enfants issus de milieux socio-économiques privilégiés, de zones urbaines et de la région centrale. Lorsque le chef de ménage n’est pas lui-même allé au secondaire, ou que le ménage se situe en deçà du 25e percentile de revenus, lorsqu’il est en milieu rural, ou situé dans l’Est, l’Ouest ou le Nord du pays, ses jeunes membres demeurent largement exclus du cycle secondaire. En outre, alors que les internats (dont certains sont des écoles publiques) sont connus pour offrir une éducation de meilleure qualité qui permettrait la mobilité sociale pour les enfants défavorisés, ils sont généralement inaccessibles aux pauvres selon la politique sur les internats ce qui accroît les inégalités d'accès à l'enseignement secondaire de qualité. Alors que les inégalités d’accès au niveau secondaire pour tous les enfants persistent, la transition du primaire au secondaire, pour les enfants de milieux socio-économiques les moins aisés, semble plus difficile dans le passé récent qu’auparavant, ce qui implique que la plupart des enfants qui se trouvaient dans un cercle vicieux du désavantage, très probablement y demeureront.
INTRODUCTION
While access to basic education lies at the heart of development, sustained and meaningful access to education is critical for, inter alia, long term improvements in productivity, expansion of the tax base, reduction in inequality and intergenerational cycles of poverty, demographic transition, preventive health care, women emancipation and democratisation (Charbit & Kébé, 2006; Cremin & Nakabugo, 2012; Henaff, 2006; Lewin, 2007c; Majgaard & Mingat, 2012; Pilon, 2006; Wilkinson & Pickett, 2009).
Today, human development perspectives are increasingly redefining development away from the view of the neo-classical economists that often tended to emphasize economic growth and thought that once this was achieved, then the problems of humanity would be solved. The concept of development is no longer equated to growth but rather seen as an all-encompassing phenomenon (Cremin & Nakabugo, 2012).
Indeed, achievement of growth in the 1970s and 80s did not stop an increase in misery and this was due to persistent inequality and unevenness between and within regions (Cremin & Nakabugo, 2012) but also the effect of structural adjustment programs especially in Sub-Saharan Africa (Henaff, 2006). There was increased realisation that development was bigger than growth and needed to be seen through a multidisciplinary angle.
It is in light of this reconfigured definition of development that UNDP initiated the production of Human Development Reports. According to these reports, human development is seen from a larger perspective that encompasses, inter alia, human rights and social development indicators. By using the Human Development Index (measuring life expectancy at birth, educational attainment and income per capita), the approach has moved from measuring economic development in form of GDP per capita to social related indicators (Cremin & Nakabugo, 2012) that may imply better distribution of income and “spread” benefits of growth.
This evolved conceptualisation of development partly explains the redefinition of other concepts like education (and its role) that is increasingly seen not only as for increasing individual productivity and income but also as a precursor to a wider range of advantages that are beneficial to the individual and society. This view is echoed by Henaff when she states
that « l’éducation est donc aussi une condition indispensable sinon suffisante au développement de l’individu et de la société » (Henaff, 2006 p.69).
It is this reformed definition of development that was behind the global development agenda espoused in Jomtien in 1990, reaffirmed in Dakar in 2000 and in New York through the adoption of the Millennium Development Goals. Indeed the centrality of education saw world leaders emphasize in 2008 at a high level meeting to set out concrete plans for action, that although the eight MDGs were quite interdependent, investment in education (and health) would play a major role in achievement of all the rest (Cremin & Nakabugo, 2012).
In the context of the new definition of development therefore, if education is to cause changes in society, it must be spread to include even the ones that are most often excluded (that happen to be the majority in poor countries) as is unambiguously espoused in Education For All goal 2 and Millennium Development Goals 2 and 3. It thus implies that development is not only inextricably linked to equity (or equality), but that any definition of development, especially sustainable development must exhibit equity dimensions.
While the notion of education being “a right for all” was clearly put in the preamble of the EFA founding document as cited by Pilon (2006), the post Dakar period has witnessed greater prominence of “rights based approaches” to educational service provision. Otherwise failure to redress inequalities is likely to lead to a situation where conflict will become more likely, capabilities will be underutilised and the tragedy of the commons (as espoused by Hardin Garret, an American human ecologist) will act to generate individually desirable outcomes for some, but collective disadvantages for many (Lewin, 2007c). Indeed more recent work by Wilkinson & Pickett (2009) has shown that more unequal societies are more likely to manifest with, inter alia, low levels of trust, more cases of mental illness, increased crime, lower life expectancy, higher cases of obesity and lower social mobility that tend to affect all.
Despite the long held view by the World bank that the highest social returns of education are with regard to primary education (although this is not a matter of unanimity as evidenced by works of some scholars; (Cremin & Nakabugo, 2012), this study is particularly interested in access to secondary education as the advantages of education like its impact on productivity of individuals and the entire economy, income redistribution and intergenerational social mobility, the demographic dynamics, most of the health indicators, women emancipation and democratic governance tend to be associated with secondary, if not
Globally, secondary education is of increasing interest to academia, policy makers as well International organizations. It is in this spirit that the 2011 Edition of Global Education Digest by UNESCO Institute of Statistics is entitled “Focus on secondary education: the next great challenge”
Uganda is one of the first countries in Sub-Saharan Africa to introduce Universal Primary Education in 1997 and Universal Secondary Education in 2007. Indeed the main emphasis of the 2004-2015 Education Sector Strategic Plan was not only to improve access to quality education at primary but also ensure that primary school graduates go on to access post primary education and progress in the school system.
The role of secondary schooling in a country’s development was best summarised by
Lewin (2007a), at a Commonwealth conference in Uganda, thus:
• Universal Primary Education depends on adequate flow of secondary school graduates into primary teaching and this is hard to ensure where secondary school enrollments are low.
• HIV/AIDS and conflicts have decimated labor force that needs to be replenished through secondary and probably higher levels of schooling.
• Secondary schooling that generally excludes the poor and vulnerable is one of the opportunities at the hands of policy to redistribute wealth and enable social mobility out of poverty.
• Competitiveness in the modern era depends on knowledge, skills, competencies associated with abstract reasoning, analysis, language communication skills and application of science and technology that are most efficiently acquired through secondary education and finally.
• Failure to satisfy increased demand for secondary schooling is likely to be source of social and political unrest.
Access to secondary schooling remains one of the challenges of policy despite efforts by government as already seen. Indeed, while at primary the net enrolment rate improved from 86% to 96% between 2000 and 2012, at secondary level the equivalent indicators for the two data points were 13% and 23% respectively, based on Ministry of Education data (MoES, 2013). Secondary schooling continues to be a “no go area” for more than three-quarters of children in the relevant age group.
Besides, there are other structural challenges that militate against universalising secondary schooling as elucidated: first, pupils have to pass a competitive Primary Leaving Examination to go to secondary in which better performance has been an almost exclusive privilege of children from private and or boarding (expensive) primary schools. Secondly, about 70% of all schools at the secondary level are privately owned. Thirdly, some government schools, especially the old prestigious schools are boarding schools whose costs (largely exorbitant) are by policy borne by parents. Fourthly, selection to join these old prestigious schools is so discriminative in favor of children whose parents have better social, political and religious connections and finally, there are still a number of sub counties without a secondary school despite government commitment to construct a secondary school per sub-county.
This study largely bases on Uganda National Household Survey data collected in 2005/6 and 2009/10 to map the evolution of inequalities in accessing secondary schooling before and after the Universal Secondary education Policy of 2007. These surveys collected information on schooling profiles of the household population and several other individual, household and community level variables that are hypothesized in this study like in many others to influence schooling outcomes.
The study of inequalities in accessing education (secondary schooling in this case) has previously been a preoccupation of many scholars in various domains. These have largely studied household level factors (broadly speaking) and their effect on access to basic education and or retention in the school system. The interest in this kind of study can be traced to the work of economists when they coined the term “demand for education” to determine factors outside the school confines, and especially at the household but also community levels that affect several schooling outcomes. The work of economists has since been greatly enriched by, inter alia, sociologists or anthropologists, demographers and educationists.
The following brief overview is to explore the contributions of different professions to this subject in order to put into perspective this study but also with an aim of judiciously blending these perspectives in explaining the research findings. The place of interdisciplinary research in providing a holistic understanding to most of social science phenomena is increasingly more of a norm than an exception. The approaches seen are those by economists,
The term “demand for education” that is now popularly used to refer to household level factors as correlates of schooling outcomes is borrowed from economics where the notion of demand is used to refer to the willingness and ability to buy goods or services at a given price. The contribution of economists is rooted in the Human Capital theory that was started by Schultz in 1970 and expounded upon by Becker and others in the mid-seventies and thereafter (Becker & Lewis, 1973; Becker & Tomes, 1976). This was after the realization that growth of physical capital had little impact on growth of income hence interest in improving skills and training. Education is regarded as an economic good because it is scarce and needs to be apportioned. It is a consumer good and offers utility, as well as, a producer good that is used to produce other goods. As a capital good, it can be used to develop human resources necessary for economic and social transformation. Indeed, the wholesome adoption of education in development policies is strongly rooted in the Human Capital theory (Olaniyan & Okemakinde, 2008). Education is for the purpose of improvement of one’s human capital in terms of knowledge, skills and social capital and is thus an investment for future benefits in form of income. An individual thus consumes part of his time and other goods to go to school in anticipation of economic benefits.
At the household level, parents make economically rational decisions in investing in children, i.e. they look at the net present value of costs and benefits from such investment. They would preferably invest in children with higher academic promise or more of boys as they may expect better income opportunities for the boys than the girls. The theory is premised on altruism of parents whereby they invest in their children to improve their lifetime income, but also that the children may help them in their old age. The theory assumes perfect markets that denote free entry into the market and wage as a function of human capital. The altruism of parents is hampered by resource constraints and in this case, quality and quantity tradeoffs come in whereby an increase in quality is more expensive if there are more children and an increase in quantity (number of children) is harder if children are of higher quality. This then leads to the fact that a higher number of children, implies, less capacity by the household to educate them in which case they may educate few of them as a coping strategy.
The theory by economists has been criticized for assuming the perfection of markets that is not common in Africa where access to credit is limited, ignoring the fact that a child can work and study, underestimating the uncertainty of future salaried employment, downplaying the connection between benefits of education and one’s background,
disregarding the role of the extended family in cushioning the effects of having many children and above all, ignoring cultural and religious considerations that have been found to affect schooling decisions (Buchmann, 2000; Kobiané, 2006; Olaniyan & Okemakinde, 2008).
The work of sociologists indeed shows that the theories of economics have some weaknesses. The contribution of sociologists is with regard to their unit of analysis, more interactive methods like observations and focus group discussions and theories of sociology of education. Demand for education is also related to norms and values in society. It is true that the constraints to education may be monetary but they are quite often also social or cultural and examples in Africa show how economic and cultural factors combine to explain the choice to send children to school and keep them there. While economists, demographers and statisticians have come up with figures to explain the “what” of situations, the questions of “why” and “how” have been answered better by sociologists and anthropologists. The following examples vindicate the role of socio-cultural factors in children’s education:
In the northern part of Nigeria that is largely Muslim, education of the girl child has lagged behind because of the Islamic fundamentalist laws that promote early marriages and discourage the mixing of boys and girls (Lincove, 2009). In some cultures in Uganda, where bride price is a preliquisite for marriage, some parents have exhibited more interest in the “pay” from the girls than their education after all “they will end up in the kitchen” and this explains why in some communities, the girl child is still disadvantaged (Tumushabe, Barasa, Muhanguzi, & Otim-Nape, 1999). In India (Siddhu, 2011), the fear for the safety of girls negatively affected access to secondary schooling by the girls while in Indonesia, Takahashi (2011) talks of “peer and neighborhood effects” in which case children were likely to be enrolled if they were in areas with high enrollment, something related more with social behavior than costs and benefits of education.
Whereas in terms of theory the contribution of demography is so little, recently especially in the francophone world, education is increasingly of interest to demographers. In traditional Demography, that had since emphasized the three population dynamics of fertility, mortality and migration, education was of interest in as far as it impacted nuptiality, morbidity, mortality, fertility and migration. Recently, with increasing realization of the importance of interdisciplinary research and following the 1994 International Conference on
education and development and the impact of education on sustainable development, education is increasingly looked at as a standalone topic of study by demographers.
One novel and noble contribution of demographers is the pioneering into the use of Household Survey and Census Data (hitherto underutilized) to investigate correlates of access to schooling as these datasets include information on the schooling status of children and other factors that have been found to impact children’s schooling outcomes (Pilon, 1995; UIS, 2004 ; Marcoux & Pilon, 2003). This comes after the realization that the traditionally collected statistics at the school level, i.e. enrolment, sex and age of child by class, in Education Management Information Systems (EMIS) data of most countries were shallow and ignored the role of household related factors in sending children to school and keeping them there. Indeed, one of the reasons why the traditionally used enrolment statistics have not been able to measure the progress towards EFA and MDGs is the fact that measurement is in school and on limited variables (Gérald & Pilon, 2005). It is indeed true that school factors are key, although household factors are not, in any way, less critical. In this vein, despite free education initiatives, some households have not been able to enroll their children in school but, most importantly, households have reacted differently in the face of universalized education to the extent that factors at the household level remain critical in measuring the aptitude with which households can react and the extent to which children that enroll progress in school and or transit to subsequent levels. In addition, demographers have come up with retrospective studies that are longitudinal and help overcome the challenges of cross sectional data. Studies in this line are: «Scolarisation et travail des enfants à Ouagadougou » carried out in 1993, « Dynamiques familiales et éducation des enfants à Bamako » done in 1996
« Dynamiques familiales et éducation des enfants au Mali » of 1999, all as cited in Kobiané, (2006), and more recently, a study on parental death and children’s schooling in Burkina Faso (Kobiané, Calvès, & Marcoux, 2005).
The work of educationists can be seen through the creation of the Consortium of Research on Educational Access, Transition and Equity (CREATE) at the Centre for International Education , University of Sussex whose mandate was to investigate into issues of access, equity and transitions in the aftermath of EFA and MDGs. These have endeavored to link the issues of enrolment with the indicators of internal efficiency and hence emphasizing and redefining access in the context of real learning and achievement but not just physical access (Lewin, 2011b). These scholars are emphasizing not only enrolment but meaningful learning that should translate into access to the subsequent levels. They have
come up with a model on “zones of exclusion” (to be seen in detail later) that illustrates how typically, enrolments decline steeply through the primary grades in poor countries and how children attending irregularly and or achieving poorly fall into the “at risk” zones. Zone 1 looks at children that never enroll in school, zone 2 is about children that enroll just only to drop out before the end of primary, zone 3 concerns children in primary but silently excluded i.e. likely to drop out due to overage entry, absenteeism and recurrent repetitions, zone 4 is about children who complete primary and do not transit to secondary school, zone 5 describes children that drop out of secondary, and zone 6 looks at children that are in secondary but at the risk of drop out due to “silent exclusion”.
In addition to being interested in issues of equity, transition and the impact of real learning at the lower levels on access to subsequent levels, this framework is a guide to researchers that may conduct studies in respect to any one or several of the exclusion zones, but most importantly, scholars increasingly interested in access to secondary schooling.
Having looked at the contributions of various scholars in studying access to schooling, it may be important to see in a greater detail what has been done in this regard in especially Sub-Saharan Africa and this is the main subject matter of the first chapter.
In this chapter, literature on factors impacting access to basic education, retention at primary, and or access to secondary in largely greater Sub-Saharan Africa is extensively reviewed. The review of factors related to primary schooling is justified because all children must go through primary to access secondary. Besides, some children may not be enrolled at secondary because they never enrolled at primary in the first place or they never completed primary or simply because they did not make a transition to secondary that discussing inequalities in accessing secondary without understanding inequalities at the lower level would be missing the point.
Chapter two presents the problematic, data and methods to be used as well the demographic and economic context on Uganda.
In chapter three, evolution of education policy since independence is explored. Besides, an attempt is made to examine the impact of education policy on both demand and supply of education at primary, but most importantly, secondary level.
Chapter four is an exploratory chapter in preparation for multivariate analysis in the subsequent chapters. It maps education profiles of the household population aged 13-24 by
In chapter five, this study investigates the role of individual, household and community variables on impacting the probability of ever accessing secondary schooling for all children aged 13-24 years and their evolution after the USE Policy of 2007. It is called a global multivariate model because it is preoccupied with ever accessing secondary school as opposed to (i) never being enrolled at primary, (ii) ever being enrolled but dropping out of primary, (iii) still being enrolled at primary despite attaining the age for secondary and (iv) completing primary but never making a transition to secondary.
In chapter six, emphasis is laid on making a transition to secondary schooling for children that may have completed primary. Here, the effect of individual, household and community levels variables on ever making a transition to secondary and their evolution between 2006 and 2010 is explored.
It is one thing to access secondary schooling and yet another to access quality (as defined by performance) secondary schooling. It is in this spirit that the last chapter (seven) investigates the role of individual, household and community level factors on impacting access to boarding facilities (some of which are government schools) that generally provide better quality education although policy dictates that their costs be borne by parents.
CHAPTER ONE: THE ROLE OF DEMAND AND SUPPLY
FACTORS IN INFLUENCING SCHOOLING OUTCOMES
This chapter explores into studies done on inequalities in accessing school, retention in the school system and progression to secondary level in largely Sub-Saharan Africa. In line with the work of economists and later other scholars, these have taken the appellation “demand and supply factors” and have been tackled at the individual, household and community level.
In Sub-Saharan Africa, literature on education and especially with regard to access, equity and educational attainment in general, has largely focused on primary education in line with the 1990 Education For All commitments at Jomtien, reaffirmed in Dakar in 2000 and the Millennium Development Goals (Nakabugo, Byamugisha & Bithaghalire, 2008). In other parts of the developing world like Asia and South America, academics, policy makers and researchers are increasingly getting interested in access or transition to secondary education after the realization that attrition at the primary level is high and that survival rates to the end of the primary cycle are low (Lewin, 2011a ; Ahmadi, Hussain & Bose, 2005; Siddhu, 2011).
Generally, universalizing education has been characterized by dampening quality due to bourgeoning school-age going cohorts on one hand and increased costs on the part of governments on the other hand, which in turn explain overcrowding of classes, reduced numbers of trained teachers and overburdened school infrastructure (Ssewamala, Wang, Karimli & Nabunya, 2011; Lewin & Akyeampong, 2009; Somerset, 2011; Akyeampong, 2009; Somerset, 2011;Chimombo, 2009 ; Deininger, 2003; Oketch & Somerset, 2010) that have led to increasing inequalities (Zuze & Leibbrandt, 2011) which are exacerbated at the secondary level (Akyeampong, 2009; Henaff & Lange, 2011; Lewin, 2011b; Rolleston, 2009; Oketch & Rolleston, 2007).
Looking at access to secondary, in a way, involves looking at issues of internal efficiency and wastage at the primary level for primary education is a cost to governments (MoES, 2004) who invest colossal sums of money in buildings, scholastics, teacher education, teacher salaries and capitation grants. It is also a cost to parents that would hope to reap a lot from their children once they have completed and are working. It is equally a cost to the children that invest a lot of time and energy. Besides, an inefficient school system
would be a great cost to society in general as an increase in the proportion of children out of school may have negative social, economic and political consequences (Lewin, 2007c; Pilon, 2002a).
Issues of access to the secondary cycle should be appreciated in the context of the current education indicators of Gross and Net (Attendance or Enrolment) rates used to date, to monitor milestones towards the attainment of MDGs and EFA commitments, that have been found to have numerous deficiencies (Gérald & Pilon, 2005; Lewin, 2011b; Marcoux & Pilon, 2003; Pilon, 2005 ; Bernard, 2010).
It flows from the foregoing that the review of literature on access to secondary schooling cannot be done in isolation of factors related to accessing primary, retention and or dropouts at that level and completion of the primary school cycle. This is true because: (i) some children may not access secondary since they did not enter primary but also because; (ii) access to secondary may be determined by a multiplicity of factors that impact retention (or dropouts) at the primary level. While some authors have found out that the factors explaining access to primary, completion of primary and access to secondary are only slightly different (Kabubo-mariara & Mwabu, 2007; Bajracharya, 2010), it would be wrong to assume that they are always so, over time and space. Besides, the pathways through which these factors operate to impact access and or retention may also vary in time and space.
For this reason, factors related to equity, access, dropout, and grade attainment at the primary level and access or transition to secondary level shall be reviewed separately and those common to both cycles highlighted while different ones and the extent of their difference explored. These are largely factors that explain demand for education and are therefore tackled from the perspective of the consumers (parents and children). They can be categorized as individual (child related), household, household head, other household members and community level factors or characteristics (Marcoux & Pilon, 2003; Pilon, 2002b; UIS et al., 2004).
1.1
Child factors and primary schooling
1.1.1
Sex of child
Several studies have found out that female children were more disadvantaged with regard to primary schooling as compared to their male counterparts. This was found to be true in Ghana (Fentiman, Hall, & Bundy, 1999; Rolleston, 2009), Peru (Ilon & Moock, 1991), Kenya (Kabubo-mariara & Mwabu, 2007), Burkina Faso (Kobiané, 2006) and its capital Ouagadougou (Pilon, 2002a) as well as Nepal (Bajracharya, 2010). In the case of Kenya, while girls were more disadvantaged at enrolment, grade attainment was not gender selective, once enrolled.
On the other hand, other studies in Uganda (Kakuba, 2012) and Bangladesh (Maitra, 2003) have found no gender gaps with regard to initial enrolment and retention at primary.
Important to note is that where gender parity has been achieved at national level, this has continued to mask inequities for the poorer strata of society (Henaff & Lange, 2011) in the countries of the South in general, and at regional, district or even lower levels in Uganda, in particular (UNICEF, 2005). Indeed, recent literature shows that the gender gap with regard to accessing and completion of primary has greatly narrowed in Uganda (Deininger, 2003); Kakuba, 2006; UBOS and Macro International Inc, 2007 ; UNICEF, 2005) although gender inequities still remain in the for-long unstable regions of the north, pastoralist communities of the north-east and especially the Karamoja region as well as the far southwest, particularly Bundibugyo (MoES , 2011; UNICEF, 2005). In these areas, girl child education was found to be affected by child labor in households, early marriages and teenage pregnancies (UBOS, 2010) all exacerbated by the low value attached to the girl child in the cultures of the concerned communities (Roach, 2009). Over and above the mentioned challenges, other scholars also point out lack of female teachers to work as role models in most of the rural schools, skepticism by some parents about labor market possibilities for their daughters and some cultural and religious beliefs (Nassali, 1998; Buchmann, 2000; Fentiman et al., 1999; Lincove, 2009) as some of the other challenges that stand in the way of girls’ education.
Other concerns that are increasingly interesting scholars are gender differentials in achievement (performance) and age appropriate enrolment at the subsequent level. In this case, Wells (2009) found out that girls were more likely to be enrolled later at secondary level than the official age in Uganda, and that this was associated with dropouts and less success in their secondary schooling, for those that remained.
1.1.2
Age of Child
Besides being introduced in many models as a control variable, age is a critical determinant of enrolment because it may impact the ease with which a child may; do the learning, progress in school and conversely, the probability of dropout. In most countries, age at enrolment is fixed, although in most of the developing world, children start later than scheduled for various reasons.
Most children were found to enroll in school later than the officially prescribed ages in Uganda (Wells, 2009; Tumushabe et al., 1999; Uganda Bureau of Statistics, 2010b), Kenya (Kabubo-mariara & Mwabu, 2007), Tanzania (Ainsworth, Beegle, & Koda, 2005), Ghana (Fentiman et al , 1999), Burkina Faso (Kobiané, 2006), Malawi (Chimombo, 2009) and Madagascar (Lewin & Sabates, 2011). In Uganda, the reasons for late entry included long distance to school, school being too expensive, bad terrain in hilly areas and in areas with rivers, need for labor at home, illness and a child being too young given poor feeding at home and in school where a young child could not withstand the hunger (UBOS, 2010a; UBOS & ORC Macro, 2001).
In Ghana, while girls were likely to enroll at the right age as compared to their boy counterparts, old age entry into school led to dropouts as the value of a child’s time increases with age and this was more true in the rural and poorer households. Equally, children were found not to enroll on time because of ill health, poor nutrition and long distance to school in some regions. A good number of respondents said their children were not enrolled because they were too young (despite having the right age), because they (the children) lacked the social or cognitive skills to enroll or had poor physical development due to poor nutrition. Variations in age at entry were found to be bad as this impeded learning since older children tended to harass younger ones.
On the basis of the literature reviewed, it was found that age at enrolment exhibited a curvilinear pattern i.e. the probability of enrolment increased with age at a decreasing rate and this was true in Kenya (Kabubo-mariara & Mwabu , 2007), rural India (Siddhu, 2011), Uganda (UBOS & Macro International Inc, 2007), Bangladesh (Maitra, 2003), Ghana (Akyeampong, 2009), and Burkina Faso (Kobiané, 2006), among other countries.
(Akyeampong, 2009; Ohba, 2009) because the value of their labor appreciates with age. For the girls, an additional challenge is that they reach puberty while still in primary and this coupled with long distance to school, peer pressure and wrong attitudes to girl education in some communities (UNICEF, 2005), often explains sexual harassment from both peers and teachers, teenage pregnancies, elopement, early marriages and hence dropouts (New Vision, 2011).
The effect of overage enrolment on learning outcomes and the possibility of dropout is best summarized by Lewin & Sabates, thus:
First, children who enroll above the normal age will miss learning experiences at a time when they are most receptive to learning basic skills, and establishing secure foundations for subsequent cognitive development. Secondly, the more overage a child is for a grade, the more it is likely that they will underachieve. Thirdly, where children are taught with older children, there are likely to be psycho-social issues (self-esteem, bullying, sexual harassment) and challenges in learning more so since these children are mostly in monograde teaching systems. And lastly, overage children will be the last to arrive at the end of the primary cycle and in many societies, these are the ages of entry into labor or marriage (Lewin & Sabates, 2011 p.12).
1.1.3
Relationship to household head
In the African context, children do not exclusively live in households of their biological parents for some reasons. Some may be orphaned and taken over by relatives, some often live in other households that are closer to better schools in search for better education while others go to work as maids or houseboys in other households, especially in the urban areas in the context of increased female labor force participation and the demands of salaried employment.
Most studies that have largely used secondary census or survey data are increasingly getting interested in the relationship between children surveyed in households with the household head and its implications for schooling outcomes.
Studies have found that a child that is a biological offspring of the household head is more likely to enroll and progress in school than relatives, non-relatives and other children and this was true in Kenya, (Kabubo-mariara & Mwabu 2007), Uganda (Kakuba, 2012), Burkina Faso (Kobiané, 2006) and its capital Ouagadougou (Wayack-Pambè & Pilon, 2011), Togo (Pilon, 1995), Tanzania (Ainsworth et al., 2005), Ghana (Rolleston, 2009) and several countries [Burkina Faso, Cote d’Ivoire, Ghana, Guinea, Mali, Niger, Senegal and Togo] in West Africa (Pilon, 2005).
What seems to come out from the relationship between foster hood and schooling was summarized by Pilon following several studies in several countries in West Africa. Generally, children fostered in other households in villages, indicative of rural-urban differentials in school supply, were more likely to be enrolled in school compared to children of household heads while in towns, foster hood tended to disfavor more of girls than boys and was more prevalent in richer households where girls were often employed as house helpers (Bruyninckx & Pilon, 2010; Pilon, 2005, 1995, 2002a). This however does not preclude that some children in the urban areas would indeed come to get education but end up performing badly, repeating classes and dropping out of school due to much domestic work in the receiving households (Bruyninckx & Pilon, 2010; Pilon, 2005, 1995, 2002a).
The effect of the relationship between the child and the household head on schooling was found to be moderated by, inter alia, the financial involvement of the sending household in the upkeep of the fostered child, the degree of closeness between the two households, the place of the child in the new home (Pilon, 2005) and the motive for the coming of the child into the receiving household as elucidated by Pilon (1995) in the case of Togo. In the latter case, if a household had its own children (children of the head), then fostered children were less likely to be enrolled than children of the head. On the other hand, children fostered in households with no children of the household head, were more likely to be enrolled and this points to some children coming in as house helpers while others come in to get better education.
1.1.4
Orphanhood status
Orphans are expected to be disadvantaged with education following the death of the bread winner but also because they take on more responsibilities during sickness, especially if it is long sickness, and after the death of one, and worse still, both parents.
In seven countries in Sub-Saharan Africa (Lloyd & Blanc, 1996) and North Western Tanzania (Ainsworth et al., 2005), orphanhood did not affect school enrolment although in the case of Tanzania, loss of a mother, and worse still, both parents affected the number of hours of school attendance during sickness and within the few months following the death of either mother or both parents.
Some scholars have gone ahead to look at the effect of maternal, paternal and double orphanhood on school enrolment in the urban and the rural areas and or for boys and girls, separately. In Burkina Faso, Kobiané et al. (2005) found out that double orphans were more disadvantaged in the rural than urban areas and that orphanhood tended to affect girls more than boys. The effect of orphanhood on education was generally found to be ambivalent given the role of the extended family and NGOs in cushioning the otherwise detrimental effects. It also varied by place of residence, type of orphanhood, sex of the orphan and the willingness and ability of the relatives to care for the orphans.
1.2
Household level factors and primary schooling
These factors include household wealth or income, parents’ education, family size, sex, religion, ethnicity, marital and employment status of household head as well as household size and structure.
1.2.1
Household wealth or income
In situations where there is no readily available data on household expenditure or income, principle component analysis and or multiple cluster analysis (Filmer & Pritchett, 2001; Kobiané, 2004) have been devised to categorize households according to various wealth or poverty levels.
Household wealth seems to be a very strong factor explaining access to basic education, progression in school and educational attainment, in most of the developing countries. The relationship between the level of household wealth and access to basic education was found to be consistently positive as vindicated by studies in Uganda (Balihuta & Semogerere, 1995; Roach, 2009; UBOS and Macro International Inc, 2007; UBOS, 2011; UNICEF, 2005), Tanzania (Ainsworth et al., 2005), Kenya (Kabubo-mariara & Mwabu, 2007), Peru (Ilon & Moock, 1991), Cameroun (Wakam, 2003), Malawi (Chimombo, 2009), Ghana (Rolleston, 2009; Fentiman et al. 1999), Conakry in Guinea (Glick & Sahn, 2000), Nepal (Bajracharya, 2010), Burkina Faso (Kobiané, 2006), Ouagadougou, the capital of Burkina Faso (Wayack-Pambè & Pilon, 2011), Nigeria (Lincove, 2009), the Democratic Republic of Congo (Mabika Mabika & Shapiro, 2012) and seven countries in Sub-Saharan Africa (Kenya, Tanzania, Cameroun, Niger, Malawi, Namibia and Zambia) (Lloyd & Blanc; 1996).
Recent literature, in the aftermath of various universal education initiatives, seems to indicate no improvement since household wealth remains the strongest predictor of access to basic education as found out in six Anglophone (Kenya, Malawi, Nigeria, Tanzania, Uganda and Zambia) and seven francophone countries (Benin, Burkina Faso, Cameroun, Madagascar, Mali, Niger and Senegal) in Sub-Saharan Africa (Lewin & Sabates, 2011), while comparing the pre and post universal primary education implementation years.
The effect of household wealth on education can be tackled from two perspectives: (i) the ability (or inability) to foot direct costs like fees and indirect costs like feeding of children, scholastic materials, uniforms, transport to school, building fund, among others but also (ii) opportunity costs i.e. the labor of children missed if they are to enroll in school, which largely affects poorer, rural based and peasant households but more disproportionately the girls as was the case in Kenya (Kabubo-mariara & Mwabu, 2007), Uganda (UNICEF, 2005), Burkina Faso (Kobiané, 2006), Nigeria (Lincove, 2009) and Ghana (Akyeampong, 2009).
To expound on the effect of costs, despite the existence of universal primary education in Uganda since 1997, the Uganda Eddata Survey documents that “monetary reasons” stood out as the main factor why children had never been enrolled and for dropouts, four years into the implementation of the program (UBOS and ORC Macro, 2001). The
following a panel study of the same households at two data points by the Uganda Bureau of Statistics (UBOS, 2011).
In Uganda, costs on books, other supplies and uniforms (UBOS, 2010a), other fees charged by some schools to cover salaries of teachers since the government often delayed to pay (Zuze & Leibbrandt, 2011) as well as lack of interest in school (Ssewamala et al., 2011(Deininger, 2003; Kalule, 2000) were still some reasons for non-enrolment and poor retention of some children. Studies elsewhere have in addition made mention of building fund, sports and water bills, costs on clothing, accommodation, feeding and PTA fees, still being charged by some schools as posing a challenge to education of mostly the very poor household population as was reported in Ghana (Akyeampong, 2009), Kenya (Kabubo-mariara & Mwabu, 2007; Somerset, 2011), Malawi (Chimombo, 2009; Kadzamira & Rose, 2003), rural Madagascar (Deleigne & Kail, 2010) and Burkina Faso (Pilon, 2010). This is despite great efforts to subsidize primary education through either provision of registration fees and school kits to all children, provision of capitation grants and school facilitation grants or the removal of fees thereby making primary education “universal and free” in these countries. To illustrate this point, Kabubo-mariara (2007) points out that despite introducing free primary education in Kenya in 2003, high levels of poverty and other expenses on uniforms, books and transport were still affecting enrolment of close to 10% of the eligible age-group.
1.2.2
Parents’ education
Education of both father and mother, have an impact on the enrolment status of children but also their progression in school. Generally, the level of education of parents/household heads has been positively associated with higher chances of enrolment and attainment for children and this was found to be true in Uganda (Deininger, 2003; Kakuba, 2006), Tanzania (Ainsworth et al., 2005), Nepal (Bajracharya, 2010), Guinea (Glick & Sahn, 2000), Togo (Pilon, 1995), Ouagadougou (Pilon, 2002b ; Wayack-Pambè & Pilon, 2011), Burkina Faso as a whole (Kobiané, 2006), Nigeria (Lincove, 2009) and in seven countries in Sub-Saharan Africa (Lloyd & Blanc 1996).
Some authors have gone ahead to look at the differential effect of paternal or maternal education on schooling outcomes of girls, boys and both girls and boys.
In rural Peru (Ilon and Moock 1991), Bangladesh (Maitra, 2003) and six countries in Sub-Saharan Africa (Pilon, 1996), mothers’ education was found to be a bigger factor than fathers’ education with regard to school participation and had a bigger impact on children’s education, even for the next generation. In the case of Sub-Saharan Africa, Pilon illustrates this point thus:
La configuration "père non instruit/mère ayant été scolarisée" procure dans la plupart des cas des chances de scolarisation un peu plus élevées que la situation inverse "père ayant été scolarisé/mère non instruite". Cela se vérifie dans tous les pays pour les garçons, et dans trois des six pays pour les filles (au Kenya, à Madagascar et au Malawi) (Pilon, 1996, p.30).
On the contrary, in Kenya (Kabubo-mariara & Mwabu, 2007), father’s education was more important for children’s enrolment than mothers’ education and in Kinshasa, (Shapiro, 2003), increased paternal education was associated with increased education of especially the daughters. It is evident that education of parents, in the same capacity as the wealth status of households is a key factor in children’s education. It is therefore important that the mechanisms through which parental education operates to impact children education be hypothetically explored. In the first place, there is a strong correlation between education and wealth status so that the positive effect of parents’ education on children’s education may be confounded by the effect of income on education. Secondly, an educated parent is more liberated from backward attitudes that down play the role of education and more so that of the girl child. An educated parent has the cognitive abilities and can mobilize time (because of the importance they attach to education) to help the children with class work (Deininger, 2003), which enhances learning, retention and progression in school. Since educated parents will most likely be engaged in off farm activities, their children are, most likely, not to engage in constraining domestic work, that may lead to lack of time for revision, absenteeism, poor performance and ultimately, dropouts.
The differing effects of paternal and maternal education on both boys and girls could be linked to the real and perceived market value of the labor for both sexes on the market, the expectations of the parents about the probability of being looked after in their old age (Buchmann, 2000) and the cognitive abilities of the children in question.