Phylogenetic structural modeling of molecular evolution
par Nicolas Rodrigue
Département de biochimie faculté de médecine
Thèse présentée à la faculté de médecine en vue de Fobtention du grade Ph.D.
en bio-informatique
Décembre, 200f
o
§
3)
p
Direction des bib1othèques
AVIS
L’auteur a autorisé l’Université de Montréal à reproduite et diffuser, en totalité ou en partie, par quelque moyen que ce soit et sur quelque support que ce soit, et exclusivement à des fins non lucratives d’enseignement et de recherche, des copies de ce mémoire ou de cette thèse.
L’auteur et les coauteurs le cas échéant conservent la propriété du droit d’auteur et des droits moraux qui protègent ce document. Ni la thèse ou le mémoire, ni des extraits substantiels de ce document, ne doivent être imprimés ou autrement reproduits sans l’autorisation de l’auteur.
Afin de se conformer à la Loi canadienne sur la protection des
renseignements personnels, quelques formulaires secondaires, coordonnées ou signatures intégrées au texte ont pu être enlevés de ce document. Bien que cela ait pu affecter la pagination, il n’y a aucun contenu manquant. NOTICE
The author 0f this thesis or dissertation has granted a nonexciusive license allowing Université de Montréal to reproduce and publish the document, in part or in whole, and in any format, solely for noncommercia? educational and research purposes.
The author and co-authors if applicable retain copyright ownership and moral rights in this document. Neither the whole thesis or dissertation, nor substantial extracts from it, may be printed or otherwise reproduced without the author’s permission.
In compliance with the Canadian Privacy Act some supporting forms, contact
information or signatures may have been removed from the document. While this may affect the document page count, it does not represent any loss of content from the document.
Cette thèse intitulée:
Phylogenetic structural modeling of molecular evolution
présentée par Nicolas Rodrigue
a été évaluée par un jury composé des personnes suivantes: Sabin Lessard président-rapporteur Hervé Philippe directeur de recherche David Bryant codirecteur Franz Lang membre du jury Jeffrey L. Thorne examinateur externe François Major
Le domaine de la biologie moléculaire computationnelle n’en est qu’à ses débuts. En dépit des technologies modernes permettant de produire et d’archiver de grandes quantités de données. les modèles tentant d’expliquer ces données sont encore bien loill d’un niveau de réalisme acceptable. Par exemple. la plupart des modèles phylogéné tiques d’évolution moléculaire reposent sur l’hypothèse que chaque position (site) d’une protéine évolue indépendamment des autres positions. Cette simplification est évoquée pour des raisons de calcuL bien qu’elle soit hiologiquement infondée.
Dans cette dissertation, nous explorons différentes techniques computationnelles pour l’étude de modèles phylogénétiques avec interdépendance entre les acides aminés d’une protéine, ou entre les codons du gène associé. Ces modèles prennent en compte les interdépendances résultant de la structure tertiaire de la protéine, utilisant des représentations structurales simplifiées en combinaison avec des potentiels statistiques. eux-mêmes dérivés d’une base de données de protéines ayant des structures connues. Dans ce contexte, les potentiels statistiques procurent une estimation de la compatibilité d’une séquence d’acides aminés dans une structure donnée. Ainsi, le critére de compati bilité de l’ensemble de la séquence avant et après un évènement de substitution aura une influence sur la probabilité d’un scénario évolutif. Nous appliquons une analyse Bayesi enne de sélection et d’évaluation de modèle—par l’entremise de calculs numériques de vraisemblances marginales, et de vérification prédictive—étendu sur plusieurs types de modèles d’évolution, avec et. sans critère de compatibilité structurale. En y considérant deux niveaux d’interprétation des données (soit focalisé sur des séquences d’acides am inés, ou bien sur des séquences nucléotidiques codantes), nous proposons le concept de référence phénoménologique, comme moyen d’évaluer et de dégager des pistes de
modélisation méchanistique.
considérations de compatibilités structurales apportent toujours une amélioration de la vraisemblance marginale. Par contre, l’usage d’un potentiel statistique en soi n’explique pas des caractéristiques bien connues de l’évolution moléculaire. tel que l’hétérogénité des taux de substitutions entre sites, ou l’interchangeabilité de paires d’acides aminés. D’autres études seront nécessaires afin d’établir si de meilleurs potentiels statistiques. ou d’autres mesures, peuvent arriver à reproduire ces caractéristiques. Pour l’instant,
les meilleurs modèles sont ceux qui combinent un potentiel statistique avec une formula
tion sous-jacente suffisamment riche et bien construite. Nous proposons plusieurs pistes de recherche, menant à un cadre qui pourrait éventuellement avoir des répercussions sur l’inférence phylogénétique, la détection et la caractérisation de pressions sélectives. la prédiction de structure. l’interaction protéine-protéille. et le dessin de séquences pro téiques.
Mots clés : évolution moléculaire; phylogénie; structure protéique tertiaire: poten
tiel statistique: chaîne de Markov Monte Carlo; statistique Bayesienne: modélisation phénornenologique; modélisation méchanistique.
The field of computational molecular biologv is at an ea.rlv stage. Despite major advances in producing and gathering large quantities of molecular data, the actual deveiopment of models capable of adequately explaining such data are stiil a far cry from a suitable level of realism. For instance. most phylogenetic models of moiecular sequence evolution assume that each position of an alignment evolves independently of ail other positions—a computationally motivated simplification well-known to be biologically unsound.
In this work, we explore different computational methods for the study of phyloge netic models that allow for a general interdependence between the amino acid positions of a protein. or hetween the codons of the associated gene. The models are focused on site-interdependencies resulting from sequence-structure compatihility constraints, using simplified molecular structure representations in combination with a set of statis tical potentials. which are themselves derived from a protein database of resolved struc tures. This structural compatibility criterion defines a sequerice fitness concept. and the metliods developed eau incorporate different site-interdependent sequence fitness mea surements. We apply Bayesian methods of model selection and assessment—based on numerical calculations of marginal likelihoods, and posterior predictive checks—to eval uate evolutionary models encompassing the site-interdependent framework. Through our consideration of different levels of data interpretation (either focusing on amino acid sequences onlv. or focusing on coding nucleotide sequences). we propose the concept of phenornenologicaÏ benchrnarking. as a means of guiding and assessing mechanistic mod eling strategies.
Our applications of these methods ou real data indicates that considering sequence structure compatibility requirements. as doue here, leads to an improved model fit for ail datasets studied. Yet. we find that the use of potentials alone does not suitably ac
count for across-site rate lieterogeneity or amino acid exchange propensities. and more work is needed to establish if richer forms of potentials. or other type of sequence fit ness concepts. might better capture such features. In the meantime, the most favored models combine the use of statistical potentials with a. suitablv rich and well-posed site independent model. We propose several avenues meriting further investigation. leading to a researci expanse with possible impacts on phylogenetic inference. the detection and characterization of selective features. protein structure prediction. protein-protein interactiolls. and computational protein design.
Key words: molecular evolution; phylogeny; protein tertiary structure: statistical
potential; Markov chain Monte Carlo: Bavesian statistics: phenomenological modeling: mechanistic modeling.
Résumé iii
Abstract y
List of Tables x
List of Figures xii
List of Abbreviatioris Xix
Preface XXii
I
Foundations
1
1 Historical background 2
1.1 Introduction 2
1.2 The Darwinian core and the Evolutionary Synthesis 3
1.3 Molecular hiology 8
1.4 Computational evolutionarv biology 15
1.5 Conclusions 1f
2 Probabilistic phylogenetic analysis 19
2.2 Data 22 2.3 Markovian models of sequence evolution and the likelihood function 24
2.4 Bavesian MCMC 31
2.5 Practica.l examples 36
2.6 Evaluating models via phenomenological henchmarking 44
2.7 Conclusions 47
II
Revising Modeling Assumptions
49
3 Site-interdependent phylogenetics 50
3.1 Introduction 50
3.2 Material and methods 53
3.3 Resuits and discussion 62
3.4 Conclusions 66
4 Assessing site interdependent phylogenetic models 67
4.1 Introduction 67
4.2 Material and rnethods 69
4.3 Resuits and discussion 77
4.4 Conclusions 90
5 Devising statistical potentials for phylogenetic analysis 91
5.1 Introduction 91
.5.2 Material and methods 93
5.3 Resuits and discussion 100
.54 Conclusions 104
6.1 6.2 6.3 6.4 • . . . 106 • . . . 107 113 125 127 127 132 140 156 157 • . . . 157 158 • . . . 168 174
III
Perspectives
176
9 Further calculations 9.1 Introduction9.2 Contrasting nearest-neighbor contact maps 9.3 Contrasting different structural representations
9.4 Evaluating transient versus stationarity contributions to model fit 9.5 Conclusions
10 Model variations and extensions 10.1 Introduction
Introduction
IViaterial and methods Resuits and discussion Conclusions
7 Comparing codon models of substitution 7.1 Introduction
7.2 IViaterial and methods 7.3 Resuits and discussion 7.4 Conclusions
$ Evaluating structural models of codon substitution 8.1 Introduction
8.2 Material and methods 8.3 Results and discussion
8.4 Conclusions 177 177 178 182 184 185 186 186
10.2 Dirichiet process modeling 18f 10.3 Multiple protein structures, and interdependence across genes 189 10.4 Coefficients of the potential as free parameters 190
10.5 Conclusions 191
Afterword 192
Bibliography 195
Appendix A: Data sets 209
Appendix B: Partition function formalism 212
Appendix C: Derivatives of the augmented log-likelihood 214
Appendix D: Maximization step for the EM aLgorithm 222
Appendix E: Codon model specifications 224
1.1 The standard or “universaF’ genetic code 15
2.1 Posterior expectations under the GY-F61 model 41
3.1 MCMC settings used here 61
3.2 Posterior mean (alld 95% credibihtv intervals) of B 63
4.1 Naturallogarithrn of the Bayes factor for ail models studied in this chap
ter. with POISSON used as a reference (the hest site-independent models
for each dataset are emphasizediIIitalics. whereas the best overali models
are ernphasized in bold) 78
4.2 Equilibrium values of 3. Mean posterior values (with 95% credibility
intervals) under aU model combinations described in the text 80
6.1 Natural logarithrn of the Bayes factor for modeis cousidered. with PoIs
SON used as a refereilce 124
7.1 Naturai logarithrn of the Bayes factor for models considered. with GY
F1x4 used as a. reference 146
7.2 Amino acid sites under positive selection 155
8.1 Natural logarithm of the Bayes factor for models considered. with MG
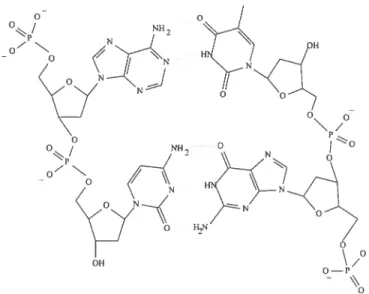
1.1 Double stranded DNA. The left strand. consisting of A (top) and C (bot tom). forms hvdrogen bonds (dotted unes) wit.h an anti-parailel strand. consisting of T (top) and G (bottom). The figure was drawn using Chem TooL availihie online at http://rubv.chemie.uni-freihurg.de/ 9 1.2 Structure of DNA (PDB code 1D66) in “stick” (left) and “spacefilling”
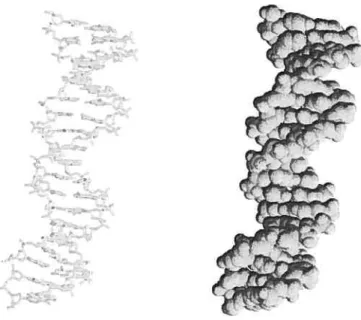
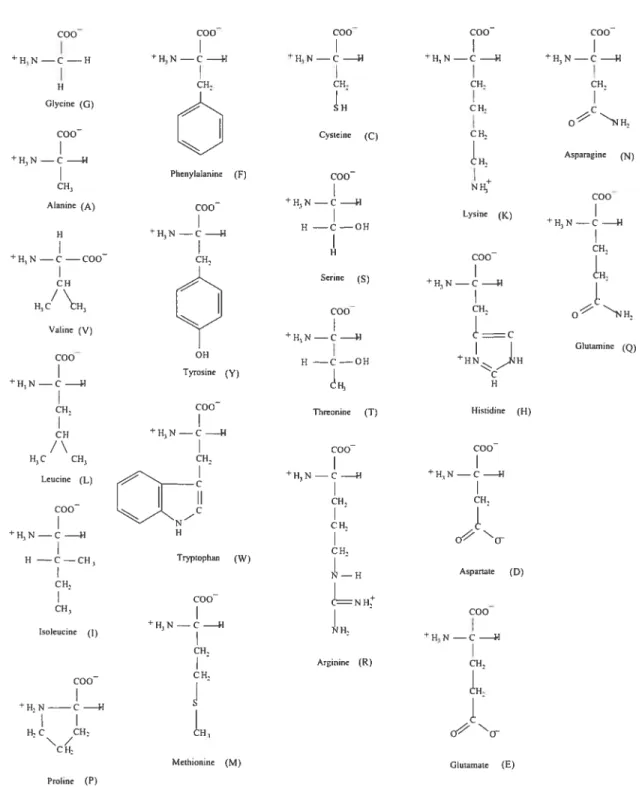
(right) representations. The figures were generated using RasMoL availi hie online at http://www.umass.edu/microbio/rasmol/ 10 1.3 Chemical structure of the twent amino acids (with single letter abbre
viations). drawn using ChernTool 12
1.4 Structure of a three amino acid chain. or tripeptide. Here, R stands for one of the twenty possible side chains, which characterizes each of the 20 arnino acids. The figure was drawn using ChemTool 13 1.5 Structure of -g1ohiu (PDB code 4HHB). in backbone “stick” (left) rep
resentation. a.nd “spacefiuing” (right) representa.tion. The figure was gen
erated using RasMol 13
1.6 The central dogma of molecular biologv. Figure made using Gnuplot.
1.7 Increasing amounts of molecular data. In panel a), the number of base-pairs in GenBank (http //www. ncbi.nlm.nih. gov/Genbank) is displayed over 20 years, spanning 1985—2005. Panel b) shows the number of struc tures in the PDB (http://www.pdb.org/) over the same period. This figure was made using Gnuplot. as were ail other quantitative figures. . 18
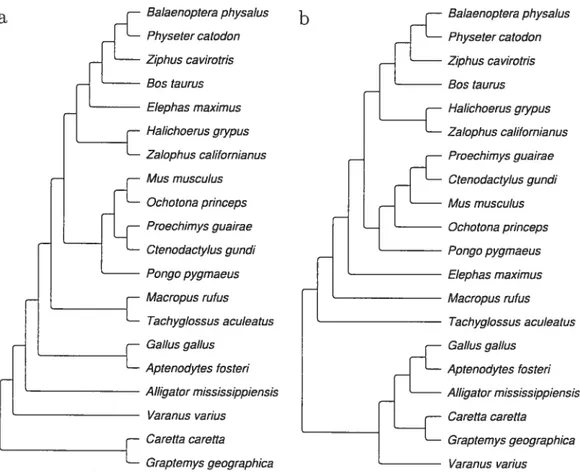
2.1 Tree topologies for Mo2O-153. Panel a) displays the maximum likeli hood topology obtained by PhyIV1L (Guindon and Gascuel, 2003) under the WAG+F model. Panel b) shows a “hand-drawn” topology. which is in doser agreement with accepted groupings. The trees were drawn using TreeGraph. available online at http://www.math.uni-bonn.de/ 28 2.2 Tuning MH updating of rate vector. The figure shows the autocorrelation
function of the rate entropy when sampling rate vectors under WAG+F 39 2.3 Posterior density plot of a. approximated using MH sampling 40 2.4 Posterior distributions of K. and w for the GLoBIN17-1 data set 41 2.5 Posterior 95% credibility intervals of codon stationary probahilities for
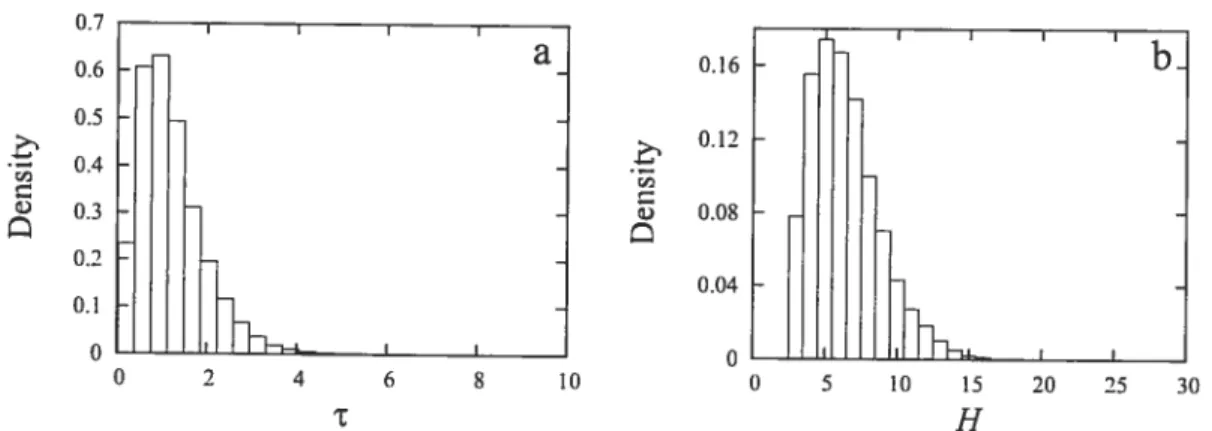
the GLoBIN17-1 data set. sorted according to amino acids 42 2.6 Posterior distributions ofT and H under the GY-f61-DP model. for the
GLoBIN17-1 data set 43
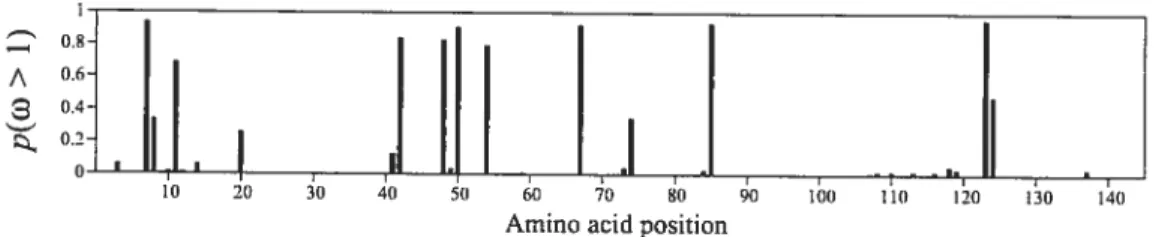
2.7 Posterior probability of each site being under positive selection for the
GLoBIN17-14 data. set 44
3.1 Stabilization of /3 (when combined with JTT+F) in three different MCMC runs for the Mo1O-153dataset. Only the first 2000 cycles (with points
every 50) are shown 62
3.2 Mean values inferred for the ir parameters, as well as the induced amino acid frequencies. and the empirical arnino acid frequencies 64
2F-3
3.3 ComparisonofL =
fl
p(s,jI
forthethreepossibletopoloi=’
gies of the Myo-153 data set 65
4.1 Bi-directional integrations along 3 for JTT+BA$ (a and b) and JTT+F+BA$ (b and cl) performed with ‘fast’ (a and e) and ‘slow’ (b and d) settings using the Myo60-153 dataset. The trace plots illustrate the empirical tuning of the thermodynamic MCMC sampling. which is more challeng ing for the model with greater degrees of freedom (bottom) 74 4.2 Influence of the interval size (I) of the uniform prior distribution for
on the calculated Bayes factor. Here, the models being compared are JTT+F+F+BAS against JTT+F+P, applied to Myo60-153. Two thresholds are marked on the graph. The flrst (leftmost) indicates the point beyond which JTT+F+f+MJ (with prior on [-5, 5]) is favored over JTT+f+F+BAS. The second indicates the point beyond which
JTT+F+F is favored over JTT+F+F+BA$ 83
4.3 Permutation checks randomizing the order of columns in the alignment. The log Bayes factor is estimated between PolssoN+F+F+BA$ and
PolssoN+F+F. for three replicates at each randomization level. A une joining the mean values at each randomization level is drawn as a visual
aid 86
4.4 Posterior density plots of the variance in the number of substitution across sites obtained in predictive mappings and ohserved mappings of our sample from the posterior distribution, under the JTT+f (a), JTT+f+F (b), JTT+F+BA$ (e) and JTT+F+F+BA$ (d) models (us
4.5 Posterior density plot of the Euclidean distance between predictive and ohserved substitution type distributions (sec material and methods). In
a), the models used are PolssoN+F and PolssoN+F+BA$. In b). the
models are JTT+f and JTT+F+BA$ 89
5.1 Stahilization of pairwise energetic coefficients over a gradient descent
optimization 100
5.2 XY-plot of pairwise contact energy parameters obtaiiied from the 2 data
sets 101
5.3 Cross-validation score as a function of the number of solvent. accessihility
classes 102
5.4 Cross-validation score as a function of the number of solvent accessihility classes. with a potential also hased on pairwise contacts 102 6.1 IVlarkov chain Monte Carlo maximum likelihood estimation of the tree
length. In a). b). and c) simulated annealing is used. In d). e) and f) we
use MCG based on a sample of 100 mappings. In g). h). and i) we use MCEIvI, based on 10 (g). 100 (h). and 1000 (i) rnappings. In each panel. a dashed une is drawn for the tree length returned by PAIVIL (Yang. 1997). 114 6.2 IVICEM algorithm for estimating&. The E-step of the algorithm—IVlonte
Carlo estimate of the expectation—is doue with 10 (a). 100 (h) and 1000
(e) draws 117
6.3 I\4onte Carlo estimation of /. In a). the IVICEM is used. with the Monte Carlo estimate of the expectation based on 100 draws. In b). the MCG
is used with 100 draws 119
6.4 Posterior densitv plot of c. approximated using full ME sampling (his togram) and a normal approximation (dashed hue) 120
6.5 Posterior density plot of
fi.
In panel a) a histogram was generated using a full MH sampling. Panel h) shows a density trace generated usingthermodynamic integration. as presented in chapter 4. In both panels.
the normal approximation is shown (dashed une) 122
7.1 Log-likelihood differences recorded during GY-MG-switch thermodynamic integrations Iinking GY-Fi x 4 and MG-Fi x 4. Two integrations are plot ted in each panel. one with /3 going from O to 1 (+), and another with
fi
going from 1 to O (x). The collection of K+ 1 values is used to approxirnate the log Bayes factor according to (2.21). Panel a) displays “fast” funs. with K = 100. panel b) displays “medium” runs. K = 1, 000, and
panel c) displays “slow” runs. with K = 10. 000 141
7.2 Log-likelihood differences recorded during Fi x4-F61-switch therrnody namic integrations linking GY-F1 x4 and GY-F61. Two integrations are plotted in each panel. one with
fi
going from O to 1 (+), and another with 3 going from 1 to Ot
x). The collection of K + 1 values is used toapproxirnate the log Baves factor according to (2.21). Panel a) displavs “fast” runs. with K 100, panel b) displavs “medium” runs. K = 1, 000.
and panel c) displays “slow” runs. with K = 10, 000 143
7.3 95% credibilitv intervals of global nucleotide propensity parameters oh tained under IV1G-F1x4-DP (full lines) and under IVIG-F1x4-CP-DP (dashed hues). The top panel (a) refers to the GL0BINJ7-144 data set,
followed by LYsIN25-13 (b).and H1v22-99 (c) 149
7.4 95% credibility intervals of position-specific nucleotide propensitv param eters obtained under MG-F3 x 4-DP (full unes) and under MG-f3 x 4-CP-DP (dashed hues). The three panels ta. b, c) refer to the GLo3Ix17-1
7.5 A composite from figures 7.3 and 7.4 for the GLoBIN17-1 data set. Panel a displays the 95% credibility intervals of global nucleotide propen sity parameters under the MG-Fi x4-DP model (full line) as well as the 95% credibility of the three nucleotide propensitv parameters under the MG-F3x4-DP (with progressivelv finely-dashed lines for position L 2. and 3 respectively). Panel b displays the 95% credibility interval for same parameters but now. ililder the I\’IG-F1x4-CP-DP and
MG-F3x4-CP-DP models i5i
7.6 95% credihility intervals of codon preference parameters. sorted accord ing to amino acids. The full hues are values under MG-Fix4-CP-DP. whereas the dashed hues are values under MG-F3x4-CP-DP. The left
most panel ta) refers to the GL0BINJ7-L4.4 data set, followedby
LYsIN25-13.. (b).and Hiv2-99 (c) 153
7.7 Posterior prohability of each site having p(w > i) under MG-Fi x4-DP (full hues), and MG-Fix4-CP-DP (dashed hues). The top panel ta) refers to the GLoBIN17-1 data set. followed by LysIN5-13 (h). and
Hiv22-99 (c) 154
8.1 Quasi-static thermodynamic integration along for the MG-F1x4-SC
model 167
8.2 Posterior distribution of 8 for MG-Fi x4-SC+8 (a). MG-Fi x4-DP-SC+8 (b). IVIG-Fi x4-CP-SC+,3 (e). and I\’iG-Fi x4-CP-DP-SC+3 models 169
8.3 Posterior (full une) and posterior predictive (dashed une) variance in the number of nonsynonymous substitutions across the codon positions of the alignment. Panel a) corresponds to the MG-Fi x4-CP model, whereas panel b) also includes the DP settings to this model as well. Panel c) corresponds to the MG-fix4-CP-SC+/3. and panel d) includes the DP
settings as wefl 171
8.4 Mean amino acid exchange distributions. Panel a) corresponds to that obtained from the observed rnappings under the MG-Fi x4-CP-DP model. whereas panel b) corresponds to that ohtained from the predictive rnap pings. under the sanie modeL Panel e) is obtained from the observed mappings under the MG-F1x4-CP-DP-SC+d model. and panel d) is
AAP: Amino acid preference: BAS: Bastolla:
CP: Codoil preference;
CPU: Central processing unit; DA: Data augmentation; DNA: Deoxyribonllcleic acid;
DP: Dirichiet process (on nonsynonymous rate factors): Elvi: Expectation maximizatioll;
GHz: Giga Hertz:
GTR: General time reversible; GY: Goidman and Yang;
JTT: Jolles. Taylor, and Thornton; MCG: I\4oute Carlo gradient;
IVICEIVI: Monte Carlo expectation maximization: MCMC: Markov cliain Monte Carlo;
MG: Muse and Gaut: MH: Metropolis Hastings; MJ: Miyazawa. and Jernigan; ML: Maximum likelihood; PD3: Protein data ballk;
PX: Parameter expansion; RNA: Ribonucleic acid; $C: $tucturally constrained; WAG: Whelan and Goidman.
In the fail of 2003, I had the good fortune of beginning studies in the bioinformatics programme at the Université de IViontréaL joining a vibrant research group led by Hervé Philippe. Well aware of the potential of computational rnethods for studying the growing banks of biological data. the group’s research activities could be categorized along two main axes: first, the use of mathematical models of molecular evolution for inferring the relatedness of species, or phyÏogenies; and second, the development of new evolutionary models. which. on the one hand, exhibit robustness in phylogenetic analysis per se, and. on the other hand, elucidate patterns of the underlying substitution process. With then post-doctoral fellow Nicolas Lartillot. several projects along these unes were initiated. of which I had the chance to participate.
The present work is my recapitulation of research endeavors along one of these projects. which has been the focus of my doctoral studies. Tue work could be summa rized as an exploration of computational methods for implementing richer descriptions of molecular evolution, with the specific objective of incorporating explicit protein struc ture considerations within different models of sequence evolution.
The dissertation is organized in three parts. The first briefty overviews the historical settings for the recent emergence of the field. and presents the core methodological framework adopted throughout the text. The second part applies the framework to revising modeling assumptions at different levels of interpretation. The bulk of this second part has been the subject of puhlished or forthcoming articles. These are the
following:
Rodrigue, N., Lartillot, N., Bryallt, D., and Philippe, H. (2005). Site in terdependence attributed to tertiary structure in amino acid sequence evo lution. Gene, 347:207-217.
Rodrigue, N., Phulippe, H., and Lartillot, N. (2006). Assessing site interdependent phylogenetic models of sequence evolution. Molecular Bi ology and Evolution. 23:1762-1775.
Kleinman, C. L., Rodrigue, N., Bonnard, C., Phulippe, H., and Lartillot, N. (2006). A maximum likelihood framework for protein design. BIVIC Bioinformatics, 7:326.
Rodrigue, N., Phulippe, H. and Lartillot, N. (2007). Exploring fast com putational strategies for probabilistic phylogenetic analysis. Systematic Bi ology, 56:711-726.
Rodrigue, N., Phulippe, H. and Lartillot, N. (in press). Uniformization
for sampling realizations of IVlarkov processes: Applications to Bayesian im plementations of codon substitution models. Bioinformatics.
Rodrigue, N., Lartillot, N., and Phulippe. H. (submitted). Mechanistic modeling of amino acid or codon preferences for protein-coding nucleotide sequence evolution. Suhmitted to Genetics.
Rodrigue, N., Phulippe, H., and Lartillot. N. (in preparation). Sampling methods for computing Bayes factors across site interdependent codon sub stitution models. Planned for Journal of Computational Biology.
The presentation does not, however, follow the “dissertation by articles” format, where
a set of articles would be included untouched. Rather, I have tried to re-work the
material into a more unified whole. This lias considerably reduced the length of the document. while allowing for a homogenization of the mathematical notation, and a
clearer emphasis on the main themes of the thesis. Portions oftext, figures, and tables from published articles appear with permission from the respective journals, as well as ah co-authors. finahly, the third part of the dissertation describes specific calculations
of interest for future work. as well as several modeling extensions and variations meriting further exploration.
The work was very muci a collaborative project. with 1-lervé Philippe and Nicolas Lartillot contributing much of the theoretical ideas throughout. The work was formally dodllmented by myseif, including fine details of methods and implementations, as well as initiais drafts of manuscripts. which were then collaborativelv revised and improved. This is with the exception of chapter 5. which is modified from the work of the third article listed above. The article in question was primarily written hy Claudia Kleinma.n and Nicolas Lartillot, and therefore, for the purpose of this dissertation. I have signifi cantly abbreviated the material, inclilding only that which is directly pertinent to the main developments of this work. Much of the future work discussed in the final part is also a resultant from the collaboration with Claudia, Hervé, and Nicolas.
Following this preface. I have opted to retain the first-person plural throughout the text. as this hest refiects the collaborative effort of ail those involved (although an errors that may be contained are of mv owu doing). I use footnotes to clarif the meaning of jargon, or to include non-essential information that mav nevertheless be of relevance to the reader. Appendices are used for descriptions of data sets, for lengthy mathematical developments. and to outline the use of a computer package implementing the methods developed in the main body of the document.
I am very grateful for the financial support and encouragement of many organiza tions. The first three vears ofmv studentship were funded bv Génome Québec. The hiT hursaries and fellowships for excellence (a Canadian Institute of Health Research strate gic training program grant. in bioinformatics) provided supplementary funding in 2005. and provided the main fianding for my final year. The Faculté des études supérieures provided supplementary funding for attending conferences and meetings: the activities of the Robert Cedergren Center also provided additional funding opportunities: and the
60ème commission franco-québécoise funded trips to IVlontpeilier. to work with Nicolas. I owe immense tlianks to Hervé Philippe for the immerous opportunities lie provided throughout my studentship. Hervé’s passion for science is invigorating, and lis drive contagious. Fie lias tactfuliy given me botli positive encouragement and constructive criticism out of a sincere desire to stimulate better scientific work. 11e lias heen a key contrihutor to scientific orientations. and dhoice of experiments. and plaved an active role in the writing of scientific tex-ts. Ne lias aiso arranged for me to present at numerous scientific meetings. for which lie patiently lielped me prepare. Ail the whule. Hervé is neyer but a moment awav from the next laugli. going about with a bon-vivant entliusiasm. 11e lias also shown to be incredihly understanding with regards to my personai affairs, for whici I owe him my deepest gratitude. IVierci Hervé.
I also owe immense tlianks to Nicolas Lartillot, witliout wliom I could not have done this work. Nicolas is a true polvmatli. 11e is also a very patient and strategic teacher. Aitliough hareiy mv senior. le lias been a tremendous source of ideas. techniques. and hands-on help and guidance with computer programs as weli as tlie analyses tliemselves. Nicolas was also a kev contributor in tlie preparation of scientific t.exts. and carefully read ail of my teclinical communications. He also responded to my countÏess emails witli detaiied ideas and explanations. Beyond tliese teaciings. Nicolas lias also stimulated my interest in statistical tlieory and pliilosophy of knowledge, ail ofwliich lie did witli good-natured camaraderie, and kind liospitality during my stays at IVlontpeflier. Merci Nico.
I tliank the thesis jury members. as well ail mv teacliers. colleagues and ciass mates. wlio have iistened to my presentations. re-read parts (or all) of the work. or otlierwise positiveiy contributed to my studentship: David Brvant. Ciaudia Kieinman. Henner Brinkmann, Béatrice Roure, Fabrice Baro. Yan Zhou. Olivier Jeffroy. Frédéric Deisuc, Denis Baurain, Naiara Rodriguez-Ezpeieta. Cécile Bonnard. Wafae El Alaoui.
Guy Larochelle, Gertraud Burger. Marie Robichaud, Elaine Meunier, Mildés Cstirs, François-Joseph Lapointe. Pascale Legault. $abin Lessard, franz Lang. françois Major, and Jeif Thorne. I’m also grateful to John Huelsenbeck, Asger Hobolth, Paul Lewis. Rod Page and ail anonymous reviewers for their communications regarding parts of the work presented here.
I would not have completed tins dissertation without the support of my loving spouse Rachel Gouin. whose enduring encouragement I have cherished for years. To boot, Rachel also helped me proof-read the entire dissertation. I thank my sweet daugh ter Kaya Gouin for lier encouragement as well, and for lier gifts adorning rny work desk. Manv thanks to mv parents-in-law. Pierretteand Jacques Gouin. for their support, and for caring for Kava on numeros occasions. I also thank my brother François Rodrigue and sister-m-law Ivana. Kostic for their love and encouragement. finally. I thank my dear parents Laurence Drouin and André Rodrigue, for whom I cannot suitably express iny gratitude, and to whom, rather, I dedicate this dissertation.
Historical background
If, during the long course of ages and under varying conditions of life, organic beings vary at ail in the several parts of their organization, and I think this cannot be disputed; if there be, owing to the high geometric powers of increase of each species. at some age. season, or year, a severe struggie for life, and this certainly cannot be disputed; then, cousidering the infinite cornplexity of the relations of ail organic beings to each other and to their conditions of existence, causing an infinite diversitv in structure, constitution. and habits. to be advantageous to them, I think it would be a most extraordinary fact if no variations useful to any organic being do occur. assuredly individuals thus characterized wili have the best chance of being preserved in the struggle for life: and from the strong principle of inheritance they will tend to produce offspring sirnilariv characterized. This principle of preservation, I have called, for the sake of brevity. Maturai Selection.
—CHARLES DARWIN. Origin, p. 127
1.1
Introduction
The objective of evolutionarv biologv is to propose a mechanistic and historical expia-nation for the intricate attributes and similarities of different living things. The core of this explanation is commoniy associated with Charles Darwin (1809—1882). and bis
famous book On The Origin of Species by Means of Naturat Setection, or the Preser vation of Favonred Races in the Struggie for Lfe. commonly contracted to the simple titie Origin (Darwin, 1859). Beyond its pureiy biological implications. Darwin’s main
message. summarized in the opening citation, bas had a profound impact on conceptu ahzations of self, and of mmd, stimulating an ongoing revolution of the general world view. In contrast with the Copernican revolution, which had not attracted wide-spread interest until the scientific details had been resolved, the Darwinian revolution was en gaged with important pieces of the theory stilimissing. and altogether devoid of precise mathematical characterization.
In this first chapter, we outiine the main historical and phulosophical developments contributing to evolutionary thought, beginning with a brief overview leading to the Darwinian. coTe. and the Evotutionary Syrithesis that subsequentlv emerged among biologists in the 1930s and 1940s. We next introduce early discoveries in molecular biology. and set forth the modem enterprise of computational evohitionary biology. The literature on the rise of evolutionary thought is vast. For accessible and engaging accounts of the movement. see Burrow (1966), Oldrovd (1980), or Dennett (1995). The present ovemview merely sketches in contour the main tumning points leading to the subject of this thesis. and provides a schematic description of phenomena to be ma.thematicallv modeled in later chapters.
1.2
The Darwinian core and the Evolutionary
$yn
thesis
The basic concept of biological evolution can be traced back to the pre-Socratic Greeks. Anaximander (610—546 BC) is thought to be one of the eamhest proponents of evolution ary thinking. proposing the first speculations to an aquatic origin of life. However, the
fixist’ influence of Plato (428/427—348/347 BC) and Aristotie (384—322 BC) bas dom inated most occidental cultures. Judeo-Christian cultures in particular have vehiculed
the fixist perspective. andonly after the Enlightenment would truly transJormist’ views take firm rooting in wider discourses. Nonetheless, tire concept of species retatedness was pervasive in some form or another throughout history, which had allowed organ isms to be classified into formai groups. The most influential figure in developing such a classification was Carolus Linnaeus (1707—1778). Yet even Linnaeus did not offer a causative explanation for the relatedness of organisms. subscribing to the prevaiÏing fixist view.
The work of Jean-Baptiste Lamarck (1744—1829) was a noteworthv turning point. Lamarck’s transformist theorv proposed that organisms are sornehow intrinsicaliv driven toward complexification—the giraffe stretching and strengthening its neck to attain higher ieaves—and that traits acquired by individuals are passed on in the next generation— having put such efforts into stretching and strengthening its neck, the giraffe’s offspring. so goes tire theory, have longer and stronger necks. Lamarcks proposai was viewed with skepticism. Although Darwin himself accepted the possibilitv that acquired traits might be passed on. ire considered the appeai to tire “drive” of organisms of weak explanatorv power. Uitimateiv. Lamarckian transformists received their fluai biow from the work of August Weisnamm (1833—1914), who observed the distinction between germ une and soma, and generally exciuding the possibihty of somatically derived characteristics 5e-ing passed on to offspr5e-ing. Nonetheless. the ideas set forth by Lamarck were important in inspiring truiy transformist theories.
The field of geology was also a hurgeoning science in the 19th century. In particular. the principle of uniformitarianism2 was expounded 5v Charles Lvell (1797—1875). who. based on observations of erosion rates. determined the Earth to be at least millions of years old. These observations were influential in setting a new time-frame for interpret ing the diversity of organisms, and Darwin is said to have hrought Lyell’s then recently
‘A transJoTmistacknowledges that organismal forms are subject to transformation over generations.
2The principle of unijormitarianism states that basic forces acting in the geological past are the
published Princip tes of GeoÏogy on lis five year voyage around the globe.
Another key contribution came many years earlier from political economics. witli the work of Thomas Malthus (1766—1834). In lis Essay on the Principle of Population (Malthus, 1798), Maltlius pointed out tliat exponential population growth—displayed under plentifiil conditions of existence—must eventually be kept in check, uftimately by the limited resources of a finite world. Maithus’ examples were anthropomorphic, but nonetheless lad a profound impact on Darwin. helping him crystallize the concept of natural selection:
In October 1838, that is, fifteen months after I had begunmy systematic inquiry,
I happened to read for amusement Maithus on Population, and being well pre pared to appreciate the struggie for existence which everywhere goes on from long continued observation of the habits of animais and plants, it at once struck me that under these circumstances favorable variations wouid tend to 5e preserved, and unfavorable ones to be destroyed. The results of this would be the formation of a new species. Here, then I had at last got a theory by which to work. (From Dar win’s autobiography, retrieved onhne at http://onlinebooks.library.upenn.edu/.) Darwin was well aware of the epistemological implications of lis theory. whidli di verged markedly witli the main stream theological. social and political agendas of lis
day. For years lie remained reluctant to openly conie forward with lis ideas, until lie received a letter from another naturalist, Alfred R. Wallace (1823—1913), expounding the basic elements of the theory. Wallace later recounted low lie formed the theory:
Something led me to think of the positive checks described by Malthus in his essay on population. These checks—war. disease, famine, and the like—must act on animais as well as on mari. While pondering vaguely on this fact there suddenly flashed upon me the idea of the survival of the fittest—that the in dividuals removed by these checks must 5e on the whole inferior to those that survived. (From AtJred Russet Wattace: Letters and Reminiscences. retrieved onhne at http://manybooks.net/)
Upon reading Wallace’s first correspondence on tle theory. Darwin wrote: I neyer saw a more striking coincidence. If Wallace had my M.S. sketch written out in 1842 he could not have made a Setter short abstract! Even his terms now stand as Heads of my chapters (Darwin, 1858. in a letter to Charles Lyell. from The
Wallace had been influenced by the same body of work as Darwin. and their inde pendent convergence on the concept of natural selection testifies to it being a mature free-fioating rational at the time. ripe for articulation and serious consideration. Indeed. the main ideas of Darwin and Wallace had already been presented in outiine, in 1813 by William Charles Wells (1757—1817). and again (independently) in 1831 by Patrick Mathew (1790—1874). Despite the anticipations of Wells and IVlathew, and the conver gence of Darwin and VTa11ace. the theory has historically been attributed to Darwin. mainly due to the breadth of his treatise.
The basic elements of the theory, which we refer to here as the Darwinian coTe, can be broken down into the following argument (modifled from Gould. 2002. p. 125):
• Super-fecundity: Orgauisms tend to produce more offspring than can survive. • Variation: Organismal forms tend to vary, so that each individual bears distin
guishing features.
• Heredity: An organism’s offspring tend to be characterized similarly to it. • Natural selection: Organismal forms endowed with variations well-suited to the
conditions of existence will tend to be more successful in producing offspring than ill-suited variations: well-suited variations thus come to dominate the population. Despite debates among theoreticians from the early_20tu1 century onward, this basic ar gument is not put into question. In the modem literature, the Darwinian core argument is often taken for granted. for instance. appearing oily in footnote in Gou1ds big book
The Structure of Evotutionary Theory (2002).
When the theory was first proposed. however. several outstanding questions re mained. By far the most important of tiiese was the question of inheritance: how are organismal attributes transmitted to offspring? In 1865. six years afrer Darwins On gin. Gregor Mendel (1822—1884) pubïished a work demonstrating the existence of discrete
heritable determinants. now called genes. which can be passed on largely unchanged over generations. Unfortunatel. Mendef s work went unnoticed. and debates regard ing the basic workings of inheritance continued until 1900. when Mendel’s work was rediscovered.
The discovery of IViendelian inheritance had the surprising (in hindsight) effect of increasing skepticism for the Darwinian core. In particular. the rn’utationist sciool, lead by Hugo de Vries (1848—1935), William Bateson (186 1—1926) and others. considered that most of the variation in organismal forms could be explained as arising by mutation. without needing to invoke the principle of natural selection. This view was vehiculed by the leading geneticists of the early 20th century, and eventuafly lead to the opinion that the Darwinian core had been refuted:
IVlodern critics have often asked themselveshow it is that a hvpothesis like Dar win’s, based on such weak foundations, could ail at once win over to its side the greater part of conternporarv scientific opinion. If the defenders of the theory refer with tins end in view to its intrinsic value. it may be answered that the theory has long ago been rejected in its most vital points bv subsequent resea.rch (NordenskioÏd, 1928, p. 177).
Over the years 1918 to 1931, biometric analysis synthesized the seemingly disparate concepts of mutationists and selectionists. In another case of largely convergent theoriz ing, Ronald A. f isher (1890—1962). John B. S. Haldane (1892—1964), Sewali G. Wright (1889—1988) and Sergei. S. Chetverikov (1880—1959) proposed mathematical moUds in tegrating Mendehan inheritance. mutation, and other biometrical knowledge. with the Darwinian core. Their work was soon corrohorated aid expanded by biologists at the time. in particular Theodosius Dobzhanskv (1900—1975). Ernst W. Mayr (1904—2005), Julian S. Huxley (1887—1975) and George G. Simpson (1902—1984). With this firm theoretical foundation. and empiricai substantiations. a general consensus about the workings of biological evolution emerged, which came to be kriown as The Eeotutionary
The basic elements of the synthesis are well described in modem terms by Futuyma (1986):
The major tenets of the evolutionary synthesis, then, were that populations con-tain genetic variation that arises by random (i.e. not adaptively directed) mu tation and recombination; that populations evolve by changes in gene frequency brought about by random genetic drift. gene fiow, and especially natural selection; that rnost adaptive genetic variants have individualiy slight phenotypic effects 50
that phenotypic changes are graduai (although sorne alleles with discrete effects
may be advantageous, as in certain color polyrnorphisms); that diversification
cornes about by speciation, which norrnaliy entails the graduai evolution of re productive isolation arnong populations; and that these processes, continued for sufficiently long, give risc to changes of such great magnitude as to warrant the designation of higher taxonomic levels (genera, farnilies, and so forth). (p. 12)
As these tenets gained broader acceptance. another revolution was under way with the rise of molecular biology. which would introduce a new kind of data, lending itself to a
new level of mathematical analysis.
1.3
Molecular biology
In 1869, Friedrich Miescher (1844—1895) isolated a phosphate-midi chemical he called “nuclein”, since it was found in tic nuclei of whule blood ceils. Tic chemical was later isolated from many otier ccli types. and was renarned n’ucteic acid. Tic biological function of nucleic acids rernained elusive, however, for rnany years. In 1944. after over ten years of experimental study, Oswald Avery and colleagues (Avery et al., 1944) gave tic first due that nucleic acids are responsihie for tic transmission of genetic information. In tic ensuing years. their resuits were expanded. in particular by Hershey and Chase (1952). who demonstrated that deoxyribonucleic acid (DNA) alone is tic hereditary material.
In tic late 1940s and 1950s, tic structure of nucleic acids was worked out in de tau: witi few exceptions, nucleic acids are polymers of nucteotides; eaci nucleotide is constituted of a nitrogenous base (of whici there are four types in DNA), a pentose
sugar (deoxyribose), and a phosphate group. The sugar and phosphate group form the pliosphate-deoxyribose backbone linking nucleotides into a strand. In addition. the ni trogenous bases adenine (A) and thymine (T). as well as guanine (G) and cytosine (C), were found in the same proportions in DNA isolates, a property now called Ghargaff ‘s mie in honor of its discoverer Erwin Chargaif (1905—2002). This property is explained by the structural pairing of bases, which in turn relates to the overall structure of the DNA molecule: the bases A and T, as well as G and C, are said to be complemen tary. interacting through hydrogen bonds’; complementary anti-parallel single strands of nucleotide polymers interact through such bonds, playing a central role in the forma tion of double stranded DNA. The chemical arrangement of the components of DNA are displayed in figure 1.12. The chemical structure of DNA was found to induce a
‘Many exceptions to such pairings have since been established.
2The sirnilar ribonucleic acid (RNA), which differs from DNA only through the oxidized ribose
sugar, follows the same arrangement. Also. the enzymes involved in RNA synthesis have a much higher affinity for a variant of thymine that lacks a methvl group, called uracil (U). As such, in RNA, T is replace by U, which nonetheless forms hydrogen bonds with A.
oPî
0
Figure 1.1. Double stranded DNA. The left strand. consisting of A (top) and C (bot tom), forms hydrogen bonds (dotted lines) with an anti-paraUel strand. consisting of
T (top) and G (bottom). The figure was drawn using ChemTool, availible online at http: //ruby. chemie.uni-freiburg. de/.
coiling pattern in the double strand, in a manner exposing the hydrophilic backbone. while burying and piling the hydrophobic nitrogenous bases into a central core. The now-famous doublehelica1 three-dimensional structllre of DNA. as first described by Watson and Crick (1953), is displayed in figure 1.2.
(
-Figure 1.2. Structure of DNA (PDB code 1D66) in ‘stick” (left) and “spacefiuing” (right) representations. The figures were generated using RasIViol. availible online at http://www.umass.edu/microbio/rasmol/.
For cells to proliferate. DNA must be replicated. and it is mainly in this replication process that terrors are made; enzymes and regulatory factors involved in DNA repli-cation ma occasionally lead to slight differences in sequences, referred to as mutations. Other factors may also lead to differences in seqilences. such as recombination (e.g.. chromosomal crossover), or even non-replicative changes (e.g.. cytosine deamination), and altogether these different factors indiace genetic variability.
Before the sweeping advances of the 1940’s and 50’s. it was thought that DNA was too simple to be able to specify the complex features of organisrns. Proteins.
however. in their enormous varieties. seemed more likelv candidates as the carriers of genetic information. Proteins are chains of amino acids. of which there are 20 types in most orgaiisms. An amino acid consists of a carboxvlate and an amino group. each attached to a central carbon referred to as the -carbon. The a-carbon’s tetra-valence is completed by a. hydrogen and one of 20 organic substituents. or side chains. The full chemical structure of the twenty amino acids is displayed in figure 1.3.
A condensation reaction between the carboxyl group of one amino acid auJ the amino group of another forms a peptide bond between the two. The chemical structure of the three amino acid chain. or tripeptide’. is displayed iII figure 1.4. The sequence of an amino acid chain is referred to as its primary structure. The secondary structure refers to the manner in which a chain cous (e.g.. c-helices) or folds over to form lat eral interactions with itself (e.g.. B-sheets). whereas the tertiary structure refers to its overali three-dimensional configuration (figure 1.5), formed through networks of inter action between amino acids. f inally. the quaternary structure refers to the muhimeric assemblage of different prot.ein subunits.
At the time of the publication by Watson auJ Crick (1953), the relation between the sequence of amino acid chains and DNA was not known. In the subsequent years, a fiurry of research in molecular biology produced the modem consensus referred to as the centrai dogma of information ftow in the cell (figure 1.6). Through the concerted action of several enzymes and regulatory factors, double stranded DNA rnomentary “unzips” (hydrogen bonds between A and T. as well as C and G. are disrupted). and one of the strands serves as a template for the transcription of a ‘messenger” RNA. or simply mRNA. with a sequence of ribo-nucleotides of matching base complementarity: by convention. a gene’s nucleotide sequence corresponds to that of the mRNA. such that the opposing DNA strand actuaflv serves as the template. Tlie mRNA itself is
‘Referring to a three arninoacid chain as a tripeptide is a misnorner, because such a chain involves only two peptide bonds.
coo_ COO_ cOo_ COO_ coo_ HN—C—H H3N—C—-41 “H3N—C--—H ‘HN—C——41 1-l CH. CH, CH, CH, Glycine (G) H H. O Cysteine (C) CH Asparagine (N) ±H N C —41 Phenylalanine (F) C00 CH3 NF] COO Alanine (A) COO H3 N
I H—C—OH Lysine (K) +H3 N C —H
H H3N—C—-4
I H - CH,
H3N—C—COO CII, COO
CH Serine (S) H3N— H. H3 C O / \H, H3 N — CH. Valtne (V) C00 OH ±
I
Tyrosine (Y) j4H Gluramine (Q) H—C—OH HN H,N—C—-H H CH, COO Threonine (T) Histidine (H) CH H5N—C—--H / \ COO COO HC Cl-l, CH, I Lnucinr (L) H,N—C41 HN—C—41 CH, CH, COO CH, *H3 N—C H - N O I CH, H —C—CH Tryptophan (W) Aspailale (O) I N—H CH, I LNH CH3 - COO H3N—C--—H NH, Isoleucine (1) -+H3 N—C —H CH. I Arginine (R) CH, CH, cH_ COO H,N—C——4l C CH3 CH5 C HMethioninr (M) Glutamate (E) Praline (P)
Figure 1.3. Chernical structure of the tweut arnillo acids (with siugle letter ahbrevi ations). drawn using ChernTool.
}N NNCOO
Figure 1.4. Structure of a three amino acid chain, or tripeptide. Here. R stands for one of the twenty possible side chains, which characterizes each of the 20 amino acids. The figure was drawn using ChemTool.
\
-Figure 1.5. Structure of /3-globin (PDB code 4HHB), in backbone “stick” (left) rep resentation. and “spaceffiling” (right) representation. The figure was generated using RasMol.
a transient macromolecule, which, following some post-transcriptional modifications, interacts with a molecular machinery for translation of its sequence into an amino acid sequence. Each nucleotide triplet along the rnRNA codes for a specific amino acid: since there are 64 possible triplets, or codons. and 20 amino acids. the code is degenerate (table 1.1). The ma.tching of codon to amino acid is accomplislied via adapter RNA molecules called “transfer” RNA. or simply tRNA. A tRNA molecule lias three key features: 1) it binds a pa.rticular amino acid 2) ft lias an affinity for a specific codon. via a complementarv nucleotide triplet, or
anticodon
and 3) it hinds to the ribosome. which coordinates the overall process of translation. The ribosome is the multi-unitStrand ofDNA
...ACTCCTGAG...
Transcription to mRNA • ..ACUC CUGAG...
Translation to polypeptiderj
i
Figure 1.6. The ceitraI dogma of molecular biology. Figure made using Gnuplot. availible online at http:
/ /
grniplot.info/.macromolecular scaffold (mainlv constituted of RNA) over which the mRNA is passed. one nucleotide triplet at a time. with the complementary anticodon of the appropriat.e tRNA bindi;ig to each successive codon. enabling the formation of peptide bonds in the sequence order originally specified by the DNA. The amino acid chain folds into a particular three-dimensional configuration, and takes on some operational role in the cell’.
A mapping from DNA sequence to amino acid sequence was thus made possible in the early second half of the 2001 century. and many researchers eventuafly turned to the much more daunting problem of producing a mapping from amino acM sequence to tertiary structure and to protein function. This. as we shah see. constitutes one of the central endeavors of modem molecular biologv.
‘0f course. exceptions to the central dogma abound (e.g.. reverse-transcriptase), and the role of RNA in the celi goes well beyond what is described here, as much recent research has shown.
Table 1.1. The standard or “universal” genetic code
TTT, Plie, f TCT, Ser, S TAT, Tyr. Y TGT, Cys, C
TTC, Plie. F TCC, Ser, $ TAC. Tyr. Y TGC, Cys. C TTA. Leu, L TCA, Ser, $ TAA, stop TGA, stop TTG, Leu, L TCG, Ser, S TAG, stop TGG, Trp, W
CTT, Leu, L CCT, Pro, P CAT, Ris, H CGT, Arg, R CTC, Leu, L CCC, Pro, P CAC, Ris, H CGC, Arg. R CTA, Leu, L CCA, Pro, P CAA, Glu,
Q
CGA, Arg. R CTG, Leu, L CCG, Pro, P CAG, Gin,Q
CGG, Arg. RATT, 11e, I ACT, Thr, T AAT, Asn, N AGT, Ser, S ATC, 11e, I ACC, Thr. T AAC, Asn. N AGC, Ser, S ATA, 11e, I ACA, Thr, T AAA, Lys, K AGA, Arg, R ATG, Met, M ACG, Thr, T AAG, Lys, K AGG, Arg, R
GTT, Val, V GCT, Ala. A GAT, Asp, D GGT. Gly, G GTC. Val, V GCC, Ala, A GAC, Asp. D GGC. Gly. G GTA, Val, V GCA, Ala, A GAA, Glu, E GGA, Gly. G GTG, Val, V GCG, Ala, A GAG, Glu, E GGG, Gly, G
Note.—Each codon is followed by the three letter and single letter abbreviations of the amino acids they encode. Stop codons correspond to a termination of the translation process.
1.4
Computational evolutionary biology
In the early 1960s. the idea tliat homologous1 bio-molecules (DNA or amino acid se quences), sampled from different species, could be analyzed to infer their evolutionary history was gaining ground (e.g., Zuckerkandl and Pauling. 1962. 1965). This idea. cou-pied with the rise of information technologies enabling the automation of such analyses. eventuaiiy iead to the modem field of computational evolutionary bio1ogy Indeed. before the advent of molecular data, evolutionary analyses were typicallv based on
‘Inevolutionarvbiology, the terrnhomologousrefers to similarities between given features that are
morphological featiires. subjectively defined into characters, and taking on subjectively defined states. Molecular sequences. on the other hand. lend themselves to a natural discretization: characters are deflned as nucleotide, amino acid, or codon sites along the sequence, with each site taking on one of 4. 20, or 61 (exciuding stop codons) states respectively. To the mathematically inclined biologist, such data raised numerous ques tions that could be addressed through direct calculation.
One such hiologist was IVlotoo Kimura (1924—1994). With a strong background in
population genetics, Kimura stayed in tune with the developments of moledular biology. caldulating the implications of the new data coming out from the field. In 1968. Kimura published calculations claiming that the rate of molecular evolution is much higher tl;an expected under the assumed strength of selection (Kimura. 1968). His conclusion was that many residue changes must be selectively neutral. This idea, later known as the n entrai theory of motecutar evotution. would form the hallmark of much of the rest of
his career.
Plainly stated, the neutral theory asserts that many different versions of a molecule are selectively equivalent in a population. In other words, selection is indifferent to these different versions. since each, for whatever reason, performs its biological role equivalently. This idea was not novel. Darwin himself had stated: variations neither useful nor injurious would not 5e affected by natural selection [...]“ (Origin. p. 108).
Nonetheless, the neutral theory sparked intense debate regarding the relative impor tance of neutral drift versus selection. To onlookers. the debate was unfortunately viewed as casting doubt on the validitv of natural selection. which was of course not the case. In his later book, Kimura attempts to clarify:
The neutral theory is not antagonistic to the cherishedviewthat evolution of form
and function is guided by Darwinian selection, but it brings out another facet of the evolutionary process by ernphasizing the much greater role of mutation pressure and random drift at the molecular level (Kimura, 1983. p. ix).
\iVith some toning down. namelv liv striking “much greater”. this statement would likely be endorsed by most of todavs molecular evolutionists.
Another prominent figure in the ea.rly years of computational evolutionary biology is Margaret O. Dayhoif (1925—1983). Besides lier interests in cataloging and organizing molecular data, she and lier co-workers proposed the first empirical model of amino acid sequence evolution. now famously known as the Dayhoif substitution matrix (Dayhoif et al.. 1972. 1978). Using the amino acid sequences available at the time, Dayhoif and colleagues devised a counting approach to construct a 20 x 20 matrix of substitution probabilities over a short evolutionary distance (of. say, 0.01 changes per amino acid site). Their procedure involved several ad hoc choices. for accommodating tlie sparse data sets of the day. and for reducing the possibilitv that inferred single amino acid replacements may be the resuit of several unohserved replacements. Nonetheless. flic ideas proved inspiring, aiid highly useful to those interested in inferring evolutionarv relations. or phytogenies.
1.5
Conclusions
Kimura and Dayhoif are but two (arbitrary) examples of the type of research and evo Ïutionary analysis made possible by molecular biology. From about flic 1980’s onward, novel molecular techniques have made it possible to sequence far greater amounts of DNA and amino acid sequences (fig. 1.7a). Technical advances have also made it pos sible f0 resolve three-dirnensional molecular structures much more easily and quickly (fig. 17h). Over tlie same vears. flic capahilities of computing machines have experi enced a similar growth trend. sending most practitioners into an ever-lasting overha.ul of information technologv infrastructures.
‘The terrnph ytogeny cornes fromthe Greekphyte. Ineaning“tribe” or “race”. andgenetikos. meaning
6e+10 5e+1 0 4e+10 3e+10 2e+10 le±10 0 1985 35000 30000 25000
ï
20000 15000 10000 5000 o 1985Figure 1.7. Increasing amounts of molecular data. In panel a). the number of base-pairs in GenBank (http: //www.ncbi. nlm.nih. gov/ Genbank) is displayed over 20 years, spanning 1985—2005. Panel b) shows the number of structures in the PDB (http://www.pdb.org/) over the same period. This figure was made using Gnuplot. as were ail other quantitative figures.
Altogether, these developments have driven evolutionary biology into the so-called genomic revotution. where questions about the underlying evolutionary process, or about phylogenetic relations. can be addressed hased on massive amounts of molec ular level data. There has also been a movernent away from ad hoc methodologies. with many researchers now attempting to devise richer mathematical models of molecular evolution within a sound probabilistic framework. The details of such a framework are the subject of the next chapter.
1990 1995 2000 2005
Probabilistic phylogenetic analysis
Suppose you’re on a game show and you’re given the choice of three doors. Behind one door is a car; behind the others, goats. The car and the goats were placed randomly behind the doors before the show. The rules of the gaine show are as follows: After you have chosen a door, the door remains closed for the time being. The game show host, Monty Hall, who knows what is behind the doors. now has to open one of the two remaining doors, and the door he opens must have a goat behind it. If both remaining doors have goats behind them, he chooses one randomly. After Monte Hall opens a door with a goat, he will ask you to decide whether you want to stay with your first choice or to switch to the last remaining door. Imagine that you choose Door 1 and the host opens Door 3, which has a goat. 11e then asks you “Do you want to switch to Door Number 2?” Is it to your advantage [if you wish to maximize the probability of wining the car] to change your choice?
—Re-statement of the IVionte Hall problem. from Krauss and Wang. 2003. p. 25. Yes, you should switch. The first door has a 1/3 chance of winning. but the second door has a 2/3 chance.
—Marilyn vos Savant. columnist. responding a reader posing the Monte Hall prohiem.
2.1
Introduction
The famous Monte Hall prohiem, described in the opening citations. caused a wave of astonishment in the 1990’s as a vivid example of people’s deficiency in logically
handiing uncertainties. Even in this simple case, with a clearly defined system to evaluate, most people’s intuition. including that of trained statisticians, fails to correctly account for ail relevant information when making a choice, and columnist Marilyn vos Savant had to push through a surprising lengthy series of responses before her readers correctly recognized the solution’. When the situation under consideration is more complicated, and when the system under study is not clearly understood, intuition becomes particularly untrustworthy.
Probability theory offers a natural framework for making decisions or inferences. which reduces to deductive logic in cases of complete information (Jaynes. 2003). The Bayesian paradigm in particular is considered a full probabilistic frarnework. in the sense that it forces the investigator to explicitÏy state ail assumptions during an analysis. This view is based on interpreting probabilities as expressions of our state of knowledge. Gelman et al. (2004) succinctly summarize the framework:
The process of Bayesian data analysis cnn be idealized by dividing it into the following three steps:
1. Setting up offutt probabitity modet—ajoint probability distribution for ah observable and unobservable quantities in a problem. The model should be consistent with knowledge about the underlying scientific problem and the data collection process.
2. Couditioning on observed data: calculating and interpreting the appropri
ate posterior distTibntion—the conditional probability distribution of the
unobserved quantities of ultirnate interest, given the observed data.
3. Evaluating the fit of the model and the implications of the resulting posterior distribution: does the model fit the data, are the substantive conclusions reasonable. and how sensitive are the results to the modeling assumptions in step 1? If necessary, one can alter or expand the model and repeat the three steps. (p. 3)
The first step is a creative process. Indeed. the creative nature of this step imphies ‘The Monte Hall prohiem has become n useful tool incognitive psvchology as a means of elucidating mental strategies to problem solving. Krauss and Wang (2003), for instance, point out that the correct solution, changing your choice, cnn be derived from Bayes theorem. and that the solution is readilv seen when approaching the question from Monte HaWs perspective: “[...] the change from the contestant’s perspective to Monte HaWs perspective corresponds to a change from non-Bayesian to Bayesian thinking.” (p. 7)
that no general rnethod is available for constructing the basic form of a model. Choices at this step are necessarily arhitrary, arid must he evaluated retrospectively in the third step of the Bayesian framework. Given a model M, specified by some high-dimensional parameter vector 6 e
e.
the second step is pureiy technical, and cari be formaiized as an update of oui state of knowiedge about tire hypothesis vector & before observing any data. tire prior pro babitity. written as p(O M), to oui state knowledge after observing tire availabie data. tire poster2or probability. written as p(6 D. M). and caiculated according to Bayes’ theorem:D, M) = p(D M)p(6 M) (2.1)
p(D
I
M)where p(D
I
6, M) is tire Ïiketihoodfunction. aird wirerep(D
I
M)=
f
p(D &.M)p(& M)d6 (2.2)
is a normalizing constant. also caiied tire marginal likeÏihood or tire pTiOT pTedzCtive probabîlity. The distribution given bv (2.1) is tire focus of tire secoird step of tire Baesian frarnework, wirereas tire quantity in (2.2) is of interest in tire third step.
Untii relativeiy recentiy, adopting full probahibstic approacires was computationaliy prohibitive in rnost contexts. Over tire iast decade. however. IVlarkov dam Monte Cario (MCIVIC) computational techniques irave permeated across several disciplines as general and unifying approaches to addressing manv of these practical difficulties. Tire evolutionary anaiysis of moiecular data iras greativ henefited from tirese advances. whicir irave sparked several researcir programs in popuiation genetics aird phviogenetics.
In this chapter, we present tire evolutionary context and modeis in greater matire matical detaii. focusing on two different ieveis of interpretation: 1) tire arnino acid levei, with data coirsisting soieiy of aiigned anrino aeid sequences. and 2) the codon ievel. with data consisting of aiigned protein coding nucleotide sequences. We iay out tire com
putational methods used for approximating the probabilities of interests, and offer a few practical examples, of prior structure explorations, of parameter expansion-based MCMC methods. and of simple means of displaying posterior distributions.
2.2
Data
In the present work, the data available consist of aligned sequences of either nucleotides or amino acids, sampled across different species. A phylogenetic tree is used as an account of the evolutionary paths relating the sequences (fig. 2.1). Upon considering such data. one might first object that evolution occurs over populations. and that evo lutionarv analyses shoiild 5e hased on markers sampled across members of the same species. so as to ciaracterize the variation and evolution of these markers over time. This is indeed a central motivation of population genetics. However, the motivations of phylogenetic analysis can be considered as encompassing those of population genetics. by studving variation across a broader range of genetic diversity. and thus attempt ing to uncover high-order evolutionary features or patterns that. might he too subtie to detect from population level data. In rnost cases. phylogenetic analyses make the assumption of nul polymorphism1. and are based on defining a substitution as the fixa tion of a mutation in the population. Phylogenetic models thus consider a substitution as the elementarv event. Looselv speaking, the models focus on long-term evolution arv patterns. by attempting to descrihe an evolutionary process which, over time. could plausihlv have panned out to produce the aligned set of extant sequences. furthermore. for some types of evolutionary rnodels considered here the link with population genetic theory can be made mathematically explicit (e.g.. Thorne et al., 2007), as a consequence of their distinct parameters bearing on mutational features and selective constraints.
‘In the present context. a polvmorphism refers to the occurrence of several different versions of bio-molecule in u given population.
which are combined multiplicatively to specify the overali substitution process.
The aliguments used here were selected or constructed on the basis of them heing free
(or virtually ftee) of gaps. being of relatively short length (for computational reasons). and consisting of (or encoding for) proteins with one representative having a resolved
tertiarv structure (for the structural evolutionary models studied in Part II). We refer
to data sets using a shorthand indicating the protein type, the number of sequences. and their length. hi number of amino acids (or codons. in the case of nucleotide sequences):
• Myo2Q-153: 20 arnino acid sequences of tetrapod rnyoglobim • Myo6O-153: 60 amino acid sequences of mammalian myoglobin;
• IVIYOJO-153: 10 arnino acid sequences of mammalian rnyoglobin:
• Myo-153: 4 amino acid sequences of myoglobin from Physester catodon. Orici nus orca. Graptemys geographica and Chetonia mydas caranigra;
• PPK1O-158: 10 amino acid sequences of bacterial 6-hydroxvmethyl-7-8-dihydroxypterin
pvrophosphokinase;
• FBP2O-363: 20 amino acid sequences of vertebrate fructose bisphosphate aldolase; • GL0BIN17-1: 17 vertebrate nucleotide sequences of the -globin gene, described
in Yang et al. (2000a):
• L’sIN25-134: 25 abalone sperm lvsin coding nucleotide sequences, described in Yang et al. (2000b);
• Hiv22-99: 22 hurnan irnrnuiodeficiency virus type 1 protease codillg nucleotide sequences. described in Doron-faigenboirn and Pupko (2007).
The first six of these alignmellts are of our own construction, and are detailed in Appendix A.