Problèmes de perception de la parole dans le bruit
chez les enfants qui présentent
un trouble de traitement auditif
par Josée Lagacé
École d’orthophonie et d’audiologie Faculté de médecine
Thèse présentée à la Faculté des études supérieures en vue de l’obtention du grade de Ph.D.
en Sciences biomédicales option audiologie
août 2009
Faculté des études supérieures
Cette thèse intitulée :
Problèmes de perception de la parole dans le bruit chez les enfants présentant un trouble de traitement auditif
présentée par : Josée Lagacé
a été évaluée par un jury composé des personnes suivantes :
Phaedra Royle, président-rapporteur Benoît Jutras, directeur de recherche
Jean-Pierre Gagné, co-directeur Tony Leroux, membre du jury Evelyne Veuillet, examinateur externe Maryse Lassonde, représentant du doyen de la FES
Résumé
Il est bien connu que les enfants qui présentent un trouble de traitement auditif (TTA) ont de la difficulté à percevoir la parole en présence de bruit de fond. Cependant, il n’existe aucun consensus quant à l’origine de ces difficultés d’écoute. Ce programme de recherche est consacré à l’étude des incapacités sous-jacentes aux problèmes de perception de la parole dans le bruit chez les enfants présentant un TTA.
Le Test de Phrases dans le Bruit (TPB) a été développé afin d’examiner si les difficultés de perception de la parole dans le bruit d’enfants ayant un TTA relèvent d’incapacités auditives, d’incapacités cognitivo-linguistiques ou des deux à la fois. Il comprend cinq listes de 40 phrases, composées de 20 phrases hautement prévisibles (HP) et de 20 phrases faiblement prévisibles (FP), de même qu’un bruit de verbiage. Le niveau de connaissance du mot clé (mot final) de chaque phrase a été vérifié auprès d’un groupe d’enfants âgés entre 5 et 7 ans. De plus, le degré d’intelligibilité des phrases dans le bruit et le niveau de prévisibilité ont été mesurées auprès d’adultes pour assurer l’équivalence entre les listes. Enfin, le TPB a été testé auprès d’un groupe de 15 adultes et d’un groupe de 69 enfants sans trouble auditif avant de l’administrer à des enfants ayant un TTA.
Pour répondre à l’objectif général du programme de recherche, dix enfants présentant un TTA (groupe TTA) et dix enfants jumelés selon le genre et l’âge sans difficulté auditive (groupe témoin) ont été soumis aux listes de phrases du TPB selon différentes conditions sonores. Le groupe TTA a obtenu des performances significativement plus faibles comparativement au groupe témoin à la tâche de reconnaissance du mot final des phrases présentées en même temps qu’un bruit de verbiage compétitif, aux rapports signal-sur-bruit de 0, +3 et +4 dB. La moyenne de la différence des scores obtenue entre les phrases HP et FP à chaque condition expérimentale de bruit était similaire entre les deux groupes. Ces résultats suggèrent que les enfants ayant un TTA ne se distinguent pas des enfants du groupe témoin au
plan de la compétence cognitivo-linguistique. L’origine des difficultés d’écoute de la parole dans le bruit dans le cas de TTA serait de nature auditive.
Toutefois, les résultats des analyses de groupe diffèrent de ceux des analyses individuelles. Les divers profils de difficultés d’écoute identifiés auprès de cette cohorte appuient l’importance de continuer les investigations afin de mieux comprendre l’origine des problèmes de perception de la parole dans le bruit dans le cas de TTA. En connaissant mieux la nature de ces difficultés, il sera possible d’identifier les stratégies d’intervention de réadaptation spécifiques et efficaces.
Mots-clés: tests de perception de la parole dans le bruit, enfants d’âge scolaire, habiletés langagières, contexte linguistique
Abstract
A hallmark listening problem of individuals presenting with Auditory Processing Disorder (APD) is their poor speech recognition in noise. The underlying cause of their difficulties in unfavourable listening conditions is unknown. The objective of this dissertation was to explore the underlying nature of the speech perception problems in noise in the case of APD.
The Test de Phrases dans le Bruit (TPB) was developed to explore the underlying origins of the speech perception difficulties in noise in the case of APD, in order to identify if they are related to an auditory dysfunction, a language-based dysfunction or both. The TPB consists of five lists of 40 recorded sentences, including 20 highly predictable (HP) sentences and 20 low predictable (LP) sentences, and a speech babble. The familiarity of each sentence final key word was tested with a group of children from five to seven years old. The intelligibility in noise of the sentences and the degree of predictability were also measured with adult participants in order to obtain equivalent lists. The actual sentence list sets of the TPB have been tested with a group of 15 adults and a group of 69 children without any hearing problem before its use with children presenting with APD.
To achieve the general goal of the study, ten participants identified with APD (APD group) were assessed with the TPB, as well as ten age and gender matched children with normal auditory processing functions (control group). The mean performances of the APD group were significantly lower than the ones of the control group on the TPB sentence keyword recognition in noise at the signal-to-noise ratios of 0, +3 and +4 dB. The group average of the HP and LP difference of scores was similar between the groups at each of the tested signal-to-noise ratio. These results suggest that, as a group, children with APD use linguistic contextual information when listening to speech in background noise to the same extent as the ones of the control group.
According to these analyses, the underlying origin of the speech perception problems in noise in the case of APD would be related to an auditory dysfunction.
However, examination of the group data analyses differed from the individual analyses. The verification of the individual patterns revealed different profiles suggesting that further substantiation of these preliminary findings is warranted. A better understanding of the listening difficulties in noise exhibited by individuals with APD should lead to specific and efficacious intervention programs.
Keywords: speech in noise tests, school age children, language-based competencies, linguistic context
Table des matières
Résumé……….. Abstract………... Table des matières………...………….….… Liste des tableaux………...………..…. Liste des figures……….… Listes des sigles, acronymes et abréviations……….……… Remerciements………... Introduction………... 1.1 Cadre théorique de la perception auditive de la parole……… 1.2 Le trouble de traitement auditif………... 1.3 Organisation de la thèse……….. Chapitre 1……….. Article 1 – Auditory Processing and Auditory Speech Perception Problems
in Noise: Finding the Underlying Origin…...…………..……… Abstract……….……….... Introduction……….………...
Auditory Processing Disorder (APD)..………...….. Assessment of Auditory Speech Perception in Noise……… Delineating the Underlying Origin of the Auditory Speech Perception Problems in Noise in the Case of APD……….……….………...
Hypothetical Psychometric Functions……….……….………... Auditory processes dysfunction….……….……….……… Language-based processes dysfunction………... Dysfunction of auditory and language-based processes………….. Conclusion………. References………..………... Table Caption……… iii v vii xii xiv xx xxii 1 4 6 7 10 11 12 13 14 14 19 21 21 23 24 24 28 36
Figure Captions……….………..………... Chapitre 2………...………... 2.1 Article 2 – Development of the Test de Phrases dans le Bruit (TPB)…. Abstract………..……... Introduction………...
The Development of the TPB……… Development of the Speech Material……….. Experiment 1 - Measurement of the Key Words Intelligibility in Noise………
Participants……… Procedure………... Results………...
Experiment 2 – Evaluation of the Key Words Predictability………..
Participants……….... Procedure………... Results………...
Experiment 3 – Verification of the Performance on the TPB at Various SNRs………...……….…….. Participants……… Procedure………... Results………... Discussion………. Conclusion……….…… References………...……….. Table Caption……….………...………...……….. Figure Captions……….
2.2 Mesure exploratoire de l’équivalence des listes du TPB……… 2.2.1 Participants et procédure……….. 2.2.2 Résultats………... 40 43 45 46 47 49 49 53 53 53 54 55 55 55 56 57 57 58 59 61 64 67 70 72 79 80 80
2.2.3 Synthèse……….…... 2.3 Résultats obtenus auprès d’un groupe d’enfants soumis au TPB………
2.3.1 Participants ……….. 2.3.2 Équipement et stimuli expérimentaux………..……… 2.3.3 Mesures expérimentales……….…...
2.3.3.1 Effet de développement………..
2.3.3.1.1 Résultats………...
2.3.3.2 Performances en fonction du rapport signal-sur-bruit………
2.3.3.2.1 Résultats……….……….…...
2.3.4 Synthèse………...
2.4 Article 3 – Exploring the Underlying Nature of the Speech Perception Difficulties in Noise among Children with Auditory Processing Disorder…….………. Abstract……….…….... Introduction………...………....
Speech Perception in Noise Tests………. The SPIN Test……….……....
The TPB……….………..…………
Method………... Participants…..……….…...… Stimuli and Apparatus……….… Design and Procedure………..……...
Hearing screening ………... APD tests………...……….... Experimental testing………...……... Results………...………….... Hearing Testing and APD Testing……….. Auditory Speech Perception in Silence………... Auditory Speech Perception in Presence of Babble Noise…………..
82 83 84 85 86 86 87 90 90 93 94 95 97 97 97 99 100 100 101 102 102 102 103 104 104 104 105
Use of Linguistic Contextual Information………... Individual Patterns………... Discussion……….………. Conclusions..……….….…………... References……….… Table Captions……….……….. Figure Captions………. Chapitre 3………...………….………….. Discussion……….…...
3.1 Limites du programme de recherche……….………….. 3.2 Avenues de recherche……….………. Conclusion……….……… Bibliographie……….……… Annexe A – Lettres d’information et formulaires de consentement…………. Mesure de la familiarité des mots………. Mesure de l’intelligibilité des mots dans le bruit et mesure du degré de prévisibilité des phrases………. Mesure des performances en fonction du rapport signal-sur-bruit (adultes). Mesure des performances en fonction du rapport signal-sur-bruit (enfants). Article 3 – Enfants ayant un TTA – formulaire approuvé par le comité d’éthique du CEPEO et du Centre de recherche du CHU Sainte-Justine…. Article 3 – Enfants ayant un TTA – formulaire approuvé par le comité d’éthique de l’Université d’Ottawa………..…. Article 3 – Enfants sans TTA – formulaire approuvé par le comité
d’éthique du CEPEO et du Centre de recherche du CHU Sainte-Justine…. Article 3 – Enfants sans TTA – formulaire approuvé par le comité
d’éthique de l’Université d’Ottawa………..…. Annexe B – Listes du Test de Phrases dans le Bruit …………..……….. Annexe C – Questionnaires………... 106 108 109 111 114 119 122 127 128 137 139 143 146 I II VII XI XV XIX XXIV XXIX XXXIII XXXVIII XLII
Version pour enfants……….. Version pour adultes……….. Annexe D – Lettres aux parents………...………. Version – Résultats anormaux au test de dépistage……….. Version – Résultats normaux au test de dépistage………
XLIII XLIV XLV XLVI XLVIII
Liste des tableaux
Chapitre 1Article 1. Auditory Processing Disorder and Auditory Speech Perception in Noise: Finding the Underlying Origin
Table 1. Overview of available speech in noise tests…………....………37
Chapitre 2
Section 2.1. Article 2. Development of the Test de Phrases dans le Bruit (TPB) Table 1. Samples of the actual version of the TPB sentence lists. The type of
sentences is indicated in parentheses at the end of each item, i.e., HP for the high predictable sentences and LP for the low predictable sentences. Each key word appears once in HP and once in a LP sentence, but only once in a given list, for example, the word camp appears in the list 1 in the HP context (bold) and in the list 2 in the LP context.………71
Section 2.2. Vérification de l’équivalence des listes du TPB auprès d’un groupe d’adultes
Tableau 1. Valeur du pourcentage moyen (et écart-type) de reconnaissance du mot clé obtenu pour les phrases hautement prévisibles (HP) et les phrases faiblement prévisibles (FP) pour les cinq listes de phrases du TPB au rapport signal-sur-bruit de 0 dB. Le nombre de participants ayant été exposés à cette condition d’écoute pour chaque liste apparaît entre parenthèses……….. 81
Section 2.4. Article 3. Exploring the Underlying Nature of the Speech Perception in Noise Difficulties among Children with Auditory Processing Disorder
Table 1. Results obtained by the APD group (top section of the table) and the control group (bottom section of the table) at the SSW and the SSI-ICM tests.
Failed indicates that the score was below two standard deviations (SD) from
the published mean average norms. Normal signifies that the score is within two standard deviations from the published mean average norms. The symbol * indicates that the data were taken from the clinical file …...….120 Table 2. Average difference scores between HP and LP sentences obtained at each
signal-to-noise ratio for the APD group and the control group. Standard deviation values are in parentheses...121
Liste des figures
IntroductionFigure 1. Schéma du cadre conceptuel illustrant les deux niveaux de traitement sous-jacents à la perception auditive de la parole………..…………..5
Chapitre 1
Article 1. Auditory Processing Disorder and Speech Perception Problems in noise: Finding the underlying Origin
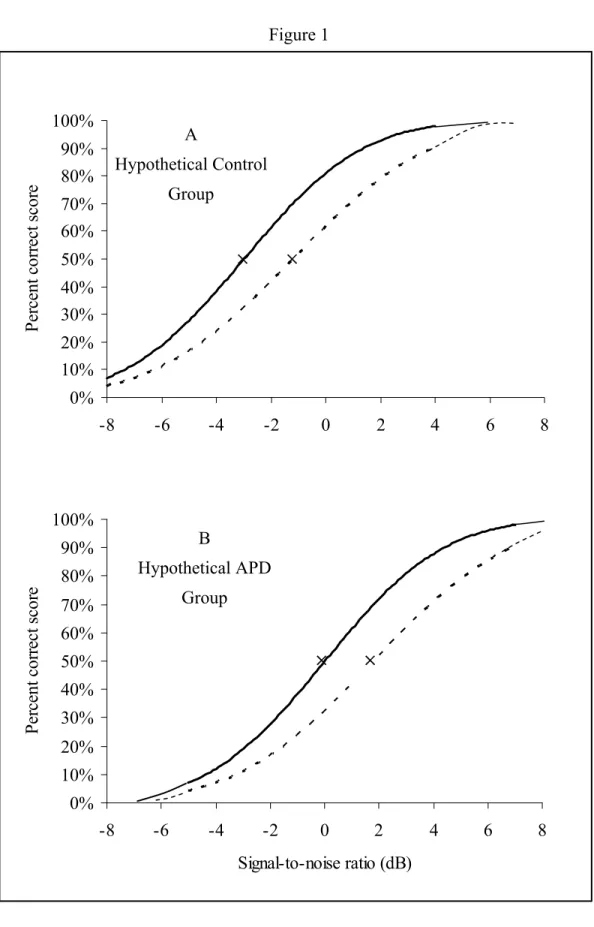
Figure 1. Hypothetical psychometric functions from individuals with normal hearing are shown in panel A, and hypothetical psychometric functions from individuals with auditory processing disorder (APD) are shown in panel B. The hypothetical functions represented with a filled line illustrate the scores that could be obtained with high predictable (HP) sentences at different signal-to-noise ratio (SNR) (in dB). The hypothetical functions represented with a broken line illustrate the scores that could be obtained with the low predictable (LP) sentences. These hypothetical functions are created with the assumption that the underlying cause of APD is an auditory dysfunction. As shown by the X symbol on the broken line of panel A, the psychometric function for LP sentences reaches 50% correct score at a SNR of -1 dB for the hypothetical group of participants with normal hearing. The hypothetical group of participants with APD achieve a 50% correct word recognition score at SNR of +2 dB for the LP sentences as illustrated by the X symbol on the broken line of panel B. For the HP sentences, the psychometric function shows a performance of 50% at SNR of -3 dB for the hypothetical group of listeners with normal hearing (see X symbol on the filled line, panel A). The hypothetical group of individuals with APD reach this level of performance at SNR of 0 dB (see X symbol on the filled line, panel B)…….…………...41
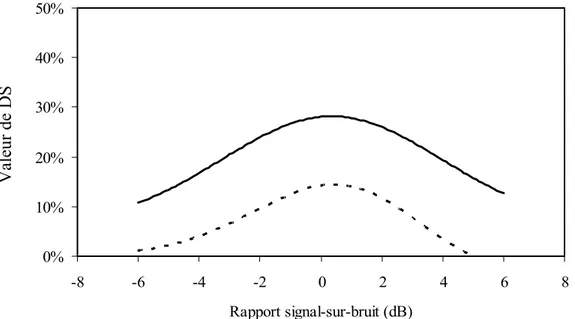
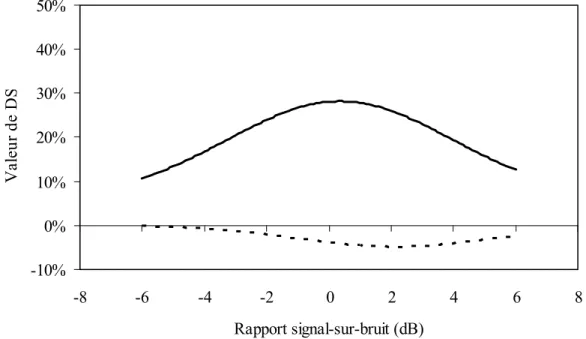
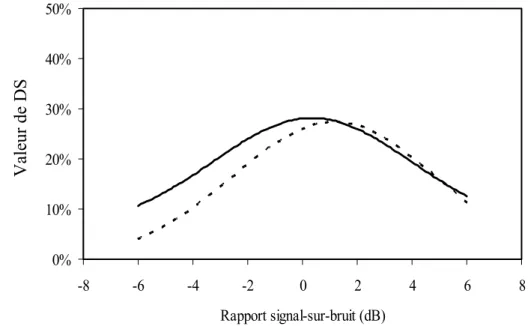
Figure 2. Difference scores obtained on high predictable (HP) and low predictable (LP) sentences are plotted as a function of signal-to-noise ratio (SNR). The functions represent the data from two hypothetical groups: individuals with normal hearing functions (full line) and individuals with APD (broken lines). Panels A and B illustrate that the speech perception problems in noise would be of auditory origins. Panel C illustrates hypothetical results that would be obtained if the speech perception problems in noise experienced by the individuals with APD would be of language-based origins. Panel D illustrates that the speech perception problems in noise would be from a mix of auditory and language-based dysfunctions………...……….42
Chapitre 2
Section 2.1. Article 2. Development of the Test de Phrases dans le Bruit (TPB)
Figure 1. Percentage of correct key word recognition score obtained by 10 adults for seven lists of sentences at a signal-to-noise ratio of 0 dB (Experiment 1). For each list, the dark grey bar represents the mean average percentage obtained for 20 high predictable sentences and the grey bar represents the mean average percentage obtained for the low predictable sentences...74 Figure 2. Percentage of correct key word recognition score obtained by 14 adults for
seven lists of sentences at a signal-to-noise ratio of -2 dB (Experiment 2). For each list, the dark grey bar represents the mean average percentage obtained for 20 high predictable sentences and the grey bar represents the mean average percentage obtained for 20 low predictable sentences.……...75 Figure 3. Percentage of correct key word recognition score obtained by 15 adults at
various signal-to-noise ratios with the TPB sentence lists (Experiment 3). The filled line with the square symbol illustrates performance with high predictable sentences and the broken line with the diamond symbol illustrates performance with low predictable sentences at each SNR………76
Figure 4. Percentage of the correct key word recognition scores illustrated in Figure 3 was transformed in z-scores. The z-scores as a function of the signal-to-noise ratio for high predictable (HP) (square symbol) and low predictable (LP) (diamond symbol) sentences are illustrated in the left panel. The regression linear function derived from the z-scores is also illustrated with a filled line for HP sentences and the broken line for LP sentences. The z-scores from the linear regression function have been converted into percentages to produce an intelligibility ogive plot. The ogive function is shown in the right panel with a filled line for HP sentences and a broken line for LP sentences…….77 Figure 5. The filled line with the triangle symbols illustrates the difference of scores
between high predictable and low predictable sentences (in percent) as a function of signal-to-noise ratio. Theses results were obtained from 15 adults with the TPB lists (Experiment 3)………..……..………..…………...78
Section 2.3. Résultats obtenus auprès d’un groupe d’enfants soumis au TPB
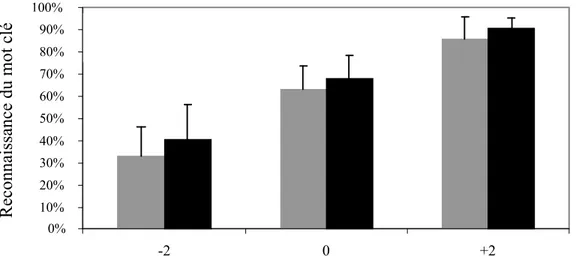
Figure 1. Pourcentage de reconnaissance moyen (et écart-type) du mot clé des phrases faiblement prévisibles obtenu auprès d’un groupe de dix enfants de 9 et 10 ans (illustré en gris) et d’un groupe de onze enfants de 11 et 12 ans (illustré en noir) aux rapports signal-sur-bruit de -2, 0 et +2 dB……….…………...88 Figure 2. Pourcentage de reconnaissance moyen (et écart-type) du mot clé des phrases
hautement prévisibles obtenu auprès d’un groupe de dix enfants de 9 et 10 ans (illustré en gris) et d’un groupe de onze enfants de 11 et 12 ans (illustré en noir) aux rapports signal-sur-bruit de -2, 0 et +2 dB………....88 Figure 3. Pourcentage moyen (et écart-type) de reconnaissance du mot clé des phrases
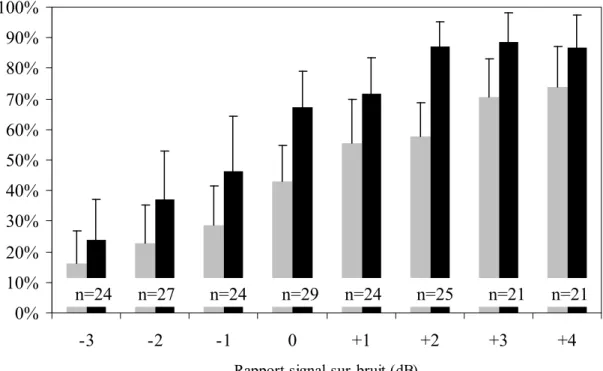
faiblement prévisibles (en gris) et hautement prévisibles (en noir) en fonction du rapport signal-sur-bruit (dB). Ces résultats ont été obtenus auprès de 69 enfants ayant une acuité auditive normale, âgés entre 9 ans 2 mois et 12 ans 5 mois………...……….91
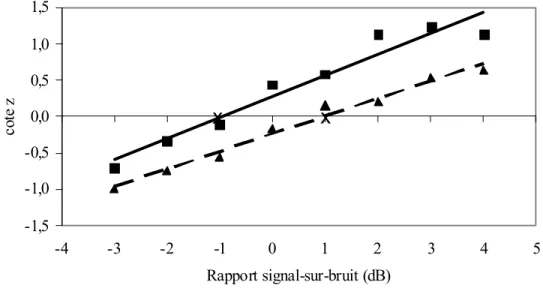
Figure 4. Le score z obtenu à partir du pourcentage de reconnaissance moyen du mot clé des phrases faiblement prévisibles (FP) est représenté par un triangle et les phrases hautement prévisibles (HP) par un carré. La fonction linéaire de la performance de reconnaissance du mot clé en fonction du rapport signal-sur-bruit pour les phrases HP est illustrée par une ligne pleine et celle pour les phrases FP, par une ligne brisée………...92 Figure 5. Fonction psychométrique de la performance de reconnaissance du mot clé
pour les phrases HP (ligne noire) et les phrases FP (ligne grise) en fonction du rapport signal-sur-bruit. Cette fonction a été obtenue en transformant les données (apparaissant à la Figure 4) en pourcentage. Le symbole ‘X’ représente la performance de 50% à la reconnaissance du mot clé………...93
Section 2.4. Article 3. Exploring the Underlying Nature of the Speech Perception Difficulties in Noise among Children with Auditory Processing Disorder
Figure 1. Average keyword recognition scores (in percentage) for high predictable (HP) sentences are illustrated with black square symbols for the control group and grey square symbols for the APD group. Average keyword recognition scores for low predictable (LP) sentences are illustrated with black circle symbols for the control group and grey circle symbols for the APD group. Error bars indicate one standard deviation…...123 Figure 2. The z-transformed group average scores at each tested signal-to-noise ratio
(SNR) for high predictable sentences (HP) are illustrated with a black square symbol, and a grey circle symbol for low predictable (LP) sentences, in the left panel for the APD group and in the right panel for the control group. For each group, the linear regression function computed for HP sentences is illustrated with a black line. The linear regression function calculated for LP sentences is illustrated with a grey line. The r2 variance value is indicated in black for HP sentences and in grey for LP sentences……….124
Figure 3. Benefit from context is illustrated with a grey column for the APD group and with a black column for the control group. Benefit for each group is the average of the difference calculated at the signal-to-noise ratio (SNR) at which the score of 50% was observed for the low predictable sentences minus the corresponding SNR threshold for the high predictable sentences (from data presented in Figure 2). Standard deviations are shown ……....125 Figure 4. Each participant’s z score for low predictable sentences is illustrated with a
full square symbol, an open circle for high predictable sentences and a black triangle for the difference score. The top panel corresponds to performances obtained at a signal-to-noise ratio (SNR) of -3 dB, the second one at a SNR of 0 dB, the third one at a SNR of +3 dB and the bottom panel, at a SNR of +4 dB. The cut-off score is calculated as a z score of 2………...126
Chapitre 3 Discussion
Figure 1. La ligne pointillée représente la valeur de la différence des scores (DS) à chaque rapport signal-sur-bruit (s/b) (en dB) pour le participant APD1 et la ligne pleine illustre la valeur moyenne du groupe témoin. La valeur de la DS maximale du participant APD1 est plus faible que celle obtenue auprès du groupe du témoin, .mais elle est observée au même rapport s/b…………..131 Figure 2. La ligne pointillée représente la valeur de la différence des scores (DS) à
chaque rapport signal-sur-bruit (s/b) (en dB) pour le participant APD3 et la ligne pleine illustre la valeur moyenne du groupe témoin. La valeur de la DS maximale du participant APD3 est plus faible que celle obtenue auprès du groupe du témoin et elle est observée à un rapport s/b plus élevé………...131
Figure 3. La ligne pointillée représente la valeur de la différence des scores (DS) à chaque rapport signal-sur-bruit (s/b) (en dB) pour le participant APD7 et la ligne pleine illustre la valeur moyenne du groupe témoin. La valeur de la DS du participant APD7 est plus faible que celle obtenue auprès du groupe du témoin à tous les rapports s/b………...133 Figure 4. La ligne pointillée représente la valeur de la différence des scores (DS) à
chaque rapport signal-sur-bruit (s/b) (en dB) pour le participant APD9 et la ligne pleine illustre la valeur moyenne du groupe témoin. La valeur de la DS maximale du participant APD9 est plus grande que celle obtenue auprès du groupe du témoin et elle est observée à un rapport s/b plus élevé…...……135 Figure 5. La ligne pointillée représente la valeur de la différence des scores (DS) à
chaque rapport signal-sur-bruit (s/b) (en dB) pour le participant APD10 et la ligne pleine illustre la valeur moyenne du groupe témoin. La valeur de la DS maximale du participant APD10 est plus grande que celle obtenue auprès du groupe du témoin et elle est observée à un rapport s/b plus élevé….……..135
Liste des sigles, acronymes et abréviations
APD – Auditory Processing DisorderASHA – American Speech-Language-Hearing Association
DS – différence des scores (texte français) ou difference scores (texte anglais) TPB – Test de Phrases dans le Bruit
FP- faiblement prévisible
HP – hautement prévisible (ou high predictable) LP – low predictable
OOAQ – Ordre des orthophonistes et audiologistes du Québec S/B – signal-sur-bruit
SNR – signal-to-noise ratio
SPIN – Speech Perception In Noise TTA – trouble de traitement auditif
Remerciements
Tout d’abord, je tiens à remercier mes deux directeurs de recherche, qui chacun à sa manière, m’ont aidée à mener ce projet à bien. Merci à Benoît Jutras qui a bien voulu prendre la responsabilité générale de mes études de doctorat, qui a lu et commenté les multiples versions des différentes sections de cette thèse avec beaucoup d’attention. Je le remercie d’avoir cru en moi (peut-être même plus que moi-même à certains moments) et de m’avoir encouragée tout au long de cette aventure. Merci à Jean-Pierre Gagné, qui m’a soutenue et guidée durant ce travail. Ses lectures perspicaces et ses critiques constructives m’ont beaucoup aidée. Tous les deux, ont su trouver la dose adéquate de conseils et de supervision dont j’avais besoin et démontrer une disponibilité franchement hors du commun. Je leur en suis très reconnaissante.
Mes plus sincères remerciements aux enfants, aux familles, aux étudiants, aux amis, aux collègues, aux audiologistes de même qu’aux enseignants et enseignantes qui ont consenti à participer, d’une façon ou d’une autre, à mes projets de recherche. Merci aussi aux étudiantes qui ont collaboré avec moi à la mise en œuvre des différentes expérimentations de ce projet de recherche et qui m’ont aussi mise à jour, tant au plan technologique qu’au plan social et culturel.
Je veux aussi exprimer ma reconnaissance au Centre de recherche du CHU Sainte-Justine, à l’Université de Montréal, aux Fonds québécois de la recherche sur la nature et les technologies et à l’Assemblée du Révérend Xavier-Daigle pour leur support financier. Ma reconnaissance va également au Conseil des Écoles Publiques de l’Est Ontarien, l’Université d’Ottawa, à l’Université de Montréal, au service d’audiologie du CHU Sainte-Justine et à l’Université du Québec à Trois Rivières pour leur appui au plan matériel (prêt d’équipement, utilisation de locaux).
Je désire remercier mes parents, les membres de ma famille et mes amis qui m’ont encouragée tout au long de ce projet.
Merci à Aimée et Félix, mes enfants, qui ont si bien su s’adapter à cette vie estudiantine dans laquelle je les ai placés pendant ces cinq dernières années. L’amour et la joie qu’ils m’offrent à tous les jours m’ont permis de passer à travers toutes les étapes du doctorat, des plus malheureuses aux plus heureuses.
Enfin, je remercie tout particulièrement Claude, mon conjoint, pour son aide, son soutien et ses encouragements tout au long de ce périple.
est devenu un problème de société. Par exemple, en 1980, 15% de la population européenne était exposée à un niveau de bruit supérieur à 65 dB(A) et en 1995, on en comptait 26% (OMS, 1995). L’augmentation incessante de sources sonores induites par les activités industrielles et de loisirs laisse croire que la proportion de personnes exposées au bruit ne diminuera pas.
Le bruit environnemental est défini comme celui émis par toutes les sources à l’exception du bruit retrouvé sur le lieu de travail (OMS, 1999). Les sources principales de bruit de l’environnement incluent celui du voisinage, celui émis par le trafic aérien, routier et ferroviaire, de même que le bruit généré par la construction industrielle et les travaux publics (OMS, 2001). L’effet le plus important de l’exposition au bruit de l’environnement est la gêne qu’il entraîne (Picollo, Plutino, et Cannistraro, 2005). Les résultats d’un premier sondage canadien portant sur la gêne occasionnée par le bruit de l’environnement auprès de la population révélaient que 8% des personnes âgées de 15 ans et plus étaient très dérangées ou extrêmement dérangées par le bruit environnemental (Michaud, Keith et McMurchy, 2005). Cette donnée représente plus de deux millions de personnes, en se référant aux statistiques de 2006 révélant que la population canadienne comptait 31 612 897 d’habitants et que plus de 80% de la population étaient âgés de 15 ans et plus (Statistiques Canada, 2008).
En plus de la gêne qu’il peut causer, le bruit a un impact négatif sur la santé (Babisch, 2005; Lercher, 1996; OMS, 1999; 2001). La santé est un état de bien être physique, mental et social et non seulement une absence de maladie ou de déficit (OMS, 2001). Le bruit environnemental apparaît comme un facteur de risque de la santé puisqu’il agit de la même façon sur l’être humain que tout autre agent causant un stress à l’organisme (Chepesiuk, 2005; Ising et Kruppa, 2004). En fait, les résultats d’une étude de Willich, Wegscheider, Stallman et Keil (2006), effectuée auprès de 4115 personnes hospitalisées à la suite d’un infarctus du myocarde, montrent qu’il y a un risque accru de cette condition en fonction du niveau de bruit environnemental.
Le bruit apporte aussi son lot de conséquences sur les apprentissages (Shield et Dockrell, 2002; 2003). Par exemple, on dénombre plus d’enfants présentant des difficultés d’apprentissage dans les écoles situées en zones bruyantes que dans celles de quartiers plus silencieux (Shield et Dockrell, 2003). Cette observation est notée même en tenant compte des facteurs comme le statut socio-économique des familles, les sources de stimulation au plan du langage et des habiletés sociales (Shield et Dockrell, 2003).
Le bruit a aussi un impact négatif sur la communication. Par exemple, il est bien connu que la reconnaissance de la parole est plus difficile en présence de bruit de fond qu’en condition silencieuse. Le traitement auditif, cognitif et linguistique requis pour la perception de la parole en présence de bruit exigerait un effort d’écoute supplémentaire comparativement à ce qui est nécessaire lors de conditions acoustiques favorables (Pichora-Fuller, Schneider et Daneman, 1995). Grâce à cet effort d’écoute et des habiletés normales au plan du traitement cognitivo-linguistique et auditif de l’information, l’auditeur arrive à percevoir la parole malgré l’effet masquant du bruit (Cole et Jakimik, 1980).
Or, en présence de conditions sonores bruyantes, certains auditeurs présentent plus de difficultés à percevoir la parole que d’autres. Par exemple, les enfants obtiennent généralement de moins bonnes performances que les adultes à diverses tâches de reconnaissance de la parole en présence de bruit (Elliott et coll., 1979; Fallon, Trehub, et Schneider, 2000; Johnson, 2000; Mills, 1975; Nittrouer et Boothroyd, 1990; Picard et Bradley, 2001). Pour expliquer ce phénomène, on invoque les conditions inhérentes au développement, soit les compétences cognitivo-linguistiques limitées (Elliott et coll., 1979; Nittrouer et Boothroyd, 1990) et l’immaturité du système auditif (Fallon et coll., 2000).
Par ailleurs, les enfants présentant un trouble de traitement auditif (TTA) ont plus de difficultés à percevoir la parole dans le bruit que les enfants du même âge ne présentant pas de TTA (ASHA, 2005; Bamiou, Musiek, et Luxon, 2001; Bellis, 2003;
Chermak, 2002; Chermak, Hall, et Musiek, 1999; Cowan, Rosen, et Moore, 2009; Keith, 1999; Musiek et Geurkink, 1980; Vanniasegaram, Cohen et Rosen, 2004). Par contre, la nature de ces difficultés demeure un point sur lequel il n’y a pas de consensus. Cette thèse se veut donc une exploration de la nature des incapacités à l’origine des difficultés de perception de la parole dans le bruit dans le cas de TTA.
1.1 Cadre théorique de la perception auditive de la parole
Afin de mieux comprendre ce qui expliquerait les difficultés de perception de la parole dans le bruit dans le cas de TTA, nous proposons d’examiner dans un premier temps les différents processus sous-jacents à la perception auditive de la parole. En fait, il existe plusieurs modèles théoriques pour expliquer le processus de perception de la parole (Broadbent, 1958; Geschwind, 1970; Liberman 1982; Luria, 1966; Marslen-Wilson, 1990; Massaro, 1975; McClelland et Elman, 1986; Miller, 1987; Stevens et Halle, 1967). Pour les fins de cette étude, nous proposons un cadre conceptuel simple qui comprend les éléments essentiels sur lesquels la majorité des auteurs s’entendent.
La plupart des modèles théoriques incluent minimalement deux types de traitement généraux sous-jacents au processus de perception auditive de la parole, soit le traitement auditif (ou acoustique) et le traitement cognitivo-linguistique (Frauenfelder et Nguyen, 2003; Stridfelt, 2005) (voir Figure 1).
Le traitement auditif comprend deux étapes, soit la réception du signal sonore au niveau des structures périphériques du système auditif et l’encodage de l’information des stimuli acoustiques (fréquence, durée, intensité) en impulsions nerveuses (petite case du schéma de la Figure 1). Ces impulsions nerveuses poursuivent ensuite leur trajet aux différentes structures du système auditif central (grande case au bas du schéma); ce qui constitue la seconde étape du traitement auditif. Les différents relais entre les noyaux cochléaires et le cortex auditif primaire du système auditif central contribueraient à l’émergence de schémas à partir desquels la représentation mentale du message serait élaborée par les aires du langage en aval du cortex auditif
Représentation mentale du message verbal
Figure 1. Schéma du cadre conceptuel illustrant les deux niveaux de traitement sous-jacents à la perception auditive de la parole.
(Samson et coll., 2001). Chaque relais du système auditif central présente une modalité de décodage spécifique (Uziel, 1983), contribuant à la redondance intrinsèque de l’intégration de l’information.
À l’étape du traitement cognitivo-linguistique (case supérieure du schéma), les impulsions décodées seraient converties en représentations mentales du signal. Cette conversion se produirait suite l’échange d’informations entre les aires classiques du langage et les différentes régions responsables des fonctions cognitives impliquées, telles que la mémoire et l’attention (Samson et coll., 2001).
Parmi les principales fonctions cognitives impliquées au cours du traitement cognitivo-linguistique de la parole, il y aurait les fonctions mnésiques et celles de l’attention (Takayanagi et coll., 2002; Trotter et McConnell, 1980). Par exemple, la mémoire à long terme serait responsable du lexique mental. En fait, il est généralement admis que tout individu possède un lexique mental où sont stockés et organisés les mots de la langue (Marslen-Wilson, 1990; McClelland et Elman, 1996; Stridfeldt, 2005). Une autre fonction mnésique qui contribuerait à la perception de la parole, serait celle
Message verbal
de la mémoire de travail. La mémoire de travail maintiendrait l’information nouvelle, le temps que les processus cognitivo-linguistiques et auditifs s’effectuent (Baddeley, 2003). Quant aux fonctions d’attention de l’auditeur, elles serviraient entre autres, à demeurer attentif à un message verbal cible énoncé parmi d’autres stimuli (Dubno, Ahlstrom, et Horwitz, 2000).
Une dysfonction à l’une ou l’autre de ces différentes étapes du processus peut entraîner un problème de perception de la parole. Les résultats de recherches antérieures ne permettent pas d’identifier sans équivoque les structures du système auditif central (ou les processus auditifs) qui seraient à l’origine des difficultés de perception de la parole dans le cas de TTA (Muchnik et coll., 2004), ni d’éliminer la possibilité d’une dysfonction cognitive ou linguistique.
1.2 Le trouble de traitement auditif
Par définition, le TTA est relié à une dysfonction à l’une ou plusieurs structures du système auditif central qui n’implique pas une atteinte de la sensibilité auditive (ASHA, 2005; OOAQ, 2007). Les limitations qu’entraîne le TTA peuvent être observées au plan d’une ou plusieurs des fonctions du système auditif central, telles que la perception de signal dans le bruit, la latéralisation, la localisation, la discrimination auditive, l’identification de patrons auditifs et l’organisation séquentielle (ASHA, 2005; OOAQ, 2007). Les fonctions cognitives et langagières avec lesquelles interagissent les fonctions auditives sont exclues de la définition du TTA (ASHA, 2005; OOAQ, 2007).
Or, le concept du TTA n’est pas accepté par l’ensemble de la communauté scientifique (McFarland et Cacace, 1995; 1997). Pour certains, les faibles performances de reconnaissance de la parole dans le bruit chez plusieurs individus présentant un TTA sont attribuables à une dysfonction au plan du traitement auditif (Muchnik et coll., 2004; Sanches et Carvallo, 2006) alors que pour d’autres, elles pourraient être reliées à des incapacités cognitivo-linguistiques (Cacace et McFarland, 1998).
En ce qui a trait aux dysfonctions possibles au plan du traitement auditif pour expliquer les difficultés d’écoute de la parole dans le bruit dans le cas de TTA, l’hypothèse d’une dysfonction au niveau du faisceau olivo-cochléaire médian du système efférent cumule de plus en plus de preuves (Giraud et coll., 1997; Muchnik et coll., 2004; Sanches et Carvallo, 2006; Veuillet, Collet et Bazin, 1999; Zeng, Martino, Linthicum et Soli, 2000). Cependant, des incertitudes demeurent quant à l’origine des difficultés d’écoute dans le bruit dans le cas de TTA. Ces incertitudes seraient entre autres reliées au caractère hétérogène du trouble (ASHA, 2005; Bellis, 2003; Vanniasegaram et coll., 2004) de même qu’aux limites des outils d’évaluation disponibles. Jusqu’à maintenant, aucune épreuve clinique comportementale ne permet de cibler la nature des problèmes de perception de la parole dans le bruit chez les personnes soupçonnées d’un TTA. L’identification des incapacités à l’origine des difficultés de perception de la parole dans le bruit chez cette population s’effectue par un processus d’élimination et il arrive dans certains cas, qu’il ne soit pas possible d’en établir la nature exacte. Cette situation complique le processus d’intervention de réadaptation, puisqu’il est difficile d’en identifier les objectifs, les moyens et l’efficacité.
1.3 Organisation de la thèse
Ce programme de recherche est consacré à l’étude des incapacités sous-jacentes aux problèmes de perception de la parole dans le bruit chez les enfants présentant un TTA. Le but est d’explorer l’origine de ces difficultés à savoir si elles sont reliées à une dysfonction auditive, à une dysfonction cognitivo-linguistique, ou à une combinaison des deux.
Ainsi, la thèse comprend trois chapitres. Le chapitre 1 est composé de l’article 1 intitulé «Auditory processing disorder and auditory speech perception problems in noise: Finding the underlying origin». Cet article présente une description du TTA de même qu’une approche qui permettrait de mesurer isolément l’apport du traitement auditif et une composante du traitement cognitivo-linguistique associée à la perception de parole dans le bruit, soit l’utilisation des indices contextuels et linguistiques. En fait,
le test Speech Perception In Noise (SPIN) (Kalikow, Stevens et Elliott, 1977) a été employé dans des études auprès de différentes populations présentant des difficultés de perception de la parole dans le bruit, dont des groupes de personnes âgées ayant une acuité auditive périphérique normale (Kalikow et coll., 1977; Pichora-Fuller, 2008; Pichora-Fuller et coll., 1995; Dubno et coll., 2000), d’adultes ayant une surdité périphérique (Bilger, Nuetzel, Rabinowitz, et Rzeczkowski, 1984; Schum et Matthews, 1992), de même qu’auprès d’adultes présentant des difficultés d’apprentissage (Elliott et Busse, 1987). Les résultats ont permis de cibler certaines pistes quant à la nature sous-jacente des difficultés d’écoute auprès de ces populations. Bien qu’il soit applicable à la problématique du TTA, le test SPIN semble ne jamais avoir été utilisé auprès de cette population. Un profil de résultats hypothétiques est présenté dans l’article 1. Il apparaît que l’utilisation du test SPIN, ou d’un outil de mesure similaire, permettrait de mieux comprendre les difficultés de perception de la parole dans le bruit chez les personnes ayant un TTA.
Aucun outil de mesure comparable au test SPIN n’existe en français. Comme la population à l’étude dans le cadre de cette thèse était francophone, une épreuve similaire a été développée: le Test de Phrases dans le Bruit (TPB). Le TPB est une adaptation franco-canadienne du test SPIN. L’épreuve comprend un bruit de verbiage français (Perrin et Grimault, 2005) et cinq listes de 40 phrases.
Le chapitre 2 de la thèse comprend quatre sections. La première section est composée de l’article 2 intitulé «Development of the Test de Phrases dans le Bruit
(TPB)» qui décrit les différentes étapes du développement de l’outil. La seconde section
porte sur la mesure exploratoire de l’équivalence des cinq listes de phrases du TPB réalisée auprès d’un groupe d’adultes (n=27) présentant une acuité auditive normale. La troisième section fait part des résultats obtenus au TPB auprès d’un échantillon d’enfants (n=69) âgés entre 9 et 12 ans et ayant une acuité auditive normale. Ces deux études ont été effectuées dans le but de s’assurer que le TPB puisse être utilisé auprès de populations d’adultes et d’enfants.
Enfin, la dernière section du chapitre 2 est composée de l’article 3, intitulé «Exploring the Underlying Nature of the Speech Perception Difficulties in Noise among Children with Auditory Processing Disorder». Cet article porte sur la comparaison des résultats obtenus au TPB auprès d’un groupe de dix enfants présentant un TTA et d’un groupe de dix enfants appariés selon l’âge et le sexe, mais ne présentant pas de TTA.
Le chapitre 3 présente une discussion générale des résultats obtenus dans le cadre de ce programme de recherche, de même que l’apport théorique et clinique. Par ailleurs, les limites du présent programme et les perspectives envisagées quant aux prochaines étapes sont également abordées. En conclusion de la thèse, nous rapportons les différents éléments qui se dégagent de nos travaux de recherche.
Article 1
Auditory Processing Disorder and Auditory Speech Perception Problems in Noise: Finding the Underlying Origin
Josée Lagacéa, b, Benoît Jutrasa, b, & Jean-Pierre Gagnéa, c a University de Montréal
b Centre de recherche du CHU Sainte-Justine
c Centre de recherche de l’Institut universitaire de gériatrie de Montréal
Abstract
Purpose: A hallmark listening problem of individuals presenting with Auditory
Processing Disorder (APD) is their poor speech recognition in noise. The underlying cause of their difficulties in unfavourable listening conditions is unknown. The objective of this paper was to theoretically demonstrate how it could be possible to determine whether the listening problems are related to an auditory dysfunction, a language-based dysfunction, or a combination of both.
Method: The SPIN test appears to be a promising tool to explore the underlying origin
of the speech understanding problems among individuals with APD. Its measures provide some information about the language-based competencies of the listener, which is not possible with the other speech in noise tests. The SPIN test has not been applied to listeners with APD. Psychometric functions illustrating hypothetical results from individuals with APD at the SPIN test are presented to postulate about the origin of the speech perception in noise problems.
Conclusion: A better understanding of the listening difficulties in noise exhibited by
Introduction
Auditory speech perception involves, at least, two types of processes: 1) the auditory processing of the signal and, 2) the language-based processing of that information (Kalikow, Stevens, & Elliott, 1977). When the acoustic speech signal is degraded because of the masking effect of a background noise, speech perception is facilitated by the contextual information (Boothroyd & Nittrouer, 1988; Elliott, 1995; Kalikow & al., 1977). For example, words are more easily recognized under difficult listening conditions if they are presented in sentences rather than in isolation or carrier phrases (Boothroyd & Nittrouer, 1988). Therefore, good language-based processing competencies are essential to perceive speech in background noise (Elliott, 1979; Nittrouer & Boothroyd, 1990).
Auditory speech perception may be hampered if there is a dysfunction at any level of the auditory system. For example, listeners with a peripheral hearing loss obtain lower speech recognition scores in noise compared to normal hearing listeners (WGSUA, 1988; Dubno, Dirks, & Morgan, 1984). However, because of the highly intrinsic redundancy within the central auditory nervous system, a simple sorting out of causation is complicated in the case of auditory processing disorder (APD) (ASHA, 2005). Besides, the speech perception problems may not be observed in all listening conditions. For example, individuals with APD usually do not exhibit speech understanding problems when the speech signal is presented in quiet conditions (Bellis, 2003). Nevertheless, these individuals are known to have difficulty understanding speech in noise (ASHA, 2005; Bamiou, Musiek, & Luxon, 2001; Bellis, 2003; Chermak, 2002; Chermak, Hall, & Musiek, 1999; Keith, 1999; Musiek & Geurkink, 1980; Vanniasegaram, Cohen, & Rosen, 2004).
At the present time, the results of available studies have not specifically and unequivocally identified the underlying causes of the reported speech perception problems in noise in individuals with APD (Muchnik, Roth, Othman-Jebara, Putter-Katz, Shabtai, & Hildesheimer, 2004). The present article addresses the relative
contributions of the acoustical and linguistic information of the speech signal for individuals with APD when listening to speech in background noise.
Auditory Processing Disorder (APD)
The American Speech-Language-Hearing Association (ASHA) defines auditory processing disorder (APD) as a deficit in the neural processing of auditory stimuli that is not due to higher order processes such as language, cognitive, or related dysfunctions (ASHA, 2005). APD refers to difficulties in the perceptual processing of auditory information at the level of the central auditory nervous system (ASHA, 2005). These difficulties are demonstrated by poor performance in one or more of the following skills: sound localization and lateralization, auditory discrimination, auditory pattern recognition, and temporal aspects of audition that include temporal integration, temporal discrimination, temporal ordering and temporal masking, as well as auditory performance with degraded acoustic signals (ASHA, 2005). This definition is criticized because it is based on test measurements instead of a conceptual model (McFarlane & Cacace, 2006). Moreover, there is no glossary of terms to define the auditory abilities described in the definition, which can lead to some confusion (Jutras & al., 2007b).
The identification of APD is achieved with the use of global behavioural tests which, most of the time, were developed without appropriate controlled conditions and manipulated variables (Cacace & McFarland, 1998; 2005). Hence, some individuals may perform poorly on tests of auditory processing not because they have auditory-specific perceptual problems but because the tests are sensitive to other processing demands such as linguistic skills for example (Cacace & McFarland, 2005; Rees, 1973; 1981; Wilson, Heine & Harvey, 2004).
Assessment of Auditory Speech Perception in Noise
The most frequently reported characteristic symptom of individuals with APD is their speech perception problems in degraded listening conditions (ASHA, 2005; Bamiou & al., 2001; Bellis, 2003; Chermak, 2002; Chermak & al., 1999; Keith, 1999; Musiek & Geurkink, 1980; Vanniasegaram & al. 2004). However, most of the available
speech in noise tests being used in APD batteries were primarily developed to investigate the effects of peripheral hearing loss or acquired cerebral lesions among adults (Bellis, 2003; Elliott, 1995). The following three speech in noise tests have been standardized for use with children and adults suspected of APD (Krishnamurti, 2007): 1) the Auditory Figure Ground (AFG) subtest of the SCAN batteries (Keith, 2000) for adults and children, 2) the Synthetic Sentence Identification with Ipsilateral Competing Message (SSI-ICM) test (Jerger & Jerger, 1974; 1975), and 3) the Pediatric Speech Intelligibility Test with Ipsilateral Competing Message (PSI-ICM) (Jerger & Jerger, 1984).
The AFG subtest of the child version of the SCAN battery (Keith, 2000) evaluates the ability to recognize monosyllabic words in the presence of a multitalker speech babble. Twenty words are presented to each ear with a signal-to-noise ratio (SNR) of 0 dB. The listener has to repeat each word that is heard. Normative data for the AFG were developed with 1 035 children in schools (Keith, 1986). The AFG has been employed in studies conducted among different populations such as children with attention problems (Keith & Engineer, 1991), children with a history of otitis media (Chermak, Styer, & Seikel, 1995) as well as with children suspected of APD (Dietrich, Succop, Berger, & Keith, 1992; Emerson, Crandall, Seikel, & Chermak, 1997). But, according to some, the results obtained on each subtest of the SCAN battery should be viewed as a tool to determine if further evaluation is needed and not as a stand alone diagnostic test of central auditory function (Bellis, 2003; Schow & Seikel, 2007).
The SSI-ICM test (Jerger & Jerger, 1974; 1975) consists of presenting sentences that are altered from the standard rules of grammar and syntax, called third order
sentences, along with an ipsilateral continuous discourse. Third order sentences contain
words presented in the context of a sentence as they use normal English phonemes and syntax, but the sentences do not convey a particular message (Lucks Mendel & Danhauer, 1997). This design of sentences allows for the perception of individual words without the influence of the meaning or context (Lucks Mendel & Danhauer, 1997). A response template containing the ten sentences of the SSI test identified by a number is
provided to the listener. The listener has to report the number of the sentence that is heard instead of repeating it. This type of response format reduces the potential influence of memory and language on the test (Krishnamurti, 2007). However, this task requires some reading skills to allow the listener to identify the sentence on the response template (Willeford & Burleigh, 1994). The SSI-ICM test has been shown to be useful in the identification of lesions of the low brainstem (Jerger & Jerger, 1974; 1975). It has been employed in studies conducted with different populations such as children, adults and elderly groups presenting speech perception problems in noise (Gates, Feeney, & Mills, 2008; Jutras, Lagacé, Lavigne, Boissonneault, & Lavoie, 2007a; Kramer, Green, & Guitar, 1987; Lopez, Martin, & Thibodeau, 1997). The SSI-ICM test has also been employed in studies conducted with hearing aid users (Hayes, Jerger, Taff, & Barber, 1983), as well as groups of individuals with dementia problems (Gates, Anderson, Feeney, McCurry, & Larson, 2008).
The PSI test (Jerger & Jerger, 1984) is an adaptation of the SSI test that was developed for children of three to six years old. For this test, the child is asked to point the picture of what is heard. It is possible to develop psychometric functions of performance versus SNR with the PSI test based on the child’s response to words (20 simple nouns) as well as sentences (10 simple sentences) (Krishnamurti, 2007). The PSI test can be administered with the competing message in the ipsilateral (PSI-ICM) or the controlateral ear (PSI-CCM). Jerger, Johnson and Loiselle (1988) reported that children with suspected APD (n= 7) obtained similar results pattern on the PSI test to those children with confirmed temporal lesions (n= 5), i.e., abnormal results on the PSI-CCM, but normal results on the PSI-ICM.
Two recent additions of speech in noise tests are the Hearing In Noise Test (HINT) (Nilsson, Soli, & Sullivan, 1994) and the Listening In Spatialized Noise (LISN) test (Cameron & Dillon, 2005). Although not clinically used with individuals suspected of APD, the HINT has been developed to assess the effects of any type of hearing impairment on speech perception in noise (Nilsson & al., 1994). Since its development, the HINT has been used in many studies, for example to measure the benefit of
amplification (Pumford, Seewald, Scollie, & Jenstad, 2000; Ricketts & Henry, 2002) and cochlear implant (Dorman, Loizou, Spahr & Maloff, 2002; Eisenberg, Kirk, Martinez, Ying & Miyamoto, 2004; Nordrum, Erler, Garstecki, & Dhar, 2006) and to measure the functional speech perception in noise ability required for jobs where hearing abilities are critical (Laroche, Soli, Giguère, Lagacé, Vaillancourt & Fortin, 2003). The HINT is composed of 12 lists of 20 phonetically balanced sentences and the degree of difficulty between the lists is equivalent (Nilsson & al., 1994). The sentence lists are used to determine a reception threshold for sentences in quiet and in a background of a spectrally matched speech noise (Duncan & Aarts, 2006). The listener is asked to repeat each sentence that is heard and some variations are allowed for the scoring (Duncan & Aarts, 2006). Carrière (2006) looked at the possibility of using the French adaptation of the HINT (children version) with children presenting with APD or Attention Deficit Disorder (ADD) symptoms. Six children participated in her study and each child presented a different profile of ADD or APD. Five out of the six participants obtained scores outside the range of normal performance for their age group on the HINT test. It was concluded that follow-up studies with larger and more homogenous samples of participants would help in better evaluate the usefulness of the HINT with these populations. Such studies would be useful as the HINT provides accurate predictions of real life performance on auditory speech perception in noise skills (Laroche & al., 2003).
The purpose of the LISN test is to differentially evaluate spatial and aural figure-ground discrimination skills (Cameron, Dillon, & Newall, 2006a), which are believed to be essential underlying functions for speech perception in noise (Richardson, 1977). Spatial figure-ground discrimination refers to a listener’s ability to extract a primary message presented along with other non pertinent messages based on spatial cues such as the interaural timing and intensity differences of the sounds arriving in each of the two ears (Richardson, 1977). On the other hand, aural figure-ground discrimination refers to the ability of selecting a primary message on the basis of the sound dimensions such as the loudness, pitch and timing (Richardson, 1977). The LISN test produces a
virtual three-dimensional auditory environment under earphones (Cameron & al., 2006a). In a three-alternative, forced choice adaptative procedure, the listener is asked to indicate whether the story that is presented simultaneously with a background discourse is easy to understand, just understandable, or too hard to understand, by pointing to the appropriate picture on a response card (Cameron & al., 2006a). Once the listening threshold is found, the listener is required to provide some details about the story. Various measures assess the extent to which either spatial, vocal, or spatial and vocal cues combined increase a listener's ability to comprehend a target story in the presence of distracter sentences (Cameron & al., 2006a). The interpretation of the measures is based on difference scores which, according to the authors, allow a certain control on the participants’ variables such as attention and linguistic skills. Cameron, Dillon & Newall (2006b) assessed children at risk for APD with the LISN test. The APD group (n= 10) performed significantly more poorly on all LISN measures than 48 age-matched controls. These results suggest that some children at risk of APD may have deficits in the binaural processing mechanisms that explain their reported speech perception problems in noise (Cameron & al., 2006b).
The low-cue SNR condition of the LISN test assesses the ability to attend to one of the two identical voices reciting different stories (i.e., the voice of the signal and the distracter is the same, and the location of the signal and the distracter is also the same). According to Richardson (1977), the ability to attend to one of two identical voices reciting different speech selections is based on the continuity characteristics of the target signal. This ability relies on the signal contextual cues. In the low-cue SNR condition of the LISN test, the ability to segregate a story from another simultaneously competing story depends not only on auditory ability but also on language skills. Cameron et al. (2006b) reported that the group of children at risk of APD were able to use contextual cues to a similar advantage than the control group, as they had intellectual function within normal limits (based on the Weschler Intelligence Scale for Children). The authors suggested that the lower performance of the children at risk of APD on the low-cue SNR condition compared to the control group was probably related to other
unknown auditory deficits, such as temporal resolution dysfunction. However, even if their intellectual function was within normal limits, this is not an indication that the children at risk of APD were having similar competences, to those of the control group, to benefit from the linguistic and contextual cues. Some populations with normal intellectual abilities are reported to perform poorly on tasks that require them to take advantage of contextual information. For example, non-native listeners do not benefit as much from linguistic contextual cues as do native listeners on speech in noise tasks (Florentine, 1985; Mayo, Florentine, & Buus, 1997).
A list of available speech-in-noise tests for English speaking populations appears in Table 1, which also contains the primary strengths and weaknesses of each test. For the purpose of this paper, it was felt unnecessary to provide an in-depth review of all the available speech in noise tests. Abnormal performances obtained with any of these tests indicate the presence of auditory speech perception problems in noise. However, the results obtained with most of the tests do not allow the delineation of the underlying contribution of linguistic and auditory factors to speech perception problems in noise as they may reflect either an auditory disorder or a language-based disorder. Deviant performances may also be indicative of other conditions such as attention problems (Geffner, Lucker, & Koch, 1996) or lack of motivation (Silman, Silverman, & Emmer, 2000).
- Insert Table 1 about here –
Delineating the Underlying Origin of the Auditory Speech Perception Problems in Noise in the Case of APD
Because of its design, the Speech Perception in Noise (SPIN) Test (Kalikow & al., 1977) could be used as a clinical tool to identify the underlying causes of speech perception problems in noise among individuals with APD. The original test material consisted of ten tape-recorded lists of 50 sentences aligned with a speech babble (Kalikow & al., 1977). Half of the sentences are highly predictable (HP) because they contain two to three "pointer" words that help to identify the final key word (ex.: The
candle flame melted the wax) (Elliott, 1995). The other half of the list is composed of low predictable (LP) sentences (ex.: Paul can’t discuss the wax). HP and LP sentences
are randomly mixed within each list (Elliott, 1995). Each of the 250 monosyllabic key words appears in one HP sentence and in one LP sentence (Elliott, 1995; Kalikow & al., 1977). However, the same key word never appears in a LP and HP context within the same list (Elliott, 1995; Kalikow & al., 1977).
The recognition score of the LP sentences key words primarily provides some information about the bottom-up (auditory) processing of the acoustic signal (Elliott, 1995; Kalikow & al., 1977). The performance on the HP sentences provides some information about the top-down (or language-based) processing, i.e., the ability to use semantic, syntactic, and contextual cues (Kalikow & al., 1977), as well as the auditory processing of the acoustic signal.
The level of the babble noise at which the test is administered can be varied while presenting the different lists of the SPIN sentences. This test manipulation is relevant for determining the extent to which a listener’s responses to each type of sentence are influenced as a function of SNR (Kalikow & al., 1977).
The percentage of correct responses for the LP and the HP sentences of the SPIN test can be illustrated as a function of SNR with ogive (S-shaped) curves (see Figure 1 for an example). Ogive curves have been used in many speech perception studies to illustrate the proportion of correct responses as a function of stimulus intensity (Boothroyd & Nittrouer, 1988; Dubno, Ahlstrom, & Horwitz, 2000; Laroche & al., 2003; Pichora-Fuller, Schneider, & Daneman, 1995). They are often referred to as speech intelligibility or psychometric functions. These ogive curves can be derived from logistic functions (Lewis, Benignus, Muller, Malot, & Barton, 1988; Pichora-Fuller & al., 1995), or they can be derived from the least squares linear fits to the z transforms of the group means of the percent recognition scores (Boothroyd & Nittrouer, 1988; Laroche & al., 2003).
In the case of the SPIN test, the psychometric functions derived from the HP and LP sentences display the relative contributions of auditory and/or language-based factors to speech perception in noise. The following sections present hypothetical data to demonstrate how one’s performance on the SPIN test could be used to identify the underlying origins of the speech perception problems in noise in the case of APD.
Hypothetical Psychometric Functions
Psychometric functions from a hypothetical control group of individuals with normal hearing (referred to as the control group) and a hypothetical group of individuals with suspected APD (referred to as the APD group) are displayed in Figure 1 (panels A and B respectively). The theoretical psychometric functions shown on Figure 1 are based on the assumption that the underlying origin of APD is an auditory dysfunction.
Auditory processes dysfunction.
Consider the psychometric functions for the LP sentences displayed by the broken lines. For the hypothetical control group (panel A), the psychometric function for LP sentences reaches 50% correct score at a SNR of -1 dB and attains correct score over 90% at a SNR of +4. However, based on the assumption of an auditory dysfunction, the hypothetical APD group would require a higher SNR to achieve a 50% correct word recognition score (SNR of +2 dB) for the LP sentences (panel B) relative to the hypothetical control group. This specific point of the psychometric function (i.e., 50% correct responses) is shifted to the right of the graph, compared to the same performance level obtained by the hypothetical control group for the LP sentences. This would be an indication that participants with APD require a more favourable SNR to achieve 50% correct score for the LP sentences.
A similar pattern of results would be observed for the HP sentences. Consider the psychometric function illustrated with filled lines in Figure 1. For the hypothetical control group, the psychometric function shows a performance of 50% at a SNR of -3 dB whereas individuals within the hypothetical APD group reach this level of
performance at a SNR of 0 dB. Again, the specific point of the psychometric function (i.e., 50% correct responses) is shifted to the right of the graph, compared to the same performance level obtained by the hypothetical control group for the LP sentences. This pattern of results would indicate that participants with APD require a more favourable SNR to achieve 50% correct score for the HP sentences.
- Insert Figure 1 about here –
The difference between the performance on the HP and the LP sentences provides some additional information about the underlying skills of speech perception in noise. As suggested by Elliott and Busse (1987), a plot of the difference scores can be drawn to illustrate the contribution of language knowledge and ability to use the linguistic context of the HP sentences to understand speech in background noise. It also shows at which SNR the listener benefits the most from the use of the linguistic contextual cues. In Figure 2, the difference between the scores on HP and LP sentences is plotted as a function of the SNR. Data from hypothetical APD groups are illustrated with a broken line, and hypothetical control groups with a filled line.
- Insert Figure 2 about here –
The hypothetical data points shown in panel A (Figure 2) illustrate the results that could be expected if the hypothetical APD group and hypothetical control group were equally competent at using linguistic contextual cues, as the amplitude of the maximum difference is the same. However, the peak of the difference function from the hypothetical APD group occurs at a higher SNR compared to the hypothetical control group. This type of plot indicates that the primary problem of the hypothetical APD group, on this task, is basically the auditory processing of the acoustic speech signal.
Another possibility is illustrated in panel B where the hypothetical APD group would show a greater difference scores relative to the control group. The locus of maximal benefit due to the use of linguistic and contextual cues would occur at a higher SNR for the hypothetical APD group compared to control group. This pattern of results
may seem to be counterintuitive. However, results from Pichora-Fuller, Schneider and Daneman (1995), comparing the scores of younger and older adults on the SPIN-R test (revised version of the SPIN test, see Bilger, Nuetzel, Rabinowitz, & Rzeczkowski, 1984) lead to this pattern of results. The authors suggested that because of their poor auditory speech perception proficiency, the group of older individuals may have developed superior abilities at making use of linguistic and contextual cues compared to the group of younger participants with normal hearing. This explanation for the performance of children with APD would need further examination. By their age, children with APD may not have had sufficient time to develop superior language-based abilities then their peers to make use of linguistic contextual cues.
Language-based processes dysfunction.
Alternative data displayed in panel C (Figure 2) are based on the assumption that the underlying cause of difficulties in understanding speech in noise in the case of APD is related to a language-based processing dysfunction. The peak of the difference function would occur at the same SNR for both groups, but with lower amplitude in the case of the hypothetical APD group. Under this hypothesis, individuals with APD are less proficient at making use of linguistic contextual cues compared to the listeners of the control group. In that case, language-based processing dysfunctions only and not auditory dysfunctions would explain the speech perception in noise difficulties observed among individuals with suspected APD. This pattern of results is in agreement with Rees (1973; 1981) suggesting that speech processing difficulties in noise in individuals with APD are related to language comprehension problems and not to auditory dysfunction.
Dysfunction of auditory and language-based processes.
The difference functions displayed in panel D (Figure 2) would be obtained if the underlying origin of APD is a combination of both auditory and language-based dysfunctions. The peak of the difference function from the hypothetical APD group would occur at a higher SNR and with lower amplitude relative to hypothetical control