Publisher’s version / Version de l'éditeur:
TMS2011 Annual Meeting & Exhibition : Supplemental Proceedings : Volume 3 : General Paper Selections, 2011-05-02
READ THESE TERMS AND CONDITIONS CAREFULLY BEFORE USING THIS WEBSITE.
https://nrc-publications.canada.ca/eng/copyright
Vous avez des questions? Nous pouvons vous aider. Pour communiquer directement avec un auteur, consultez la
première page de la revue dans laquelle son article a été publié afin de trouver ses coordonnées. Si vous n’arrivez pas à les repérer, communiquez avec nous à PublicationsArchive-ArchivesPublications@nrc-cnrc.gc.ca.
Questions? Contact the NRC Publications Archive team at
PublicationsArchive-ArchivesPublications@nrc-cnrc.gc.ca. If you wish to email the authors directly, please see the first page of the publication for their contact information.
NRC Publications Archive
Archives des publications du CNRC
This publication could be one of several versions: author’s original, accepted manuscript or the publisher’s version. / La version de cette publication peut être l’une des suivantes : la version prépublication de l’auteur, la version acceptée du manuscrit ou la version de l’éditeur.
For the publisher’s version, please access the DOI link below./ Pour consulter la version de l’éditeur, utilisez le lien DOI ci-dessous.
https://doi.org/10.1002/9781118062173.ch34
Access and use of this website and the material on it are subject to the Terms and Conditions set forth at
A new method for determination of formability limit in the tube drawing process
Bui, Quang-Hien; Bihamta, Reza; Guillot, Michel; D’Amours, Guillaume; Rahem, Ahmed; Fafard, Mario
https://publications-cnrc.canada.ca/fra/droits
L’accès à ce site Web et l’utilisation de son contenu sont assujettis aux conditions présentées dans le site LISEZ CES CONDITIONS ATTENTIVEMENT AVANT D’UTILISER CE SITE WEB.
NRC Publications Record / Notice d'Archives des publications de CNRC: https://nrc-publications.canada.ca/eng/view/object/?id=9be89bca-b717-4074-a9d2-c9e448d2d2e3 https://publications-cnrc.canada.ca/fra/voir/objet/?id=9be89bca-b717-4074-a9d2-c9e448d2d2e3
A NEW METHOD FOR DETERMINATION OF FORMABILITY LIMIT IN
THE TUBE DRAWING PROCESS
Quang-Hien Bui1, Reza Bihamta1, Michel Guillot1, Guillaume D’Amours2, Ahmed Rahem2, Mario Fafard1
1
Aluminium Research Centre - REGAL, Faculté des sciences et de génie, Adrien-Pouliot Building, Laval University; 1065 avenue de la Médecine; Québec, QC, G1V 0A6, Canada
2
National Research Council Canada - Aluminium Technology Centre; 501 boulevard de l’Université Est; Saguenay City, QC, G7H 8C3, Canada
Keywords: Tube drawing, Drawing limit, Formability, AA 6063.
Abstract
A new method for determination of formability limit in the tube drawing process was developed using the position controlled mandrel technique. In this method the mandrel has conical angle in a way that with change of mandrel position, the distance between die and mandrel will be changed and various combinations of thicknesses can be obtained using just one conic mandrel. The advantage of this method is determining the limit cross-sectional reduction for each tube dimension with just one experiment. The realized drawing limit tests on the aluminium tubes show that the average maximum area reduction of AA6063 tubes is about 40%. An optimal tube drawing schedule for production of the constant wall thickness aluminium tubes with high cross-sectional reduction in one pass was successfully established based on the proposed formability limit test.
Introduction
Tube drawing process is wildly used to reduce the outer and inner diameters of tubes. The production of high quality tubes in a short time at a low cost is an ultimate goal in tube drawing process. A multiple-pass tube drawing process is usually used to obtain large cross-sectional reductions in tubular components. As mentioned by Balakrishnan and Brown [1], in order to reduce the number of drawing passes for a given size reduction, the cross-sectional reduction in each pass must be as maximum as possible. However, this maximum reduction cannot get through a threshold value which is called drawing limit or formability limit of tube.
Previously published works generally deal with the formability limit of tube drawing and similar processes like wire drawing, bar drawing and ironing based on experimental analysis, analytical and finite element methods. Oh et al. [2] studied the formability limit of materials in bar drawing processes based on the ductile fracture theory and the deformation mechanism. Schmid et al. [3] described a practical method for calculating the deformation limit in ironing process of deep-drawn cups using an energetic stability criterion taking into account the properties of the material, the tools and the interaction between the two. Alexandrova [4] proposed an analytical model based on the workability diagram for the prediction of the critical value of the reduction in an ironing/drawing process. This model provided the mean stress distribution throughout the tube drawn and used the upper bound method [5] combining with Hill’s analysis [6] for fracture analysis. Karnezis and Farrugia [7] developed a finite element model for the cold tube drawing and optimized the tube drawing process based on the Cockcroft-Latham workability failure criterion to reduce the number of drawing passes. Tong et al. [8] established a non-mandrel drawing limit graph of magnesium tubes based on the ductile fracture criterion of the discrete
Cockcroft-Latham equation and the finite element analysis. Recently, they used the same approach to determine the drawing limit of the AA-6061-T6 tube [9].
Yoshida et al. [10] used the drawing tests to determine experimentally the drawing limit for one pass for various tube drawing methods: fixed plug drawing, floating plug drawing, mandrel drawing and hollow sinking (Fig. 1). They showed that the drawing limit depends on the tube drawing methods and the drawing limit of the mandrel drawing method was the highest. The methodology proposed in Yoshida et al. [10] is time consuming because it needs several experiments using different die or plug dimensions and/or using different tube dimensions to determine the drawing limit of tubes. In addition, the conventional method for determination of drawing limit does not give always the accurate results. To obtain the results with more precision, a sufficient number of plug or die is required. To the authors’ knowledge, until nowadays, no faster method was proposed to determinate the drawing limit of tubes.
Figure 1. Four types of tube drawing [10]
In this study, with a modification made to the classical tube drawing method, the drawing limit in one pass of the process can be determined using the position controlled plug technique. The method proposed in this paper determines the drawing limit for each tube dimension with just one experiment. The position controlled plug technique was recently proposed for producing variable wall thickness tubes [11-13]. In this paper, the same principle of position controlled plug technique was used. However, the originality of this paper is showing capability of the position controlled plug for determination of drawing limit in conventional tube drawing process (for producing constant wall thickness tube). The AA6063-O and AA6063–T4 were chosen as material examples for drawing limit test. Four types of tests were carried out at room temperature on two different outer diameter tubes to determine their drawing limits. As an application of this modification, an optimal drawing schedule was proposed.
Testing equipment and experimental procedures
Drawing setup and tools
As mentioned earlier, for a tube dimension, the drawing limit of fixed-plug drawing (Fig. 1b) should be determined by experimental method by changing the distance between die and plug. Several die and plug in different sizes are required. Therefore, this method is time consuming and expensive. One of the methods to determine the drawing limit of fixed-plug drawing is the use of various experiments with tubes passing through the same die and various fixed-plug dimensions. For that the tubes can be drawn with different cross-sectional reductions. The maximum cross-section reduction that tube can be successfully drawn without fracture during drawing is considered as the drawing limit. It is worth to mention that the use of various fixed-plug dimensions is for changing the relative distance between die and fixed-plug for reducing tube wall thickness. Considering this remark, a modified method named position controlled plug technique
was proposed for changing tube wall thickness reduction. The novelty of the method is that the relative distance between die and plug can be changed during drawing process. Thus, limit cross-sectional reduction for each tube dimension with just one pass is possible. The idea of the position controlled plug technique is presented in Fig. 2.
Figure 2. Position controlled plug technique for drawing limit testing [11]
A new hydraulic drawing machine was designed with a special displacement control system for the mandrel during the process [13]. In this machine, tube pulling and mandrel pushing cylinders can induce maximum forces of 335 kN and 135 kN with strokes of 2.1 m and 1.5 m respectively. The swaged end of tube was clamped by a self locking tube gripper that was attached at the end of tube pulling cylinder. Optical and magnetic encoders were used to detect position of each axis. Also pressure gages were installed on both sides of each hydraulic cylinder to monitor the pressure. Figs. 3a and 3b show the design of the conical mandrel and die respectively. The semi-angles of die and mandrel are α=10° and β=5°1’ respectively. The axial displacement of tapered mandrel was set-up according to a calibration curve obtained prior to the test. This calibration curve provides the axial position of the mandrel as a function of the required tube wall thickness. The mandrel position was continuously changed to reduce progressively tube wall thickness up to tube failure. During the tests, drawing lubrication was injected inside the tube (mandrel) by filling the tube with oil, and outside the tube (die), using multi-jets around the tube and in front of the die. The lubricant utilized for all the tests was Magnus CAL 70-2 drawing oil. The drawing speed was low i.e. 6 mm/s. The thickness variation depends on the relative speed of mandrel and tube.
Figure 3. Tools utilized for drawing limit testing: (a) conical mandrel (b) die
During the tube drawing test, the tube pulling axis was controlled for constant speed while the mandrel was moved to achieve the continuously variable wall thickness. The formability limit in terms of minimum wall thickness and maximum area reduction is obtained before tube failure. These values are useful data for determination of the extent of deformation during a drawing process that a material can experience without failure.
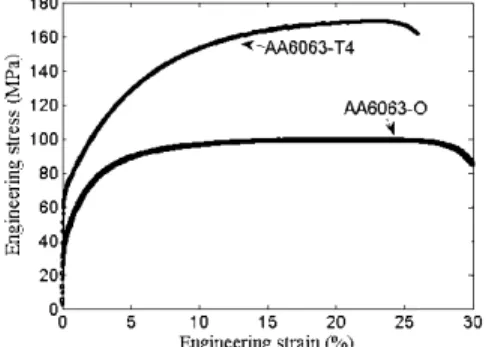
Two batches of AA 6063-O aluminium tubes, supplied by Alfiniti, were considered in the present investigation. Tubes outer diameter and wall thickness are 63.50 mm x 2.4 mm (batch A) and 69.85 mm x 2.4 mm (batch B). Several tubes were randomly chosen from each batch for performing T4 heat treatment. These tubes were subjected to a solution treatment at 500°C for 1h followed by water quenching. In order to obtain constant hardness in a naturally aged condition, these alloys were aged at room temperature for at least about two weeks. The typical microstructure, determined by optical microscopy (Olympus/BX51M apparatus) on both transverse direction-radial direction (TD-RD) and drawing direction-radial direction (DD-RD) plans of AA 6063-O and AA 6063-T4 tubes, shown that the grains are equiaxed (not shown here). The average grain sizes measured from optical microscopy images of AA6063-O and -T4 samples are about 87µm (and 88µm) and 111-µm (and 115-µm) for TD-RD (and DD-RD) plans respectively. Uniaxial tensile tests were carried out at room temperature using a electromechanical testing machine (MTS/ Alliance RT100). Three standard specimens were cut out from the tubes with 2.4 mm thickness and 12.5 mm wide gauge section. The gauge length of the specimen is 57 mm. The specimens were stretched up to fracture point under displacement control at constant speed of 3 mm/min. Based on the load-deformation curves, engineering stress-strain curve for this material were obtained and presented in Fig. 4. Other mechanical properties of AA 6063-O, AA 6063-T4 tubes obtained from uniaxial tension tests are presented in Table 1.
Figure 4. Engineering strain-stress curve of AA 6063-O and AA 6063 -T4 tubes Table 1. Mechanical properties of AA 6063-O and -T4 tubes
Yield strength (MPa)
Ultimate tensile strength (MPa)
Strain at UTS, % Elongation at fracture, %
AA 6063-O 44.4±2.7 99.1±0.3 19.7±0.4 30.0±1.0 AA 6063-T4 68.4±1.8 165.4±3.9 22.7±0.7 27.5±0.5
Experimental results and discussions
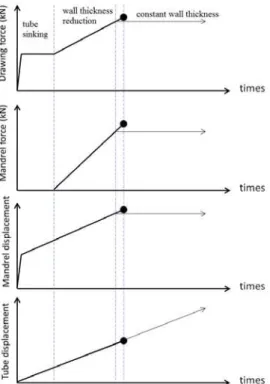
Four different types of drawing limit test were realized on the tubes chosen from different batches and heat treatment conditions (see Table 2). Figs. 5a, 5b show the drawing and reaction forces on the mandrel from experimental results of the tubes. The tube drawing process with variable wall thickness has generally two principal sub-steps: tube sinking step and wall thickness reduction step (Fig. 5a). Figs. 5c and 5d show the mandrel and tube displacements used in the tube drawing. The drawing force monitored during drawing limit test is almost constant during tube sinking and increases as the mandrel comes into contact to reduce the wall thickness. The forces of tube sinking are about 22.4 kN, 31.1 kN, 37.4 kN and 59.1 kN for the tests 1, 2, 3 and 4 respectively. During the drawing limit tests, the drawing and the mandrel force increase until the maximum values are obtained. This state is called the limit state or in other words, the tube drawing limit (Fig. 5a). The maximum force of all tubes drawing is about 40.9 kN, 44.2 kN,
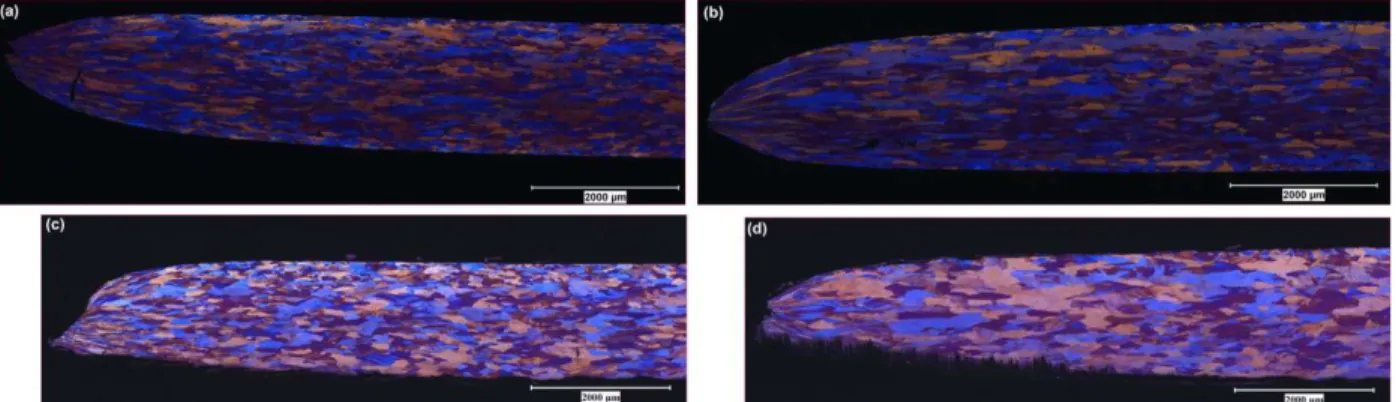
68.2 kN and 78.1 kN for the tests 1, 2, 3 and 4 respectively. The maximum force exerted on the mandrel is about 9.3 kN, 3.3 kN, 14.8 kN and 7.0 kN for the tests 1, 2, 3 and 4 respectively. Fig. 6a-d show the polarized optical microstructure of the fracture zones at the head of the tubes from test 1 to 4 respectively. As it was expected, grain elongation along the axial direction of the drawn tube was observed. In the necking zone, the grains are more elongated. It can be mentioned that the rupture mechanism of tube drawing process is similar to the tensile test samples.
Table 2. Different types of drawing limit test
Tube Initial outer diameter (mm) Initial thickness (mm) Heat treatment Test 1 Batch A 63.50 2.40 O Test 2 Batch B 69.85 2.40 O Test 3 Batch A 63.50 2.40 T4 Test 4 Batch B 69.85 2.40 T4
Figure 5. Experimental results: (a) drawing force, (b) reaction force on the mandrel, (c) mandrel displacement and (d) tube displacement
Figure 6. Polarized optical microstructure at the head of the tubes from (a) test 1, (b) test 2, (c) test 3 and (d) test 4
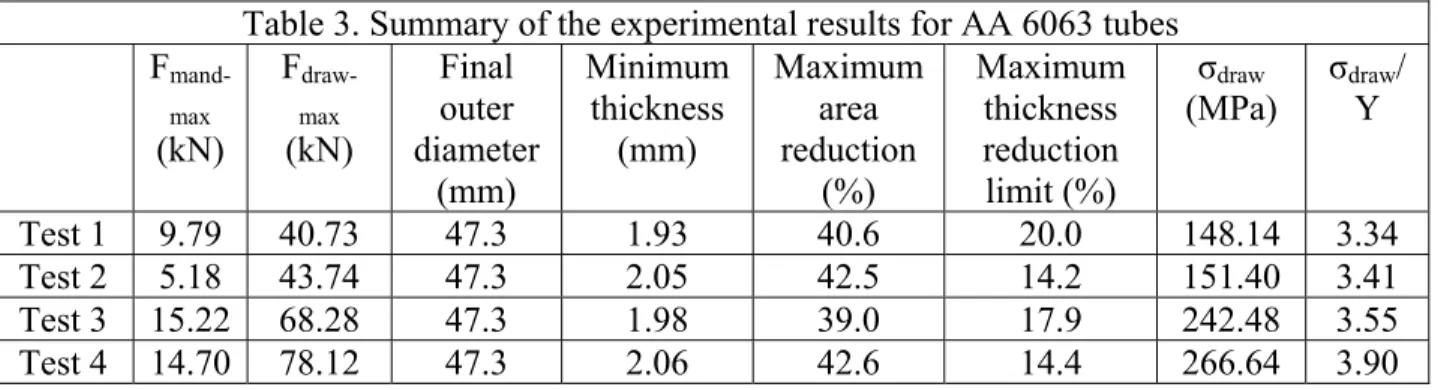
For better measurement of thickness distribution in axial direction, the drawn tubes were cut into two parts. The presented results in Fig. 7a show the variation of the wall thickness measured on the tube after drawing processes in tube length direction. The minimum thickness achieved immediately before tube breakage are 1.93mm, 2.05mm, 1.98mm and 2.06mm for the tests 1, 2, 3 and 4 respectively. In Fig. 7b the corresponding area reductions were presented. The limit values are 40.6%, 42.5%, 39.0% and 42.6% for the tests 1, 2, 3 and 4 respectively. Fig. 7c shows the corresponding wall thickness reduction. The limit values are 20.0%, 14.2%, 17.9% and 14.4% for the tests 1, 2, 3 and 4 respectively. The limit thickness and limit area reduction were calculated and reported in Table 3. The average of area reductions of AA6063-O tubes is about 41.5% close to the one of AA6063-T4 tubes (40.8%). It can be explained by the close elongation values in tensile tests of two materials. The maximum drawing stress is obtained by dividing the maximum axial drawing force over minimum tube area. The averages of maximum drawing stress are about 149.8 MPa and 254.6 MPa for the AA6063-O and AA6063-T4 tubes respectively. The average of drawing stress ratio over initial yield stress i.e. z /Y is about 3.38
and 3.73 for the AA6063-O and -T4 tubes respectively. These values can be considered as a forming criterion for the AA 6063 tube. This criterion is independent of tube outer diameter and tube thickness. It is function of mechanical properties of material [14], of geometry and type of die and mandrel [10], and process parameters (i.e. friction coefficients and temperature conditions) [14].
Figure 7. (a) Variation of the wall thickness measured on the tubes after drawing process, (b) corresponding area reduction and (c) Corresponding wall thickness reduction
Table 3. Summary of the experimental results for AA 6063 tubes F mand-max (kN) F draw-max (kN) Final outer diameter (mm) Minimum thickness (mm) Maximum area reduction (%) Maximum thickness reduction limit (%) σdraw (MPa) σdraw/ Y Test 1 9.79 40.73 47.3 1.93 40.6 20.0 148.14 3.34 Test 2 5.18 43.74 47.3 2.05 42.5 14.2 151.40 3.41 Test 3 15.22 68.28 47.3 1.98 39.0 17.9 242.48 3.55 Test 4 14.70 78.12 47.3 2.06 42.6 14.4 266.64 3.90
As an application of the drawing limit test presented in this paper, an optimum drawing program is proposed. This program consists of two steps. The first one is to determine the drawing limit of the process. Once the drawing limit was determined, the second step is to produce constant wall thickness aluminium tube with maximum cross-sectional reduction. Fig. 8 shows the ideal of optimum drawing tube program.
Figure 8. Schema of the optimum tube drawing: Step 1 ( ) drawing limit test, step 2 ( ) production of the constant wall thickness aluminium tubes with maximum cross-sectional
reduction
Conclusion
A new experimental methodology to investigate the formability limit of aluminium tubes during drawing process was proposed. The position controlled mandrel technique was used in tube drawing process in order to realize the drawing limit tests. Tube drawing tests were performed on AA6063-O and AA6063–T4 aluminium tubes for determining their formability limit. An optimal drawing tube program for production of the constant wall thickness tubes with high cross-sectional reduction in one pass was successfully established. The following results were obtained: (i) The position controlled conical mandrel can be used in the tube drawing process to realized drawing limit test and the minimum wall thickness will be obtained when the tube reaches its failure limit; (ii) A microstructure change (i.e. grain refinement and elongation) is observed at the limit state of tube; (iii) The wall thickness limits of AA 6063-O and AA 6063-T4 tubes in a single drawing pass are different for various initial outer diameters. However, their area reduction limits were always about 40%; (iv) The drawing stress ratios are about 3.38 and 3.73 for AA6063-O and AA6063-T4 tubes respectively. These values can be considered as forming limit criterion which is used to optimize the variable wall thickness tube drawing process as reported in the work of Bihamta et al. [12].
Acknowledgements
The authors thank the National Sciences and Engineering Research Council of Canada, National Research Council Canada-Aluminium Technology Centre (ATC), Alfiniti, Aluminerie Alouette, C.R.O.I and Cycles Devinci for the financial support of this research. A part of the research presented in this paper was financed by the Fonds Québécois de la Recherche sur la Nature et les Technologies (FQRNT) by the intermediary of the Aluminium Research Centre – REGAL.
References
[1] A. Balakrishnan, S. Brown, “Process planning for aluminium tubes: an engineering-operations perspective,” Operations Research, 44 (1996), 7-20.
[2] S.I. Oh, C.C. Chen, S. Kobayashi, “Ductile Fracture in axisymmetric extrusion and drawing; Part 2, Workability in extrusion and drawing,” Journal of Engineering for Industry, 101 (1979), 37-44.
[3] W. Schmid, J. Reissner, “Critical deformation in the ironing of deep-drawn cups,” Journal of
Materials Processing Technology, 24 (1982), 597-604.
[4] N. Alexandrova, “Fracture analysis of tube drawing with a mandrel,” Journal of Materials
Processing Technology, 142 (3) (2003), 755-761.
[5] N. Alexandrova, “Analytical treatment of tube drawing with a mandrel,” Journal of
Mechanical Engineering Science, 215 (2001), 581–589.
[6] R. Hill, “A general method of analysis for metal-working processes,” Journal of the
Mechanics and Physics of Solids, 11 (1963), 305–326.
[7] P. Karnezis, D.C.J. Farrugia, “Study of cold tube drawing by finite-element modeling,”
Journal of Materials Processing Technology, 80-81 (1998), 690-694.
[8] Y. Tong, G. Quan, B. Chen, “Constitutive description for drawing limit of magnesium alloy tube based on continuum damage mechanics,” Materials Science Forum, 610 (2009), 951-954. [9] Y. Tong, G. Quan, B. Chen, “A study on Al-6061-T6 tube drawing limit based on critical damage value,” Materials Science Forum, 102-104 (2010), 69-73.
[10] K. Yoshida, H. Furuya, “Mandrel drawing and plug drawing of shape-memory-alloy fine tubes used in catheters and stents,” Journal of Materials Processing Technology, 153-154 (2004), 145-150.
[11] M. Guillot, M. Fafard, S. Girard, A. Rahem, G. D’Amour, “Experimental study of the aluminium tube drawing process with variable wall thickness” (paper presented at SAE 2010 World Congress, Detroit, MI, USA, 13-15 April 2010).
[12] R. Bihamta, G. D’Amours, Q.H. Bui, A. Rahem, M. Guillot, M. Fafard, “Optimization on the production of variable thickness aluminium tubes,” (paper presented at the International Manufacturing Science and Engineering Conference MSEC2010, Erie, Pennsylvania, USA, 12-15 October 2010).
[13] S. Girard, “Avancement des travaux de conception banc d’étirage” (M. Sc thesis 2007, Laval university, Québec, Canada, (in French)).
[14] S.L. Semiatin, J.J. Jonas, Formability and Workability of Metals: Plastic Instability and
![Figure 1. Four types of tube drawing [10]](https://thumb-eu.123doks.com/thumbv2/123doknet/7705065.246293/3.918.313.601.330.525/figure-types-tube-drawing.webp)
![Figure 2. Position controlled plug technique for drawing limit testing [11]](https://thumb-eu.123doks.com/thumbv2/123doknet/7705065.246293/4.918.288.631.190.321/figure-position-controlled-plug-technique-drawing-limit-testing.webp)