This is an Accepted Manuscript of an article published by
Taylor & Francis in Housing Studies on 18 January 2018
available online:
http://www.tandfonline.com/10.1080/02673037.2017.14
1
DRAFT NOT TO BE QUOTED WITHOUT WRITTEN PERMISSION OF THE AUTHORS
The Changing Determinants of Housing Affordability in Oil-Booming
Agglomerations: A Quantile Regression Investigation from Canada,
1991–2011.
Sinikka Okkola, M.A. Candidate Memorial University of Newfoundland
230 Elizabeth Ave, St. John’s, Newfoundland, Canada, A1B 3X9
aso762@mun.ca
Cédric Brunelle, Assistant Professor1
Memorial University of Newfoundland
230 Elizabeth Ave, St. John’s, Newfoundland, Canada, A1B 3X9
cedric.brunelle@ucs.inrs.ca
Acknowledgements
We thank the staff at the University of New Brunswick Research Data Centre (UNB-RDC), and branch at Memorial University of Newfoundland (MUN-RDC). This research was supported by The Institute of Social and Economic Research (ISER)’s Master Fellowship, Faculty of Humanities and Social Sciences, Memorial University of Newfoundland.
1 Now research professor at Centre Urbanisation Culture Société, Institut National de la Recherche Scientifique, 385 Sherbrooke Street East, Montréal, Québec, H2X 1E3, Canada, cedric.brunelle@ucs.inrs.ca
2
Abstract
Growing evidence suggests that resource-led economic growth generates rising housing prices which make it difficult for low to mid income earners to find adequate, suitable, and affordable housing. This research explores how households’ characteristics associated with housing stress evolve in relation to the commodity cycle, and their relative impact along the distribution of accessibility constraints in two resource-driven agglomerations in Canada: St. John’s, Newfoundland, and Fort McMurray, Alberta. Using census microdata, we develop quantile regression models for households in the bottom, median, and top quartiles of the housing affordability stress spectrum between 1991 and 2011. We find differentiated effects for households with low, median, and high levels of housing stress. The young, lone females, lone parents, and people working in low-paid services face increasing housing stress, while this relation sharply degrades over time for households in the highest quartiles. These results provide evidence of emerging vulnerabilities, notably among renters, first-time homebuyers, and people outside the labour force.
3
Introduction
The recent economic boom in various resource-driven regions in Canada has highlighted housing market failure to provide suitable, adequate and affordable shelter for low to mid income earners (Goldenberg et al. 2010; Keogh 2015). Narratives of rising homelessness and families struggling to find affordable housing have been publicized in the media during a period when Canada has experienced an unprecedented oil-driven economic growth. While resource booms generate income gains for those employed in the resource sector and those who experience spillovers from it, the benefits of resource activities appear far less evident for a larger share of the population.
Economic booms are not without consequences for local housing markets. Housing prices escalate in confluence with local disposable income and demand (Agnello & Schuknecht 2011). This also has implications for the rental market, with economic booms resulting in lower vacancy rates and higher prices. While housing affordability outcomes are undoubtedly affected by supply and demand, there are further underlying complex economic, social, and psychological rationales that shape housing demand (Hulchanski 1995). In Canada, research on the housing-related impacts of economic booms has predominantly focused on large metropolitan areas such as Toronto and Vancouver. Few studies have so far investigated how resource booms (or bust) specifically change the distributions of affordability constraints for households in resource-driven agglomerations. This adds to the fact that most studies on housing affordability remain focused on the housing stress of entire communities. However, the reality faced by individual households is complex, and cannot be analyzed using only average or median housing price or income.
4 Recent work on income inequality shows that disparities are increasingly taking place in the upper and lower tails of the income distribution, which entails a growing polarization in the housing affordability distribution. This study fills these knowledge gaps by analyzing the temporal trends taking place during the time of an oil boom, specifically looking at the changing impacts of household characteristics on housing stress at various points across the affordability spectrum.
The paper begins by presenting a brief overview of the existing literature on resource booms and housing affordability stress, followed by a section that describes the data, methods, and analytical framework of this study. The paper then presents results from OLS and quantile regressions on the changing impacts of household characteristics on housing stress. The paper concludes by summarizing the key findings and discussing policy implications.
Background
Resource Booms and Housing Affordability Stress
Resource booms have major impacts on local economies. Most importantly for the housing market, they generate new high wage employment attracting new workers. An increase in housing demand, partly from well-paid resource sector workers, often contributes to an escalation in housing prices in this context (Agnello & Schuknecht 2011). While rising housing prices in resource-driven urban agglomerations have been noted before (e.g. Okkola & Brunelle 2017; Goldenberg et al. 2010; Randall & Ironside, 1996), there is to date limited knowledge on how such rapid transformations affect these communities and
5 which households are most impacted over time. Growing evidence suggests that low to moderate income earners, such as support and service workers, may be the most at risk of facing problems of affordability—a reality which contrasts their critical role in making these communities livable (Ennis, Finlayson & Speering, 2013; Goldenberg et al. 2010). While municipal and regional bodies struggle to mobilize investments in civic and social infrastructure as a means to attract and retain workers and their families (Keogh 2015; Ryser & Halseth 2011), this paradox makes the question of housing affordability a critical social and political issue for resource agglomerations.
Though resource-led economic growth contributes to significant increase in local GDP, generating royalties and increasing average income levels, such indicators provide little information about the outcomes for the lower end of the income spectrum (Lawrie, Tonts & Plummer, 2011). Resource industries generate well-paid jobs, but there may be a significantly higher number of lowly paid service sector jobs created during an oil boom (Cadigan 2012). This segmentation of the labour market generates income inequalities, dynamics often associated with housing affordability problems (Matlack & Vigdor, 2008; Moore & Skaburskis, 2004). In parallel, general escalations in the cost of living—often over-determined by housing costs—may outweigh income growth. If so, how are these forces impacting housing affordability among households and who is the most affected over time?
So far, case studies have addressed housing affordability problems in small resource towns in Canada, looking at specific socioeconomic groups such as youth or older women
6 living alone (Goldenberg et al. 2010; Ryser & Halseth 2011). However, the vast majority of longitudinal or quantitative studies on housing affordability in Canada remain focused on major metropolitan areas (Bunting, Filion & Walks 2004; Skaburskis 2004). The results for major metropolitan areas may not be directly transferable to resource-driven urban agglomerations. These agglomerations are much smaller, not in the same way influenced by immigration, or even economic restructuring, because they have no significant manufacturing sectors. More important, they are characterized by volatile regional economic structures that are more directly exposed to rapid economic fluctuations of commodity prices. As such, there remains to date a knowledge gap as to how commodity booms and bust impact the populations in urban agglomerations serving expanding resource-based economies—what contrasts the critical role that these spaces have acquired over the past oil boom. Analyzing the changing determinant of housing affordability stress in these agglomerations is not only instrumental for aiding in the design of housing policies that target households experiencing housing-related vulnerability in these agglomerations, but provides important theoretical insights to understand the socioeconomic and developmental dynamics of resource communities.
Dimensions of Housing Affordability
Housing affordability is often defined as a negotiation between housing costs and non-housing expenditures within the constraints of a household budget (Stone 2006). Housing costs tend to be the largest household expense, and therefore determine how much of the income remains for non-housing necessities and savings (Stone 1990, 2006). Problems of housing affordability push households into compromises they would not have made if they
7 had not experienced housing affordability stress (Yates 2008). These can entail cutting down in expenses for food (Kirkpatrick & Tarasuk 2007), heating (O’Neill, Jinks & Squire 2006), and even health care and educational attainment (Moore & Skaburskis 2004, Walks 2014).
Empirically, the most common approach to housing affordability is to measure it as a housing cost to income ratio (CIR). Housing is considered affordable if housing costs remain below 30 percent of a household’s gross income. While this ratio has a long history both in the social sciences and as a policy tool, it has justifiably been criticized for not taking into account the size of remaining disposable income (Hulchanski 1995; Stone 1990, 2006). Therefore, housing affordability is frequently studied for low to moderate income earners (Nepal, Tanton & Harding 2010; Moore & Skaburskis 2004), given that those with a higher income are likely to have enough disposable income to cover their non-housing expenditures. However, growing disparities in income distributions— notably through the rise of highly paid workers—and its impacts on housing market prices suggest that housing stress levels may become increasingly disproportionate along the CIR distribution. In addition, the housing CIR does not take into account household size, composition, and characteristics which have an impact on housing costs and other expenditures (Hulchanski 1995; Marks 1984). This paper addresses these limitations by estimating, through quantile regression models, the impacts of household structures, housing attributes, and characteristics of the principal household maintainer on housing stress at given points along the housing CIR distribution.
8 Other limitations should be noted with the housing CIR. First, the measure only accounts for income gained through labour market activities and governmental transfers. In reality, households frequently have other sources of revenues and services, through the domestic economy, social networks and community groups and agencies (Hulchanski and Michalski 1994). Second, while most households are forced to spend more than 30 percent of their income on housing, there will be cases where households deliberately choose to do so (Rowley, Ong & Haffner 2015). Regardless of their rationale, they risk having a more limited disposable income for their non-housing consumption (Hancock 1993). Meanwhile, low CIR can mask substandard housing conditions (Lerman & Reeder 1987) or crowding (Hancock 1993), or inconvenient or unsuitable location of housing (Carver 1948; Kesteloot 1994). However, despite these potential trade-offs between housing affordability, quality and non-housing consumption, the CIR links housing market and labour market outcomes, exposing trends which are determined by the essential dynamics of the interplay between the housing and labour markets over time (Hulchanski 1995).
The Determinants of Housing Stress
While there is a wealth of literature about housing affordability as a concept (e.g. Gan & Hill 2004; Hulchanski 1995; Stone 1990, 2006), less research has been conducted on what household characteristics specifically determine or explain different housing affordability outcomes. Housing affordability is an income problem, therefore households with low income levels, such as individuals living alone, and single parents, can be regarded as those most impacted by housing affordability stress (Bunting, Walks & Filion 2004;
9 Lamont 2008). Young people are likely to have difficulties in establishing themselves in the housing market because of their current low earnings levels (Skaburskis 2002; Yates 2002). Elderly women living alone (Ryser & Halseth 2011), and those with disabilities (Weeks & LeBlanc 2010) also frequently spend more on their housing than they can afford. Other vulnerable groups such as recent immigrants, visible minorities and Aboriginals are likely to struggle with their housing affordability (Bunting, Walks & Filion 2004; Hiebert 2009; Rea et al. 2008). Renters are more often than homeowners burdened by their housing costs (Hulchanski 2004; Rea et al. 2008). However, it is not clear how these factors play at the regional scale in the context of an economic boom. The fact that housing affordability is positioned at the conjunction of local labour and housing markets makes the detailed interaction of each of these factors a multifaceted process.
Labour market activities are instrumental in both alleviating and exacerbating housing stress for individual households. While highly educated individuals have better access to well-paid employment which tends to decrease housing affordability stress (Rea
et al. 2008), recent labour market restructuring has replaced many full-time jobs with a
multitude of precarious, part-time, and low pay jobs (Skaburskis 2002; Walks 2001, 2010). In these circumstances, young people are likely to spend more time studying, and leaving the parental home and household formation may need to be postponed (Beaupré, Turcotte & Milan 2006; Clark 2007; Yates 2002). Meanwhile, booming sectors such as resource industries provide well-paid employment which may allure young people to drop off from high school (Goldenberg et al. 2010), or postpone their post-secondary education (Emery,
10 Ferrer & Green 2012), although research shows that these individuals return to school when an economic downturn occurs (Alessandrini 2014; Emery, Ferrer & Green 2012).
All segments of the population do not have an equal access to benefits of labour market activities. For a disabled person, it is harder to attain education, and find full-time employment than for those without disabilities (Leiter & Waugh 2009). Aboriginal individuals often end up confined to lowly paid jobs which affect their housing affordability prospects (Rea et al. 2008). Some visible minorities are more likely to experience persistent housing affordability problems (Hiebert 2009), which suggests that their assimilation in the Canadian labour and housing markets could be impeded by racial discrimination. Furthermore, those retired from the labour market due to age or illness have a scant chance of augmenting their incomes to compensate for rising housing costs.
Meanwhile, housing affordability problems are also exacerbated by the aggregate supply and demand in the housing market. Provision of housing for low-income earners has largely been left to the private housing market while new housing development is generally geared towards housing that is too expensive for first-time buyers to purchase (Lamont 2008). At the same time, much of the existing affordable rental housing has been lost through demolition or conversion to high-end use. This has led to a substantially lower share of housing that is affordable to low and moderate income earners. Filtering of existing, older housing stock is a market mechanism that could provide housing for lower costs but processes of gentrification places the price levels of many of these units out of reach for low income earners (Skaburskis & Moos 2010). Furthermore, low income earners
11 may have constraints, such as special housing needs of the elderly with ailing health or disability that prevents them from accessing housing with the lowest cost (O Dell, Smith & White 2004; Rowley, Ong & Haffner 2015).
Current housing decisions may also have an impact on the future housing affordability. Those who manage to buy and sell at the right moment in relation to the resource cycles, collect tax-free capital gains on the inflated housing values (Randall & Ironside 1996). Meanwhile, others face capital losses if they are forced to sell when the boom is over (Lloyd & Newlands 1990). Furthermore, increasing numbers of low to moderate income earners today fund their home purchases with mortgages. This means they are carrying an amount of debt that is disproportional to their incomes (Walks 2013), and puts them at risk of losing their homes and credit rating if anything in their circumstances changes.
Residential mobility is one solution to discrepancies between local labour and housing markets. Short distance mobility often follows from a discovery that the current housing no longer meets one’s needs (Henley 1998), while long-distance mobility is more frequently propelled by employment reasons. Housing tenure plays a role for one’s willingness to relocate. Homeowners with large homes (Lamont 2008) and those trapped in negative equity (Chen. Chai & Chang 2007) are the least inclined to relocate. Renters are more likely to move than homeowners in hope to find more affordable housing. However, if moving is combined with a transition to homeownership, a period of initial housing affordability stress is likely to occur (Rea et al. 2008).
12 Canada needs an influx of immigrants to fill future positions in the labour force due to its low endogenous population growth and an aging population. However, unless an extra supply of housing is provided, these immigrants also contribute to rising housing prices by adding to housing demand (Ley 2007) in the major metropolitan areas in which they prefer to settle (Moos & Skaburskis 2010). According to recent research, most immigrants meet with an initial housing-related hardship during their first 10 years in Canada (Rea et al. 2008), but the differences between immigrants and other populations tend to decline already after four years (Hiebert 2009). Due to their rapid economic growth generating employment opportunities, resource-driven economies receive many of the mobile people, although all resource-led economic growth does not equate numerous jobs and population growth in the region (Ennis, Finlayson & Speering 2013).
Research Questions and Hypotheses
In this study, our main research question is how conditions of housing affordability change among households in relation to a regional economic boom? We hypothesize that resource booms generate segmented labour and housing markets which over time favour growing socioeconomic polarizations among households in these communities. If so, what are the characteristics and types of households most impacted by housing stress over time? Three types of determinants of housing stress are empirically considered in this study, namely the attributes associated with the principal household maintainer, household characteristics, and housing attributes. Based on the previous literature review, our main hypotheses are that housing stress should over time vary primarily in relation to the labour market activities, the type of housing tenure, and family structures, and that these impacts should
13 be contingent on the level of housing stress. The following section presents the methods and estimation strategies mobilized to allow these hypotheses to be tested.
Methodology
Data and variables
This research relies on Statistics Canada’s confidential microdata from the 1991 and 2006 census as well as the National Household Survey (NHS) for 2011. The selected study period starts prior to the most recent oil boom2. The 2006 census reflects an approximate
mid-boom point, after which the global financial crisis of 2008 brought a sharp decline in oil prices. By 2010, the market rebounded to almost the levels of 2007 (Federal Reserve Bank of St. Louis 2016). Regrettably for the consistency of the data over time, the 2006 mandatory census was followed by the voluntary National Household Survey 2011. Voluntary participation in surveys is generally associated with a much higher non-response rate among various segments of the population and often introduces a greater bias in the data (Green & Milligan, 2010; Veall, 2010). Although data quality of the 2011 NHS is criticized by social scientists and economists, they are still the most recent census scale data available after the census of 20063.
2 Hibernia, the first oil field in Newfoundland, became operational in 1997, a period which corresponds to the resurgence of the development of the Athabasca oil sands (Alberta) which followed the 1980s oil crisis.
3 The direction of potential non-response bias should be anticipated in longitudinal analyses. It is reasonable to assume that the results for 2011 would display increasing real income levels, in accordance with the previous comparisons between tax filler and NHS data (Hulchanski, Murdie, Walks, & Bourne, 2013). Unfortunately, this increase is likely to be overstated for low-income earners and understated for high income earners (Green & Milligan, 2010), which would result in seemingly lower income disparities than there should be. In this analysis, the trends are hence provided for all years, but results are interpreted with the potential directionality of this bias in mind.
14 Our analysis focuses on the urban agglomerations of St. John’s and Fort McMurray (FMM), which are compared to the Canadian national aggregate (NA). This national aggregate excludes St. John’s and FMM and encompasses all remaining urban agglomerations with a total population below one million. This avoids outweighing the housing dynamics of comparable urban agglomerations with the distinct housing markets of very large metropolitan areas4.
This research considers households as the lowest unit of analysis. Households are restricted to non-farm households living in private dwellings, while all collective housing (such as lodging houses, institutions and hotels) and band housing were thus excluded from the analysis. The working sample for the analyses is further restricted to households with income levels of $1,000 or higher, and those with housing costs above zero in order to control for potential response bias.
Dependent Variable
For each household, housing affordability and housing stress are measured through the housing cost to income ratio (CIR), which forms the dependent variable in the models. The CIR is formally expressed as:
𝐶𝐼𝑅𝑖 = 𝐻𝐶𝑖⁄𝐻𝐼𝑖 [1]
where 𝐶𝐼𝑅𝑖 is the ratio for each household i between 𝐻𝐶𝑖 as housing costs—total average monthly payment to secure shelter, including energy costs (electricity, oil, gas, coal, wood
4 The national includes all Census Metropolitan Areas and Census Agglomerations outside of Toronto, Montreal, Vancouver, Calgary, Edmonton, Ottawa, as well as the two case studies of Fort McMurray and St. John’s.
15 or other fuels), water and other municipal services, cash rent, and, where applicable,
property taxes, mortgage payments and condominium fees—and 𝐻𝐼𝑖 as gross household
income before taxes.
Independent Variables
The literature on housing affordability offers preliminary grounds for the selection of the socioeconomic and housing characteristics associated with housing affordability problems. Broadly speaking, these characteristics can fall into three categories: 1) attributes associated with the primary household maintainer (PHM); 2) household characteristics (HH); and 3) housing attributes (HOUS)—see Appendix 1. Characteristics of primary household maintainers include their age, disability, educational attainment, labour market activities, mobility, immigration and visible minority status5. Household characteristics
5 PHM variables are defined as follows. Age is coded into ten-year age categories from 15–24 years to 75 years or above (45–54 is the reference category). Disability is a dichotomous variable, with a non-disabled person as a reference. Statistics Canada commentary reveals that the survey questions regarding disability were revised after the 1991 census which makes it easier for respondents to confirm a reduced amount or the type of activity they were unable to carry out in their everyday lives. This has led to an apparent sudden increase of disabled individuals. This difference and the fact that non-responses have not been imputed have warranted a word of caution regarding its use from Statistics Canada. Education is coded into four categories: those with no degree, diploma or certificate, high-school diploma (the reference category), college diploma or trades training, or university graduates. Labour market activities roughly follow North American Industrial Classification System (NAICS) categories although some categories merged into one. The concordance from the 1991 Standard Industrial Classification System 1980 (SIC80) to NAICS2002 and NAICS2007 is not ideal but the industry categories of main interest here, such as the resource sector (oil, gas, mining and quarrying), health care, social assistance and education services, retail, food and accommodation and public service are fairly consistent. Mobility within the last year and within the last five years is expressed for movers within census subdivision (CSD), from other CSD and outside Canada, with movers as a reference. Immigration status has the category non-immigrant (the reference), non-immigrant and non-permanent resident. There are relatively few ethnic minority individuals in St. John’s and Fort McMurray, therefore Aboriginals and other ethnic minorities are integrated into one variable. Visible minority status was accordingly coded as visible minority and other than aboriginal, or aboriginal, with non-visible minority person as a reference.
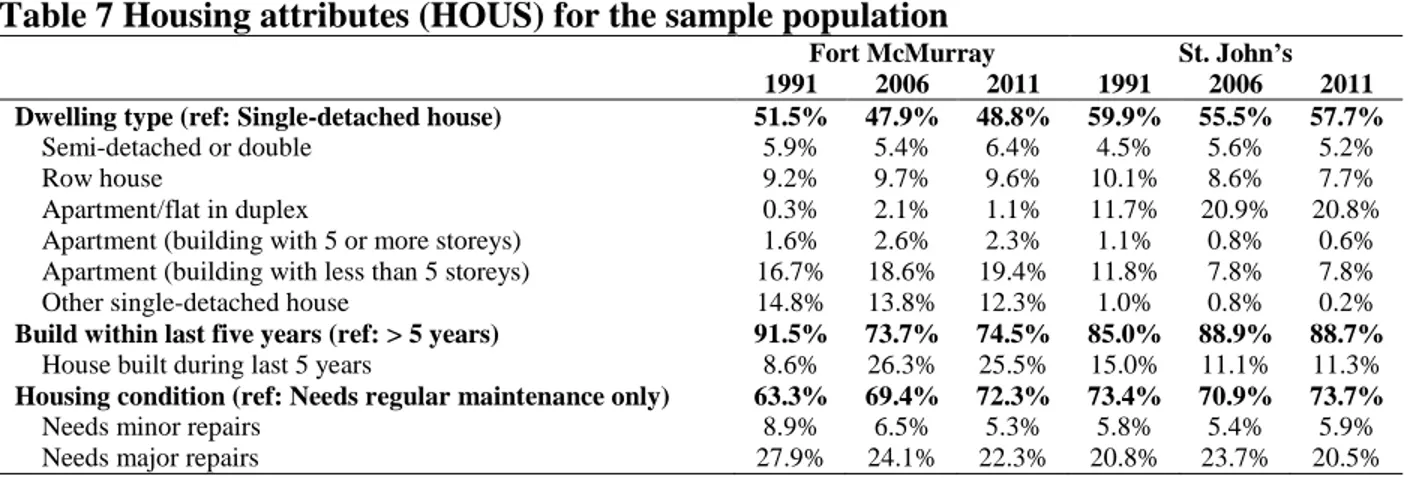
16 entail family composition and number of household maintainers6. Housing attributes entail housing tenure, housing types, new house, housing condition, and crowding7.
Data analysis
As estimation framework, we use both ordinary least squares (OLS) and quantile regression (QR) models. While OLS models are based on the conditional mean of the dependent variable, quantile regression models are based on the qthquantile of the dependent variable. Therefore, QR goes beyond the conditional mean of the CIR to show how the effects differ along the housing affordability spectrum. Due to the skewed nature of both income and housing costs distributions, the range of housing affordability stress is likely to be much wider in the highest housing stress quartiles. As a result, critical household characteristics can have much a larger effect on housing stress of these households than the OLS results predict. Besides, OLS requires constant variance of error or homoscedasticity (Hao & Naiman 2007), a requirement that is not likely to be complied with these datasets since both incomes and housing costs are often highly skewed. Quantile regression specifically tackles these problems by estimating the effects at different points of the distribution of housing stress, targeting medians instead of average values (Hao & Naiman 2007;
6 Same-sex couples were too few to be considered to be of a category of their own and they thus were incorporated in the same category with opposite-sex couples. Couple with children is the reference group for family composition.
7 Housing tenures are non-mortgaged homeowners (the reference group), mortgaged owners, and renters. Housing type has the single-detached house as a reference. New house is a dichotomous variable that indicates whether the house was built during the last five years or not. Housing condition indicates whether the dwelling needs regular maintenance (reference), minor repairs or major repairs. Crowding is a continuous variable that is calculated by dividing the number of individuals in a household with the number of bedrooms in the dwelling.
17 Koenker 2005). This offers a more complete characterization of the data that is also less sensitive to outliers. The general equation for quantile regression is expressed as:
𝑌𝑖 = 𝑋𝑖′𝛽𝑞+ 𝜀𝑖 [2]
where 𝛽𝑞 is the vector of unknown parameters associated with the qth quantile and 𝜀𝑖 prediction errors.
When fully specified, the estimated model equation for this study is given by:
𝐶𝐼𝑅𝑖 = 𝑃𝐻𝑀𝑖′𝛽1𝑞+ 𝐻𝐻𝑖′𝛽2𝑞+ 𝐻𝑂𝑈𝑆𝑖′𝛽3𝑞+ 𝐹𝐸′𝛾 + 𝜀
𝑖 [3]
where the dependent variable 𝐶𝐼𝑅𝑖 offers a measure of the level of housing stress through the housing cost to income ratio for a household i. 𝑃𝐻𝑀𝑖 is the vector of variables for
characteristics of the primary household maintainer, 𝐻𝐻𝑖 the vector of variables for
household characteristics, and 𝐻𝑂𝑈𝑆𝑖 the vector of housing attributes. The model further includes fixed effects (FE) for each municipality or Census Subdivisions (CSD) within the agglomerations as a set of extra controls. The empirical results are shown in two separate sections for OLS and quantile regressions.
Empirical Results
Selected Resource-Driven Agglomerations and Descriptive Statistics
Fort McMurray is among the best known resource-driven urban agglomerations in Canada. This agglomeration is the largest settlement and urban service centre for the regional municipality of Wood Buffalo in northern Alberta, with a population of 66,896 in 2011
18 (Statistics Canada 2016)8. In recent years, the region has experienced a very strong population growth due to its close proximity to the Athabasca tar sands which have been a scene of oil extraction activities since 1967 (Sheppard 1989). The region provides a multitude of well-paid jobs during oil booms—about 40% of the primary household maintainers in FMM are employed in oil and mining industry (See Appendix 1). Meanwhile, the Athabasca tar sands accounted for 70% of Canadian oil production in 2009 (Natural Resources Canada 2011). Housing demand has been much higher than housing supply in this booming economic environment and this has contributed to soaring housing costs for both renters and homeowners.
This long history of oil extraction in FMM is contrasted by that of St. John’s. The capital of Newfoundland became a natural hub for offshore oil extraction activities, which first began in 1997. Since then, the city experienced a significant economic growth during the recent oil boom, transforming the regional economy which was in decline after the 1992 cod moratorium. In 2009, Newfoundland was responsible for 10% of the oil production in Canada (Natural Resources Canada 2011), and its population increased to 196,966 in 2011 (Statistics Canada 2016). At the same time, less than 3% of the employment of the primary household maintainers in our sample was in the oil sector (See Appendix 1), which suggests a weaker contribution to problems of housing affordability. Yet, the recent past has seen the St. John’s metropolitan region become among the fastest growing in Canada for its oil production and average housing costs.
19 Descriptive data reveal important changes taking place in both urban agglomerations between 1991 and 2011, notably in regard to demographics, and the labour and housing markets (Appendix 1). Aging of the population is a dominating demographic trend, particularly in St. John’s. There are consequently fewer couples with children and a growing number of single-person households over time. Regional differences entail a much lower prevalence and decreasing share of lone females in FMM compared to St. John’s.
In both agglomerations, the effect of the oil boom is reflected in the labour market. Unemployment has decreased while increasing labour market participation has become a norm. The fast economic growth has also resulted in a decrease in the numbers of households with one maintainer, while households with two maintainers—and in FMM even households with three or more maintainers—have increased over the period. Both agglomerations further show a growing share of mortgaged homeowners over time, while the proportion of renters has decreased. However, this decrease is only in relative terms as the absolute number of renters has increased. A general tendency towards larger homes and smaller household sizes decreases the probability of crowding, particularly in St. John’s. The new house indicator for FMM is very high, indicative of a building boom.
Results
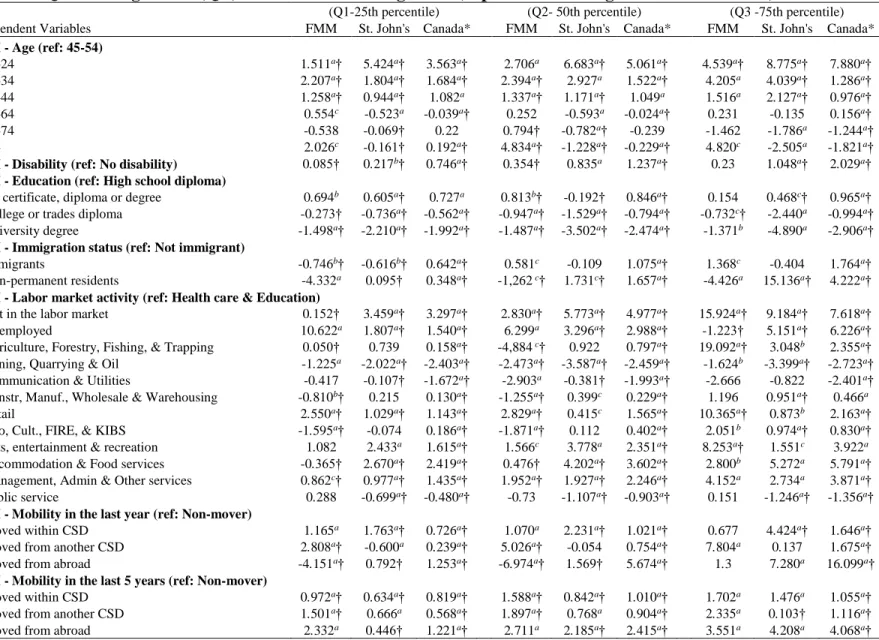
OLS estimates for FMM, St. John’s, and the Canadian NA in 1991, 2006, and 2011 are shown in Table 19. Along with the OLS results, Table 2 provides estimates for the 25th
9 Post estimates for the OLS model included collinearity diagnostics and test for the presence of heteroscedasticity (Breusch-Pagan) test for heteroscedasticity. No major problems of multicollinearity in the estimations were found (see Table 12 in Appendix). However, Breusch-Pagan tests for heteroscedasticity shows that variance of error is not constant
20 percentile or first quartile (Q1), the median or second quartile (Q2), and the third quartile (Q3) or the 75th percentile of housing stress to demonstrate the effects of explanatory
variable at each quantile in 200610. Tables 3 and 4 in Appendix further provide QR results for 1991 and 2011 respectively, showing how the effect of each variable varies over time according to the threshold of housing stress.
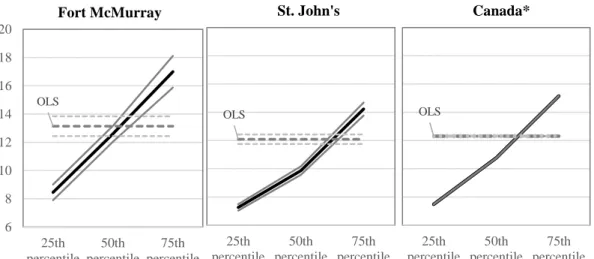
As expected, housing tenure stands as the most important determinant of housing affordability among all estimated variables for all periods. Mortgaged owners and renters face a significantly higher housing stress than those who own their homes outright. In all locations, the effect associated with being a renter tends to deteriorate over time, from a CIR impact of 11.034 (p <0.001) to 13.181 (p <0.05) in FMM and 10.775 (p <0.001) to 12.089 (p <0.05) in St. John’s (Table 1). At the same time, housing costs to income burden improved for mortgaged homeowners, compared to the reference group of non-mortgaged homeowners. The NA effects for mortgaged homeowners also show a slight improvement, although the deterioration of the renters’ housing stress is low compared to the two other locations. However, while OLS results indicate that the general housing affordability of renters deteriorated in both St. John’s and FMM over the period, the quantile coefficients provide richer information, as the coefficients follow an upward sloping pattern with the quantiles (see Figure 1). Being a renter varies greatly between the quartiles, increasing the CIR of 8.652 (p <0.001) in the 25th percentile to 16.908 (p <0.001) in the 75th percentile in
for any of the previous OLS regression models. This was expected as both income and housing costs tend to follow skewed distributions, which support the choice of using quantile regression model specifications.
10 A test of significance assess whether coefficients for each quartile significantly differ from OLS estimates, with the † symbol denoting difference at p <0.05.
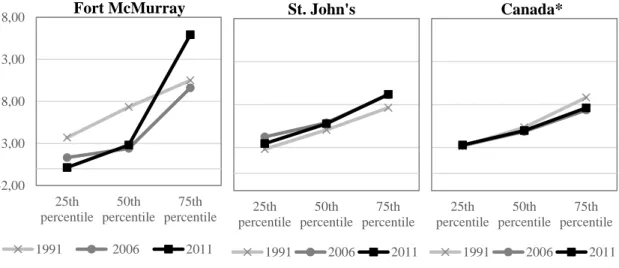
21 FMM and 7.264 (p <0.001) to 14.229 (p <0.05) in St. John’s (Table 1). Results further show that housing affordability burden for renters has grown more rapidly in FMM across the entire housing affordability continuum, but increasingly so in the upper quartiles of the housing stress distribution (Figure 2). All effects for renters and mortgaged owners compared to the reference group were lower in St. John’s than for the NA, while FMM renters’ effects generally exceeded those of the NA. The effects of NA renters never exceed that of mortgaged owners although the trends brought them closer over time.
Family composition represents the second most important contributor to housing stress. Controlling for all other factors, OLS models show that single females with or without children are among the most vulnerable household types, which greatly increase the CIR as compared with the reference group (couple with children). However, the impacts differ significantly along the housing stress distribution, as shown in the QR models. In St. John’s, lone females in the bottom 25th percentile are associated with a 5.965 (p <0.001) increase in the CIR, while the impact more than doubles for households in the top 75th percentile, reaching 13.117 (p <0.001) in 2006. Lone females in all quartiles experienced deteriorating housing affordability prospects in FMM, while their housing cost burden was getting lighter in St. John’s. Single female parents have faced an improvement in FMM while their housing stress has increased in the 25th percentile in St. John’s. Compared to the NA, FMM was better for lone females, while St. John’s was worse, particularly towards the higher end of the housing stress spectrum. Lone female parents have effects above the NA level at the 75th percentile of housing stress, in FMM this is also true for the 50th percentile.
22 TABLE 1 & 2—ABOUT HERE
FIGURE 1 & 2—ABOUT HERE
Labour market activities of the PHM stand as the third most important group of predictor of housing stress. As anticipated, economic growth during the recent resource boom has translated in significant changes in the relative impact labour market characteristics and housing affordability in both FMM and St. John’s. Offshore oil extraction in Newfoundland started first in 1997, and unsurprisingly the oil and gas industry was not associated with any significant effect on housing affordability in 1991. This started to change in 2006, with households having the PHM working in resource industries (Mining, Quarrying & Oil) being the second single most important labour market factor improving housing affordability. Non-trivial is that this alleviating influence on the CIR of households having the PHM work in resource industries soared to - 5.099 (p <0.001) in 2011, when oil production was at its peak in our dataset (Table 4). At the same time, the alleviating effect of working in the public services increased from -0.495 (p <0.05) in 2006 to -2.799 (p <0.001) in 2011, which matches with the rapid increase in revenues for provincial employees that followed the collective bargaining at a time of important oil royalties. The alleviating effect of having a PHM work in extractive industries such as mining and oil declined in FMM over the same period, from -4.664 (p <0.001) to -1.274 (p <0.001). However, extractive and utility industries remained by far the best labour market characteristics improving affordability in both agglomerations, and even in the NA.
23 PHM that are unemployed and those outside of the labour force are experiencing some of the highest housing cost to income burden—a situation which deteriorated beyond the NA level for which the effects remained relatively constant over the period (Table 1). However, QR estimations show that significant differences are taking place along the housing stress distribution, creating a different trend as the oil boom takes place. While both the unemployed and individuals outside the labour market were facing growing affordability problems, the highest impact and growth over the period are found for households already facing the highest cost to income burden (Table 2). Non-trivial is that some of the highest coefficients are found within these groups for the 75th percentile, which statistically differs from the OLS estimates. In both FMM and St. John’s, the QR coefficients increasingly follow an upward sloping curve as we move up the housing stress distribution over time (Figure 3). These effects are also higher than those for the NA, with exception of unemployment in FMM in 2011. Not only has resource-driven economic growth in the two agglomerations failed to improve affordability of the most economically vulnerable groups between 1991 and 2011, but it has made their housing situation a lot more problematic.
Besides resource employment, economic growth spurs demand for various services. Those employed in generally lowly paid Retail and Food and Accommodation industries also experienced an employment boom. However, their earnings have often been outpaced by rising housing costs. As indicated by the OLS results, Food and accommodation workers in St. John’s faced an increasing housing affordability burden for all levels of housing stress (Table 1). QR results further show that the effect of being employed in the Food and
24 Accommodation sector is almost twice as high for households that are already the worst afflicted by their housing cost than that in the 25th percentile of housing stress (Table 2).
However, this is comparable to the NA. Similar trends are also noted for the Arts, Entertainment, and Recreation industry, with a greater increase in affordability stress at the top of the affordability stress spectrum. Housing affordability has also deteriorated in FMM for those employed in the Retail sector, with its impact on the CIR increasing in FMM from a coefficient of 1.998 (p <0.001) in 1991 to 6.657 (p <0.001) in 2011. Once again, the worst impacts are found among CIR quintiles.
FIGURE 3—ABOUT HERE
Age is the strongest predictor of housing stress among the socio-economic variables. OLS estimates show that age categories have distinct and significant effects on housing affordability, although more importantly in St. John’s, where housing stress among young persons aged between 15 and 34 generally exceeds that of the NA. For the same age group, housing stress was initially lighter in FMM than for the national aggregate but it deteriorated after 1991. Meanwhile, the national aggregate shows a slight improvement for those aged 25 to 34 years over time. Compared to the reference age group (45 to 54), being a principal household maintainer (PHM) in the 15–34 age group increases the housing CIR in St. John’s, while being aged between 55 and 64 years tends to decrease the level of housing stress, although in smaller proportions. The situation has deteriorated for those beyond the active population threshold (65 to 74), leaving them relatively closer to the reference group than in the NA. Fort McMurray, shows a similar improvement of housing
25 stress among young people (15 to 24 years) over time. However, the situation has deteriorated for the 25–34 and 35–44 age categories which have a strong impact on increasing the CIR, exceeding the effects in the NA. The evolution has been even more concerning for the elderly. Those aged 65 to 74 years went from lower CIR than the reference group to having a CIR of the same range as the reference group, as did those 75 years of age or above. While those older than 65 years may have experienced a slight deterioration in the NA, their housing stress burden is still clearly lower than for the reference group.
Age summarizes the interconnectedness of career and housing paths as well as income levels in the labour market. A young person with his or her education goes through a progression, moving forward from entry-level salary to that of a senior worker with experience, after which income levels decline at retirement. There is a corresponding progression in the housing market, from young renters to young first-time house buyers in the midst of household formation and a multitude of expenditures to an established homeowner who finally owns his or her home outright. However, during a resource boom, housing prices rise rapidly and this may make young first-time buyers unable to become homeowners despite potentially well-paid employment opportunities. Older individuals may benefit if they owned their homes before the boom occurred. Meanwhile, older renters will struggle when their rental costs rise. As individuals age, their housing needs change and this may present a particular challenge during resource booms.
26 The outcomes for the young who are in the process of entering the labour market and housing market are an important indicator as to how the regional labour and housing markets are performing. As expected, results show that the younger the primary household maintainer is, the higher is the housing cost to income burden, although the youngest group (15-24) has experienced improving housing affordability prospects during this period. However, QR estimates show a different pattern in FMM and St. John’s as compared to the national aggregate, with signs of new polarizations taking place between 1991 and 2011. While those between the age of 25 and 34 experienced a deteriorating housing affordability in St. John’s and FMM, the impacts are increasingly felt in the upper quintiles of housing stress, resulting in the development of an upward sloping curve over the period. On the other hand, being aged 25-34 has slightly improved housing stress distribution for the 75th percentile in the NA, resulting in a downward sloping curve along the CIR
distribution (Figure 4).
While earnings generally increase with age, the housing cost to income burden becomes lighter. For age categories 55 to 64, the effects often become negative, indicating improving housing affordability. However, those between 65 and 74 in FMM experienced a change. Although the resulting effects are not statistically significant, they suggest increasing housing stress. Those aged 75 or above also faced a substantial deterioration of housing affordability. The corresponding trend was less alarming, but housing stress increased in St. John’s for people between 65 and 74 in the 75th percentile, while it decreased for those aged 75 and above—a trend similar to the NA. The fact that some of these effects for the older age categories are insignificant can also signify that these groups
27 are not homogenous. While housing affordability has deteriorated for some, it has not necessarily been the case for all. The elderly are more likely to own their homes outright, but living at fixed incomes can still make them vulnerable for cost increases. Worth noting is that a large share of the elderly populations may over time develop disabilities, which brings another dimension to housing stress. Results show that housing affordability for a primary household maintainer with a disability is consistently worse than for their counterparts without a disability during the entire period. The trend of an aging population, particularly in Newfoundland, is of concern because the disabled have different housing needs and their housing stress is generally higher than for non-disabled individuals.
FIGURE 4—ABOUT HERE
Educational attainment shows a distinct effect for post-secondary education in St. John’s in comparison to FMM. While university degree improved housing affordability in St. John’s, there was a decline in FMM during the same period. College diploma or trades had a similar pattern in St. John’s, while the effects became insignificant in 2011 in FMM. The benefit of education in St. John’s exceeded the corresponding effects in the NA, which were above that of FMM. Those without education are generally facing higher housing stress than the reference group (who finished high school), but they only show a slight improvement over time. Educational attainment, often regarded as a prerequisite for well-paid employment, is generally associated with lower housing stress. While this appears to be true particularly for university education in St. John’s, the corresponding effects are much lower in FMM. In FMM, college education is associated with a fairly small decrease
28 in housing stress that is inconsistent over time. This provides an indication of the regional labour market differences in the two cities. Major institutions in St. John’s such as the university, hospitals, and the provincial government predominantly employ persons with university education. Meanwhile, a multitude of employment opportunities in FMM, even for a low-skilled labour force, reduces the need for high educational levels in order to access employment with a decent income.
Results show that negative labour market effects can be alleviated by other factors, such as a higher educational level or by increasing the number of household maintainers. Households with two or more household maintainers are generally having a decrease in housing stress, while these effects increase with the level of housing stress when moving from the 50th to the 75th percentiles. Unsurprisingly, one-person households remain generally most afflicted by housing stress. Mobility is similarly associated with relatively high effects, as is immigration, despite the low share of immigrants and non-permanent residents particularly in St. John’s. Housing affordability pressures in FMM has also generated more demand for new housing types such as row houses and apartments or flat in a duplex. These housing types used to be more affordable than the single-detached house, but they are now rapidly becoming more expensive to rent or own. Rapidly expanding labour market in FMM has a higher effect on the housing market and particularly on rental housing because new workers would first look for shelter in the rental market.
29
Conclusion
This study analyzes the changing impacts of household characteristics on housing stress at various points across the affordability spectrum. Labour market, housing market, and socioeconomic factors impacting housing stress highlight increasingly polarized and distinct housing affordability conditions in St. John’s and FMM from that of comparable cities in Canada. Results show that housing tenure has one of the most critical effects on housing stress, with renters and mortgaged homeowners having a very high housing cost to income burden compared to non-mortgaged homeowners. Results also show that these effects are not homogeneous across the housing stress spectrum, with a positive relationship between the magnitude of the effect increasing with the level of housing stress. Quantile regressions shows that housing affordability burden for renters has grown more rapidly in FMM and increasingly so in the upper quartiles of the housing stress distribution over the period. Rental sector in St. John’s was able to absorb some of this pressure due to the existence of a relatively large sector of social housing and accessory apartments in the city. Fort McMurray was less successful in rapidly providing additional rental housing, despite all construction activities in the region. Since 2006, 25% of the housing were built within the last five years in FMM. A high demand combined with housing shortages made rental costs skyrocket across the entire housing affordability spectrum, with consequences for the low-to-mid-income earners who are normally confined to the rental sector. Meanwhile, the rental housing sector also responded to a market demand by developing new high-end executive rental housing in St. John’s, the demand for which evaporated after oil prices dropped. Given the higher mobility of renters, vacancy rates in the rental market
30 are increasing, while the rents particularly in the most sought for market segments still remain high. As a result, the rental market sector, particularly in St. John’s, appears to provide many relatively low quality units, while there is a shortage of reasonably priced decent quality rental housing.
Differences with other comparable Canadian cities are also noticeable in the impact of age groups of first-time buyers, where we see developing an increased association with housing stress in the upper tails of the affordability distribution—a situation which follows an inverse trend in other comparable Canadian cities. Lack of adequate rental housing options and relatively high rental costs may contribute to making some low income earners become homeowners despite high housing stress they are likely to experience, in addition to the particular risk of an economic downturn with decreasing income levels. As housing costs increase, low to moderate income households face growing problems of housing affordability, while low interest rates, relaxed mortgage regulation, and lack of knowledge about real housing costs may create new vulnerabilities for mid-income earners who overspend on housing. The rise in housing prices also prevents some first-time buyers from entering the housing market, which has consequences for household formation and, perhaps, outmigration (Yates 2002). All this has ramifications for the region’s aspirations regarding population growth and retention, particularly for St. John’s, with its aging population.
Present low interest rates may alleviate the housing cost burden of homeowners, but indebtedness places them at risk when the oil boom ends and turns into economic
31 decline with rising unemployment. This is compounded by the fact that the low to moderate income earners tend to carry the highest debt burden in relation to their income (Walks 2013), which makes them most vulnerable for any changes affecting household income level, regardless if it is related to changing amount or types of labour market activities or changes in family composition, or both. When short of cash, homeowners can opt for new debt such as home-equity line of credit by using their homes as collateral. Although mainly spurred by mortgage debt, all debt also contributes to the rapidly increasing indebtedness in Canada. After the recent decline in oil prices, this has led to an increase in number of consumer proposals while residential mortgages in arrears have been increasing with slower pace in various resource regions of Canada.
Inflated housing values during a resource boom can be converted into profits. The housing market provides a means for the diffusion of resource wealth to those who manage to sell their houses at the right time point. However, capital gains on housing values in resource-dependent regions may also evaporate entirely when a resource boom ends. Housing values in St. John’s and FMM may not return to their pre-boom levels, but a price decrease has already taken place, enabling some first-time buyers enter the housing market. This has fuelled the housing market in St. John’s after oil prices dropped in 2014. At the same time, the post-boom housing market can slow down because some homeowners end up with negative equity, making them less inclined to sell their properties and seek new employment elsewhere (Chan 2001). Those who own their homes outright have a much better housing affordability compared to both mortgaged homeowners and renters. However, there is a high likelihood that many of these homeowners are elderly individuals
32 living at fixed incomes. Their housing affordability may deteriorate because of other cost increases such as fuel, or property taxes based on the newly inflated housing values.
Our analysis conveys indications that housing affordability for the elderly is slowly deteriorating. However, the elderly are a heterogeneous group, with a wide range of wealth, housing circumstances and housing needs. Many of the elderly are properly housed. However, some of them live in crowded or otherwise substandard rental units while others remain in single-detached homes because of a lack of affordable alternatives for downsizing. This in turn keeps another home from entering the market and being purchased by a new family (Skaburskis 2002). Aging is also linked to increasing mobility limitations and disability rates which are of concern because few of the existing housing are accessible for disabled individuals. In all, we lack information about the unique housing circumstances and needs of the elderly and disabled.
At last, we believe that policy measures are required to provide housing that is affordable for low to moderate income earners. Initially, there should be an evaluation of how the current housing market meets with the quantitative and qualitative housing needs of the vulnerable segments population identified in this study. While housing policies are frequently regarded as either supply or demand side subsidies, they should also cover quality and cost of existing rental housing stock, establishing minimum quality requirements, and that of always including some accessible housing. On the supply side, road blocks to private rental development could be removed by amending current federal tax provisions and municipal development fees.
33 At the same time, policies should particularly target the provision of non-profit housing either by redevelopment of current housing stock or development of new housing because some households cannot afford to rent in the private market. An additional objective is to protect existing social housing. Therefore, the co-operation between non-profit organizations, developers and different levels of government should be facilitated to create more innovative, and sustainable solutions for affordable housing that is integrated with regional infrastructure such as public transit and various amenities. While low income earners may still require subsidies to manage their non-housing expenses, elevating general income levels requires increase in minimum wage levels, and long-term efforts of generating new employment opportunities that match the skill sets of the local population. A municipal housing advisor could make it easier for newcomers and current residents to find and maintain better positions in the local housing market.
Appendix
TABLES 3, 4, 5, 6, 7 & 8—ABOUT HERE
References
Agnello, L., and L. Schuknecht. 2011. Booms and busts in housing markets:
Determinants and implications. Journal of Housing Economics 20 (3): 171–190. Ainslie, K. 2014. “Dutch disease and the resource curse: Newfoundland and Labrador in
focus.” Geopolitics of Energy no. 36 (1):11–21.
Alessandrini, Diana. “On the Cyclicality of Schooling Decisions: Evidence from
Canadian Data. ” [working paper 16_14, The Rimini Centre of Economic Analysis, Rimini, Italy, 2014].
34 Beaupré, P., P. Turcotte, and A. Milan. 2006.“When Is Junior Moving Out? Transitions
from the Parental Home to Independence.” Canadian Social Trends, 82: 9–15. Bunting, Trudi, Alan Walks, and Pierre Filion. 2004. The uneven geography of housing
affordability stress in Canadian metropolitan areas. Housing Studies 19 (3): 361– 393.
Carver, Humphrey. Houses for Canadians. Toronto: University of Toronto Press, 1948. Chan, S. (2001). Spatial lock-in: Do falling house prices constrain residential mobility?
Journal of Urban Economics, 49 (3): 567–586.
Clark, Warren.2007. “Delayed transitions of young adults.” Canadian Social Trends 84: 14–22.
Canada Mortgage and Housing Corporation [CMHC].2012. “Rental Market Report—St. John’s CMA.”, accessed June 20, 2016,
http://publications.gc.ca/collections/collection_2012/schl-cmhc/NH12-84-2012-eng.pdf.
Emery, JC Herbert, Ana Ferrer, and David Green.2012. “Long-term consequences of natural resource booms for human capital accumulation.” Industrial & Labor
Relations Review, 65 (3): 708–734.
Ennis, Gretchen, Mary Finlayson, and Glen Speering. 2013. “Expecting A Boomtown? Exploring potential Housing—related Impacts of Large Scale Resource
Developments in Darwin.” Human Geographies, 7 (1):33–42.
Federal Reserve Bank of St. Louis.2016. Crude Oil Prices: West Texas Intermediate
(WTI)—Cushing, Oklahoma. Retrieved from
https://fred.stlouisfed.org/series/DCOILWTICO
Gan, Quan, and Robert J. Hill. 2009. “Measuring housing affordability: Looking beyond the median.” Journal of Housing Economics, 18 (2):115–125.
Goldenberg, S. M., J. A. Shoveller, M. Koehoorn, and A. S. Ostry. 2010. “And they call this progress? Consequences for young people of living and working in resource-extraction communities.” Critical Public Health, 20 (2):157–168.
Green, D. A., & Milligan, K.. (2010). The Importance of the Long Form Census to Canada. Canadian Public Policy / Analyse De Politiques, 36(3), 383–388. Hancock, K.E. 1993. ”’Can Pay? Won’t Pay?’ or Economic Principles of 'affordability'.”
Urban Studies 30 (1): 127–145.
Hao, Lingxin, and Daniel Q. Naiman. Quantile Regression. Quantitative Applications in
the Social Sciences ; Thousand Oaks, CA, USA: SAGE Publications (US),ISBN
1-4129-2628-9.
Henley, Andrew. 1998. “Residential Mobility, Housing Equity and the Labour Market.”
35 Heywood, A.2011. “The end of the affair: implications of declining homeownership.”
London: The Smith Institute.
Hiebert, D. 2009. “Newcomers in the Canadian housing market: a longitudinal study, 2001–2005.” The Canadian Geographer / Le Géographe canadien, 53(3): 268– 287.
Hulchanski, J. D. 1995. “The Concept of Housing Affordability - 6 Contemporary Uses of the Uses of the Housing Expenditure-to-Income Ratio.” Housing Studies, 10 (4):471–491.
Hulchanski, J. D. 2004. “A Tale of Two Canadas: Homeowners Getting Richer, Renters Getting Poorer.” In Finding Room—Policy Options for a Canadian Rental
Housing Strategy, edited by J. D.Hulchanski and Michael Shapcott, 81–88.
Toronto: Centre for Urban and Community Studies, University of Toronto. Hulchanski, J.D. & Michalski, J.H. 1994. “How Households Obtain Resources to Meet
their Needs: The Shifting Mix of Cash and Non-Cash Sources.” Toronto: Ontario Human Rights Commission.
Hulchanski, David, Murdie, Robert, Walks, Alan, & Bourne, Larry. 2013. Average Individual Income 2010: National Household Survey Versus Taxfiler Data.
Neighbourhood Change Research Partnership. University of Toronto. Retrieved
from http://neighbourhoodchange.ca/documents/2014/04/nhs-oped-data-tables.pdf Keogh, S. B. 2015. “Planning for growth in a natural resource boomtown: challenges for
urban planners in Fort McMurray, Alberta.” Urban Geography, 36 (8): 1169-196. Kesteloot, C. 1994. “Three Levels of Sociospatial Polarization in Brussels.” Built
Environment, 20 (3):204–217.
Kirkpatrick, S.I., and V. Tarasuk. 2007.”Adequacy of Food Spending Is Related to
Housing Expenditures among Lower-income Canadian Households.” Public Health
Nutrition, 10 (12): 1464-473.
Koenker, R., and G. Bassett Jr. 1978. ”Regression Quantiles.” Econometrica, 46 (1): 33– 50.
Lamont, Chris. 2008. “Housing Affordability Crisis: Fact or Fiction?” Australian
Economic Review, 41 (2):194–199.
Lawrie, M., Tonts, M., & Plummer, P. (2011). Boomtowns, Resource Dependence and Socioeconomic Well-being. Australian Geographer, 42, 139–164.
Leiter, Valerie, and Alexandra Waugh.2009. “Moving Out: Residential Independence Among Young Adults With Disabilities and the Role of Families.” Marriage &
Family Review 45 (5): 519-37.
Lerman, D. L., and W. J. Reeder. 1987. “The Affordability of Adequate Housing.” Areuea
Journal-Journal of the American Real Estate & Urban Economics Association, 15
36 Leung, C. K. Y., S. Shi, and E. C. Ho Tang. 2013. “Commodity house prices.” Regional
Science and Urban Economics, 43 (6):875–887.
Ley, D. 2007. “Countervailing Immigration and Domestic Migration in Gateway Cities: Australian and Canadian Variations on an American Theme.” Economic
Geography, 83 (3): 231–254.
Lloyd, Greg, and David Newlands.1990. “The interaction of housing and labour markets: An Aberdeen case study.” Land Development Studies, 7 (1): 31–40.
Marks, D. 1984. “Housing Affordability and Rent Regulation” Toronto: Ontario Commission of Inquiry into Residential
Tenancies, Research Study No. 8.
Matlack, J. L. & Vigdor, J. L. (2008). Do rising tides lift all prices? Income inequality and housing affordability. Journal of Housing Economics, 17, 212–224.
Moore, Eric, and Andrejs Skaburskis. 2004. “Canada’s increasing housing affordability burdens.” Housing Studies, 19 (3): 395–413.
Moos, M., and A. Skaburskis. 2010. “The globalization of urban housing markets: Immigration and changing housing demand in Vancouver.” Urban Geography, 31 (6):724–749.
Natural Resources Canada. 2011. Canadian Crude Oil, Natural Gas and Petroleum Products: Review of 2009 & Outlook to 2030. Retrieved at:
http://www.nrcan.gc.ca/sites/www.nrcan.gc.ca/files/energy/pdf/eneene/sources/cru bru/revrev/pdf/revrev-09-eng.pdf.
Nepal, Binod, Robert Tanton, and Ann Harding. 2010. “Measuring Housing Stress: How Much do Definitions Matter?” Urban Policy and Research, 28 (2):211–224. O’Brien, Robert M.2007. “A caution regarding rules of thumb for variance inflation
factors.” Quality & Quantity, 41 (5): 673–690.
O’Dell, William, Smith, Marc T., and White, Douglas. 2004. “Weaknesses in current measures of housing needs.” Housing and Society, 31 (1):29–40.
Okkola, Sinikka and Brunelle, Cedric. 2017. Has the oil boom generated new problems of housing affordability in resource-driven agglomerations in Canada? A case study of St. John’s, Saskatoon, Calgary, Edmonton, and Fort McMurray, 1991– 2011, Urban Geography, 1–29.
O’Neill, Tracey, Clare Jinks, and Anne Squire.2006. “Heating Is More Important Than Food.” Journal of Housing For the Elderly, 20 (3): 95–108.
Randall, James E., and R. Geoff Ironside. 1996. “Communities on the edge: An economic geography of resource-dependent communities in Canada.” Canadian
37 Rea, Willa, Jennifer Yuen, John Engeland, and Roberto Figueroa.2008. “The dynamics of
housing affordability.” Perspectives on Labour and Income, 20 (1): 37–48,2.
Rowley, S., Ong, R., & Haffner, M. 2015. “Bridging the Gap between Housing Stress and Financial Stress: The Case of Australia.” Housing Studies, 30 (3), 473–490. Ryser, L., and G. Halseth. 2011. “Housing costs in an oil and gas boomtown: Issues for
low-income senior women living alone.” Journal of Housing for the Elderly, 25 (3):306–325.
Sheppard, Mary Clark, ed. Oil Sands Scientist: The Letters of Karl A. Clark, 1920–1949. University of Alberta, 1989.
Skaburskis, Andrejs.2002. “Generational Differences and Future Housing Markets.” The
Canadian Journal of Regional Science, 25 (3): 377–403.
Skaburskis, Andrejs and Markus Moos. 2010. “The Economics of Urban Land.” In
Canadian Cities in Transition, edited by Trudi Bunting, Pierre Filion and Ryan
Walker. Toronto: Oxford University Press.
Smith, Stanleyk., Stefan Rayer, Eleanor Smith, Zhenglian Wang, and Yi Zeng. 2012. “Population Aging, Disability and Housing Accessibility: Implications for Sub-national Areas in the United States.” Housing Studies, 27 (2): 252-66.
Statistics Canada. 2016. Census of Population (1991, 1996, 2001, 2006)—Long Form 2b; and 2011 National Household Survey (NHS) (master files). Statistics Canada (producer). Using University of New Brunswick Research Data Centre (UNB-RDC) branch at Memorial University of Newfoundland (MUN-(UNB-RDC) (distributor). Stone, Michael E. 1990. “One-third of a Nation: A New Look at Housing Affordability in
America.” Washington DC: Economic Policy Institute.
Stone, Michael E. 2006. “What is housing affordability? The case for the residual income approach.” Housing Policy Debate, 17 (1):151-84.
Thalmann, Philippe. 1999. “Identifying households which need housing assistance.”
Urban Studies, 36 (11):1933-47.
Thalmann, Philippe. 2003. “‘House poor’ or simply ‘poor’?” Journal of Housing
Economics, 12 (4): 291–317.
Veall, M. R. (2010). 2B or Not 2B? What Should Have Happened with the Canadian Long Form Census? What Should Happen Now?. Canadian Public Policy, 36, 395–399.
Walks, R. Alan. 2001.”The Social Ecology of the Post-Fordist/Global City? Economic Restructuring and Socio-Spatial Polarisation in the Toronto Urban Region.”
Urban Studies, 38 (3): 407-47.
Walks, Alan. 2013. “Mapping the Urban Debtscape: The Geography of Household Debt in Canadian Cities.” Urban Geography , 34 (2):153-87.
38 Walks, A. 2014. “From Financialization to Sociospatial Polarization of the City?
Evidence from Canada.” Economic Geography, 90 (1): 33–66.
Weeks, Lori E, and Kristal Leblanc.2010. “Housing Concerns of Vulnerable Older Canadians.” Canadian Journal on Aging, 29 (3): 333-47.
Yates, Judith. 2002. “Housing Implications of Social, Spatial and Structural Change.”
Housing Studies,17 (4):581–618.
Yates, Judith. 2008. Australia’s Housing Affordability Crisis. Australian Economic