HAL Id: tel-01515691
https://pastel.archives-ouvertes.fr/tel-01515691
Submitted on 28 Apr 2017HAL is a multi-disciplinary open access archive for the deposit and dissemination of sci-entific research documents, whether they are pub-lished or not. The documents may come from teaching and research institutions in France or abroad, or from public or private research centers.
L’archive ouverte pluridisciplinaire HAL, est destinée au dépôt et à la diffusion de documents scientifiques de niveau recherche, publiés ou non, émanant des établissements d’enseignement et de recherche français ou étrangers, des laboratoires publics ou privés.
transition and application for plasma assisted
combustion.
Sergey Shcherbanev
To cite this version:
Sergey Shcherbanev. Filamentary nanosecond surface dielectric barrier discharge at elevated pressures. Streamer-to-filamentary transition and application for plasma assisted combustion.. Plasma Physics [physics.plasm-ph]. Université Paris Saclay (COmUE), 2016. English. �NNT : 2016SACLX113�. �tel-01515691�
NNT : 2016SACLX113
THESE DE DOCTORAT DE
L’UNIVERSITE PARIS-SACLAY PREPAREE A
L’ECOLE NORMALE SUPERIEURE PARIS-SACLAY
ÉCOLE DOCTORALE № 572 Ondes et Matière
Spécialité de doctorat : Physiques des Plasmas Par
Sergey Shcherbanev
Décharge Filamentaire Nanoseconde en Surface à Barrière Diélectrique. Transition Streamer-Filamentaire et Application pour Combustion Assistée par Plasma
Thèse présentée et soutenue à l’École Polytechnique, le 16 décembre 2016 : Composition du Jury :
M Christophe LAUX Ecole Centrale, Paris, Président du Jury
Mme Svetlana STARIKOVSKAIA Ecole Polytechnique, Paris, Directrice de thèse M Pierre TARDIVEAU Université Paris-Sud, Paris, Rapporteur
M Epaminondas MASTORAKOS Cambridge University, UK, Rapporteur M Pere ROCA i CABARROCAS Ecole Polytechnique, Paris, Examinateur M Guillaume VANHOVE Université de Lille 1, Lille, Examinateur
M Marc BELLENOUE PPRIME, Poitiers, Examinateur
Contents
Acknowledgements 7
Abstract 9
1 Literature review 11
1.1 Surface dielectric barrier discharge in atmospheric air . . . 11
1.2 Contraction of surface dielectric barrier discharge . . . 21
1.3 Plasma–assisted ignition/combustion at elevated gas densities . . . . 27
1.4 Plasma–assisted ignition with surface DBDs . . . 35
2 Problem formulation 40 3 Experimental equipment and measuring methods 42 3.1 Surface dielectric barrier discharge cells . . . 42
3.1.1 Electrode configurations . . . 42
3.1.2 High-pressure discharge cell . . . 44
3.1.3 High-pressure high-temperature plasma/combustion setup . . 45
3.1.4 General scheme of the experimental setup and synchronization system . . . 47
3.2 Experimental techniques . . . 49
3.2.1 Voltage, current and energy deposition measurements . . . 49
3.2.2 ICCD imaging of the discharge and flame propagation . . . 52
3.2.3 Optical emission spectroscopy . . . 52
3.2.4 Schlieren and shadowgraphy methods . . . 53
4 Nanosecond surface dielectric barrier discharge at atmospheric gas density 55 4.1 nSDBD in classical air-flow control configuration. General character-istics and morphology . . . 56
4.3 Cathode-directed (positive polarity) streamer. . . 72
4.4 Spatial fine structure of the streamers . . . 77
4.5 Return stroke of nSDBD . . . 83
4.5.1 Results of numerical modeling . . . 83
4.5.2 Experimental observations . . . 87
4.6 Energy release in the discharge . . . 88
4.6.1 Spatial time-resolved temperature distribution . . . 89
4.6.2 Energy release in the afterglow . . . 91
4.7 nSDBD in different electrode configurations . . . 94
4.8 Conclusion . . . 96
5 Nanosecond SDBD at elevated gas densities 98 5.1 Streamer-to-Filamentary transition of nSDBD at high pressures . . . 99
5.1.1 nSDBD at elevated pressures in air . . . 99
5.1.2 The behavior of the nSDBD in different gas mixtures . . . 103
5.2 Emission spectroscopy of the nSDBD at elevated pressures . . . 112
5.2.1 Analysis of the emission intensity and electrical current . . . . 112
5.2.2 Emission spectra of streamer and filamentary nSDBD . . . 117
5.2.3 Spatial spectral structure of the filaments . . . 124
5.2.4 O- and H- atomic line broadening . . . 131
5.2.5 Nature of cw emission and electron density . . . 136
5.2.6 The mechanisms of contraction and development of filamen-tary nSDBD . . . 141
5.3 Schlieren spectroscopy of the nSDBD at elevated pressures . . . 144
5.3.1 Shock wave propagation produced by nSDBD at elevated pres-sure . . . 144
5.3.2 Pressure in the front of compression wave . . . 149
5.3.3 Relaxation of the heated near-electrode region . . . 154
5.4 Conclusion . . . 157
6 Plasma-assisted ignition of H2:air mixtures with nSDBD 159 6.1 Streamer–to–filament transition of nSDBD in H2:air mixture . . . 160
6.2 Initiation of combustion in the afterglow of nSDBD in H2:air mixture at elevated pressures . . . 163
6.2.1 Ignition pattern . . . 163
6.2.2 Temperature analysis . . . 165
6.2.3 Three regimes of flame initiation . . . 168
6.3 Propagation of combustion wave . . . 172
Contents
6.4.1 Deposited energy as a function of applied voltage . . . 174 6.4.2 Measurements of MIE . . . 175 6.5 Numerical calculations and analysis of specific deposited energy . . . 177 6.6 Conclusion . . . 181
7 General conclusions 182
7.1 Contributions of the present work . . . 182 7.2 Perspectives and future work . . . 185
Appendices 187
List of Publications . . . 187
List of Figures 188
Acknowledgements
I would like to express my sincere appreciation to my supervisor Svetlana Starikovskaia for her guidance and encouragement, without which this work would not be possible. I am truly thankful for her unwavering support. During the last three years she was always very patient and consistent during our discussions. She taught me a great deal as in the field of experimental physics, so how to properly present my results. I am extremely grateful to Svetlana for the opportunities to participate in a variety of international conferences around the world. Finally, I am sincerely grateful for the fact that throughout our collaboration, she treated me like a full-fledged colleague trusting me and relying on me.
I would also like to express my deepest gratitude and respect to Nikolay Popov (Moscow State University) for his productive and fruitful discussions. Thanks to these discussions I improved my knowledge in plasma physics, physics of combustion and hydrodynamics.
I thank my co–authors and collaborators: Mohamed Boumehdi, Guillaume Van-hove and Pascale Desgroux from University Lille 1 (laboratory PC2A), for coopera-tion of plasma–assisted combuscoopera-tion in RCM with nanosecond surface DBD; Viktor Soloviev (Moscow Institute of Physics and Technology) for the interacting discus-sions of 2D numerical simulation of nSDBD; Sergey Pancheshnyi and Lorenz G. Hermann (ABB Switzerland) for interesting experiment and common publication; all the interns, master and PhD students I worked with: Issatay Nadinov, Andrey Khomenko, Yifei Zhu, Brian Baron, Nicolas Couchot, Alexandre De-Martino, James Williams.
I am really thankful to Dr. Pierre Tardiveau from Laboratoire de Physique des Gaz et des Plasmas of University Paris Sud and to Prof. Epaminondas Mastorakos from Hopkinson Lab of Department of Engineering, University of Cambridge, who accepted to be reviewers of my Thesis; I would like also to thank all members of my Jury : Prof. Christophe Laux from Ecole Central Paris, Prof. Jean-Michel Pouvesle from University of Orleans, Dr. Guillaume Vanhove from University Lille 1, Prof. Marc Bellenoue from Ecole Nationale Superieure de Mecanique et d’Aerotechnique
(Poitiers), Prof. Pere Roca i Cabarrocas form Ecole Polytechnique (LPICM). Je souhaiterais tout particuli`erement remercier M. Ali Mahjoub ing´enieur de recherche. Sans son aide, pour le d´eveloppement de nouveaux composants travailler sur mon projet aurait ´et´e impossible. Je lui suis ´egalement extrˆemement recon-naissant pour son soutien dans des nombreuses difficult´es administratives que j’ai rencontr´e lors de mes ´etudes doctorales. De plus, grˆace aux trois ann´ees durant lesquelles nous avons collabor´es, je consid`ere Ali comme un ami et tiens `a le re-mercier.
My appreciation also extends to other laboratory colleagues Philippe Auvray for technical advices, Bruno Dufour for mechanical assistance, Olivier Guaitella for his help and advices, Pascal Chabert for his encouragements and valuable recommen-dations.
I wish to thank my colleague and friend Nikita Lepikhin. His stay in the lab certainly brightened everyday life. Some ideas generated during our discussions were realized during the experiments and during the data treatment.
I am very grateful to the woman I love, Olga Permiakova, who was always there. Her support and patience never left me during my emotional highs and lows. Her help in page–making of my work, as well as her help in writing some programs greatly helped me in the processing and presentation of my results.
I would love to thank my family: father, brother and my Mom. Her sincere faith in me never let me down. For all of the times I never said thank you because I thought you knew, I thank you now more than ever, Mom.
Abstract
Non-equilibrium plasma is one of the most attractive and promising tool for many plasma-assisted applications. Production of active species (excited species, radicals, high energetic photons covering UV and IR spectral range) is important for gas pollution control, surface treatment, plasma actuators for aerodynamics applica-tion, biomedical applications and more recently the field of plasma medicine. For atmospheric and elevated gas densities the mainstream of the non-thermal plasma applications is the ignition of combustible mixtures or so-called Plasma-Assisted Ignition (PAI).
Surface dielectric barrier discharges (SDBDs), widely used for aerodynamic flow control, were recently suggested as distributed initiators of combustion in different systems. A principal possibility of using the SDBD igniters at as high pressure as tens of bars has been demonstrated during the last 4-5 years. At the moment of the beginning of the thesis, the set of experimental data on the discharge and of ignition of fuels with SDBD was insufficient for detailed analysis. Therefore, the experimental study of the surface DBD at atmospheric and elevated gas densities and the study of flame initiation with nanosecond SDBD were the object of the presented thesis.
The results in the Thesis are presented in three parts. In the first part the nSDBD in a single shot regime at atmospheric air is investigated. The analysis of energy deposition, discharge current, intensity distribution and consequent energy release is performed. The positive and negative polarity pulses are used to produce surface discharge. The physics of anode and cathode-directed streamers is discussed. For both polarities of the applied pulses the electron density and reduced electric field are estimated and compared with calculations and/or 2D modeling results.
The second part is devoted to the study of nSDBD at elevated pressures, up to 12 bar, in different gas mixtures (N2, air, N2:CH4, N2:H2, Ar:O2, etc.). Two
mor-phologically different forms of the nSDBD are considered: a "classical" streamer DBD at relatively low pressures and voltages, and a filamentary DBD at high pres-sures and/or voltages. The emission spectroscopy is used to obtain quantitative
data about the discharge at high pressures (1–12 bar). The possible nature of the discharge filamentation is described.
Finally, the third part describes the experiments of plasma-assisted ignition with nanosecond SDBD at elevated pressures. The discharge morphology in lean com-bustible (H2:air) mixtures and following ignition of the mixtures are studied. The
comparison of ignition by filamentary and streamer discharge at the pressures 1– 6 bar is performed. Kinetic modeling of plasma assisted ignition for the electric fields typical for nSDBD, E/N = 100 − 200 Td is used for analysis of experimental data. Complex study of the discharges at atmospheric pressure, discharge at high pressures and ignition allow detailed description of the high-pressure, distributed in space ignition by non–equilibrium plasma.
Chapter 1
Literature review
1.1
Surface dielectric barrier discharge in atmospheric
air
Over the last 15 years, increasing interest to physics of surface dielectric barrier discharge (SDBD) in air at atmospheric pressure has been observed. Applications of strong research interest include plasma-based flight control, namely generation of lift and turbulization of flow around the airfoil [1–4], plasma assisted combustion, where generation of radicals and fast heat release due to relaxation of highly excited levels decrease dramatically ignition delay time [5–8] and also flame stabilization with surface or volumetric DBDs [9]. Both periodic-pulse excitation and sinusoidal power of 1 − 10 kHz frequency are typically used for flow control and/or combustion experiments. In periodic mode, a series of microdischarges of 20 − 50 ns duration is observed at increasing of absolute value of voltage. These microdischarges are separated by 1 − 10 µs periods of plasma decay.
SDBD excited by a single pulse of a few tens of nanoseconds is an efficient system to study physics of surface DBDs because only one discharge "plane", consisting on parallel propagating streamers, is generated over the pulse time. The discharge propagation along the non–charged surface at the leading front of the pulse simplifies the interpretation of experimental data. Moreover the nSDBD in a single shot regime produces a discharge simultaneously starting from the edge of HV electrode, whereas SDBD initiated by sinusoidal applied voltage produces a few streamers during each half–period and starting randomly from one to another discharge initiation.
Figure 1.1: Images of surface nanosecond barrier discharge development taken with nanosecond time resolution. Camera gate is 0.5 ns. Voltage on the HV electrode is 14 kV. The half-width time of pulse is τ1/2= 25 ns,
P = 1 bar. Cathode-directed streamer discharge [10].
One of the most distinctive features of nSDBD is the stability at high pressures (repeatability from one to another experiment) and operation at high values of reduced electric field values E/N ∼ 102− 103 Td, where 1 Td=10−17
V/cm2. Under
these conditions, a significant fraction of energy deposited into the discharge goes to electronic excitation of atoms, molecules and dissociation of molecules by direct electron impact. As a result, efficient generation of active species takes place.
The detailed morphology of the nSDBD was for the first time studied in [10]. It was also shown that the dominant effect of nSDBD plasma actuators on the flow is due to the fast localized heat release. The compression waves in quiescent air gener-ated by localized heating during the nanosecond pulse were detected experimentally. The typical images of the nSDBD for positive polarity of applied pulses are demon-strated in figure 1.1. The pulse width was about 25 ns. The discharge propagates as two successive ionization fronts, developing on the leading front and on the trailing edge of the high-voltage pulse. In the first ionization front, hereinafter we will call it a first stroke, and the second ionization front, the second stroke, the polarity of the high-voltage electrode is positive related to the surface of the dielectric. The reason is that, during the first stroke, a surface of the dielectric is charging and the poten-tial of the surface finally becomes a fraction of the voltage amplitude. Decrease of voltage on the trailing edge causes a change of the sign of the difference of potentials between the electrode and the surface of the dielectric.
It was demonstrated in [11] that both first and second stroke of a single voltage pulse produce a current peak. Each of the peaks leads to the production of the
pres-1.1. Surface dielectric barrier discharge in atmospheric air
a)
b)
c)
Figure 1.2: (a) Plasma formation and propagation in the rising and trail-ing edge of HV pulse; (b) pressure waves propagation for different pulse widths at +10 kV amplitude (scale in mm, images taken in 10 µs, PW stands for pulse width) [11]; (c) predicted reduced electric field and elec-tron density distributions in a positive polarity discharge [12].
sure wave propagating in the medium. The results also indicate that the intensity of the pressure wave can be changed by the amplitude of applied pulse, by the rise time of the leading edge or by the period of HV pulses. The waves corresponding to the first and second strokes are presented in figures 1.2. The pressure waves are different for the different pulse widths. For a low pulse width, a single trace is observed. This trace correspond to the superposition of the waves produced by first and the second stroke of the applied pulse. By increasing the pulse width, two waves separated in time and become visible in the shadowgraph image. Both traces propagate with approximately same velocities close to sound speed 340 m/s. However, as it was demonstrated in [10], the slightly supersonic velocities of compression waves have been detected for different width of applied pulses 7 and 50 ns, 420 and 480 m/s respectively.
More detailed morphology and energy release study is described by Nudnova et
al [13]. It was shown that energy deposition does not significantly depend on the
polarity of applied pulses. At the same time, the discharge structure significantly depends on the polarity on exposed electrode. The negative polarity discharge is
more uniform than positive polarity discharge in the transverse direction. It was also mentioned that the maximum electric field is higher for positive polarity discharge. Whereas, the gas heating is higher (at the small time periods up to 1 µs) for negative polarity discharge. The velocities of the discharge propagation were also analyzed. It was assumed that due to higher values of propagation velocity V and radius of the streamer head R for positive polarity streamers, the time of the residence of the discharge electrons in the regions with high E/N values is lower. Therefore, the specific energy that goes to the heat release on the considered time scale is higher for negative polarity pulses.
Until recently, the reduced electric field distribution and electron density in the plasma channel have been studied only numerically. One or two dimensional models require experimental data of integral discharge parameters such as: energy depo-sition, current, applied voltage pulse shape, discharge propagation velocity. These parameters were uploaded into computational model and then, the calculations of reduced electric field and/or electric density have been performed. For volumet-ric and surface DBD, an interesting analysis was done by the team of professor Adamovich et al [12]. The physics of the discharge was analyzed on the basis of experimental results. The self-similar, local ionization kinetic model predicting en-ergy coupling to the plasma in the surface ionization wave discharge produced by a nanosecond voltage pulse was developed. The model predicts the key discharge parameters such as: propagation velocity, electric field, electron density and the thickness of the plasma layer. The results presented in [12] describe pretty well the discharge parameters for volumetric discharge and also satisfactorily coincides with more advanced simulation models for SDBD configurations [14–17]. The results of surface DBD calculations are shown in figure 1.2(c).
The in situ electric field and electron density measurements is a challenging task for nSDBD discharge configuration. The fineness of the plasma layer and presence of the dielectric surface in close proximity of the discharge region complicates the diagnostics of SDBD discharge type. It is complicated to use the laser beam as a diagnostic probe. In spite of the complexity of the discharge geometry some experimental data concerning charge and field distribution exist. Leonov et al [18] has measured the surface charge and surface potential with the sequences of charge sensors (Kelvin probes) implemented into the dielectric layer of SDBD. It was done for pulse periodic microsecond discharge with positive and negative bias and polarity of applied pulses. The similar diagnostics has been used for the sinusoidal applied voltage in [2]. One more method of diagnostics is based on the Pockels effect, that is on the dependence of optical birefringence on the electric field [19]. This method is used to perform quantitative measurements of surface charge density potential distribution in both volumetric DBD [20] and surface DBD [21] arrangements.
1.1. Surface dielectric barrier discharge in atmospheric air
a)
b)
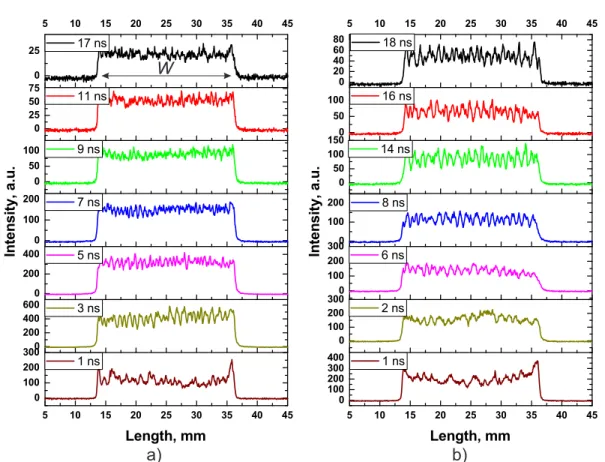
(1) (2) (3) (1) (2) (3)Figure 1.3: (a) Electrode arrangements for investigated barrier discharges (BD); (b) Spatio-temporal distributions of the discharge luminosity of FNS and SPS in asymmetric BD with metal cathode, in symmetric BD and in CBD. Positions of the electrode tips are denoted by the black lines [22].
Both volume and surface DBDs are spatially distributed systems and some spe-cial efforts are needed to measure or at least estimate the electric field in the discharge gap. The analysis of the spatial intensity of the first negative (FNS) (N+2(B2Σ+
(SPS) (N2(C3Πu)ν‘=0 – N2(B3Πg)ν“=0, λ = 337.1 nm) for three different
arrange-ments of electrode system was performed in [22]. The electrode systems are shown in figure 1.3(a):asymetric BD, symmetric BD, coplanar BD.
The results of spatio-temporal analysis of intensities of SPS and FNS [22] show that the mechanisms of electrical breakdown for the three BDs are quantitatively similar. The discharge consist of three pases: (i) the pre–breakdown Townsend phase; (ii) the phase of ionization wave propagation; and (iii) the decay phase. The Townsend phase demonstrate itself as a weak continuously growing glow in front of the anode. This glow is clearly seen on the plots of SPS in figure 1.3(b) for t < 15 ns. In the first pre–breakdown phase the electric field is quasi-stationary, the electron density and thus the intensity increases exponentially in time due to the electron avalanches. The accumulated discharge leads to the distortion of the electric field and formation of cathode-directed ionization wave (CDIW). In the case of the coplanar discharge the CDIW is accompanied by another ionization wave propagating over the anode surface in the opposite direction. Both ionization waves gradually slow down and decay outside the inter–electrode region. The thickness of the cathode layer for the asymmetric BD was estimated from the experiment and was found to be about 30 µm. This value correlates with the simulation results of [16].
Another effort of the resolution of the surface discharge spatial structure was done in [23]. The intensity analysis on the different distances from the dielectric surface has been performed for emission of the SPS and the FNS. The spatial anal-ysis of SDBD fine structure showed that the maximum intensity for both polarities of applied pulses correspond to the region of the discharge front at the distance a few hundreds of microns above dielectric layer. When approaching to the dielectric surface, intensity decreases. The results of the work [23] is the only set of exper-imental results of intensity analysis of SDBD microdischarges. The discharge was initiated with alternating voltage with a frequency 5-14 kHz.
In the quasi–uniform discharge where FNS and SPS emission goes from the same discharge area, the reduced electric field strength can be determined from the intensity ratio I391/I337 or I391/I394. A technique of E/N measurement is described
in [24,25]. This method is widely used in the volumetric discharge at low pressures. However for more complex structures of the discharge this method can give unreliable values of E/N. For example, Kosarev et al [5] measured the E/N in nSDBD at different gas pressures (1-5 bar). The reduced electric field for considered condition was in the range 350 − 600 Td. Later, it was demonstrated from the experimental results and from 2D modeling that the nSDBD is highly nonuniform and that the methodic of E/N measurement with intensity ratio of SPS and FNS cannot be applied for sliding discharge [26].
1.1. Surface dielectric barrier discharge in atmospheric air
Figure 1.4: Calculated isolines of E/N: (a) negative polarity discharge, U = −24 kV; (b) positive polarity discharge, U = +24 kV [26].
In the nSDBD, the electric field and electron density change significantly in the normal to dielectric surface direction. Figure 1.4 demonstrates the E/N isolines calculated with 2D simulation model of Dr. Soloviev in the work [26]. The difference of isolines morphology for positive and negative streamers is that for positive polarity streamer the "gap" of rather high E/N can be clearly seen between the streamer body and the dielectric surface. This "gap" is formed because the charge surplus concentrates near the surface. Indeed, this gap is also present in negative polarity streamer. But comparing to positive streamer the characteristic thickness of this gap is an order of magnitude less than for positive polarity streamer. Paper [26]
presents the detailed analysis of the electron density, intensities on λ = 337.1 and λ = 391.4 nm, and E/N distribution over the plasma layer thickness.
The direct comparison of calculated 2D plots with experimental data is not possi-ble, so the authors [26] suggested a following scheme: 2D distribution of the electric field and of the SPS were calculated and considered as input data for comparison. The 2D distribution of the FNS was calculated from known E/N and I337 for any
point in space and time [26, 27]. Further, the emission intensities I337 and I391 were
integrated in the direction perpendicular to the dielectric surface, to imitate the data collection in the experiments.
The schematic representation of experimental results acquisition is given in fig-ure 1.5(a). The obtained signal is the integrated signal over the discharge thick-ness. The comparison for the positive and negative polarity streamers is shown in figure 1.5(b). Two dashed rectangles demonstrate the calculated intensity ratio R391/337 for all possible set of parameters (x, t) except the discharge front. Two
pairs of dashed horizontal lines correspond to the range of E/N values measured experimentally with the method described in [25]. From figure 1.5(b) it can be concluded that for the negative polarity streamer numerical simulations and exper-imental results are in a good agreement. However, for positive polarity discharge no correlation between theoretical and experimental results is observed. The au-thors [26] analysed 3D effect, namely the fact that in the modeling the nSDBD is a uniform layer in z–direction (figure 1.5(a)), while in reality it is a set of separated streamers, well–pronounced for positive polarity and relatively diffuse for negative polarity. Nevertheless, the suggested idea was not able to explain the observed difference between the experiment and the numerical modelling.
Additional information about spatial distribution of plasma parameters in the non-uniform discharges can be obtained from the analysis of the work of numerical modeling [15,17,27–30]. All the works present the results of numerical simulation of SDBD in a flat (air–flow) configuration. The modeling is performed in 2D-geometry similar to the results presented in figure 1.4.
Numerical modeling of parameters and dynamics of the surface discharge is usu-ally based on the transport equations for the charged species and Poisson’s equation for potential of self-consistent electric field in 2D geometry (fluid model). The de-tailed modeling of the surface DBDs using this approach is presented in publications of a few groups: Center of Plasma Physics and Applications in Toulouse [31–33], Moscow Institute of Physics and Technology [14, 15, 27], and Princeton Univer-sity [28, 34, 35]. The majority of these papers consider the SDBD modeling for constant, linear or sinusoidal applied voltage waveform, and only [15, 26, 27, 33, 36] deal with driven voltages in the form of few tens nanosecond pulse. In general, the results of modeling are in good qualitative correlation with available
experi-1.1. Surface dielectric barrier discharge in atmospheric air
a) b)
Figure 1.5: (a)Scheme of data collection in the experimental procedure and integration of the numerical result. The window marked in red cor-responds to the region of integration; (b) Comparison of experimental and theoretical results for different polarities of applied pulses [26].
mental data. The calculations are time-consuming, and so a comparison of models suggested by different authors is hindered. A few significant distinctions can be mentioned here. For positive polarity discharges, the pre–ionization of gas from the discharge region is important. Calculations without UV pionization [31–33] re-sult in shorter streamer length and modified spatial distribution of charged species. For negative polarity discharges, the results of calculations are strongly influenced by boundary conditions on electron density on the surface of the dielectric. If the boundary condition for electrons on the dielectric surface is set in the form of equaliz-ing their fluxes in hydrodynamic and kinetic approach [14], then a thin high positive ion density and high-electric-field layer is created above the dielectric surface. For simplified boundary condition like an approximation of instantaneous electron at-tachment to the dielectric surface resulting in ne=0 the near–surface layer is not
created. For this condition the numerical modeling does not predict a high electric field observed in experiment [26]. So, the experiment [26] implicitly confirms the validity of a boundary condition, proposed in [14] and not a simplified version [37], confirming that even non-direct comparison of the results of calculation with the experiments provides extremely important information for further development of discharge models.
The important issue is that the positive and negative polarity nSDBDs differ significantly. According to [38–40], in SDBD flow control problem the most signifi-cant effect is generated mainly during the negative half-period of AC voltage. It was
Figure 1.6: Profiles of discharge parameters along the line A–B calculated with fluid and hybrid models. (a) and (b) positive polarity streamer, 3 ns; (c) and (d) negative polarity streamer, 6 ns [41].
reported [6,7] that initiation of combustion of hydrocarbons is easier when acting by a negative polarity nanosecond pulse. A principal difference between a volumetric streamer discharge and surface dielectric barrier discharge modeling is that the fine computational grid should be used not only on the head of the streamer but in the entire zone along the dielectric. For atmospheric air the grid cell size should be not greater than 1 − 2 µm to resolve the aforementioned thin near-surface layers in the discharge structure. Positive polarity discharge typically propagates at long distances, as a result, the time consuming calculations in [15] with a mentioned fine grid were able to simulate only the discharge at the leading front of the pulse; the trailing edge was not modeled.
One of the first modeling of the nanosecond surface discharge, carried out by Boeuf [33] for the SDBD driven by positive 35 ns voltage pulse of 14 kV amplitude succeeded using an order of magnitude greater grid cell size (18.75 µm). Because of such a rough grid these calculations did not resolve a thin discharge structure and it is not clear how accurate the obtained results are, both because of grid size and not–accounted for air photo-ionization by UV–radiation from discharge region
1.2. Contraction of surface dielectric barrier discharge
mentioned above.
A comprehensive numerical modeling of the SDBD driven by both positive and negative voltage nanosecond pulse has been fulfilled recently [41] using both conven-tional fluid model and combined fluid-Monte-Carlo model with kinetic Monte-Carlo description of high energy secondary electrons. Babaeva and Naidis [41] present the results of comparative numerical modeling with 2D fluid model and fluid-EMCS hybrid model. The results are summarized in figure 1.6. It was also demonstrated like in aforementioned works, that for positive polarity streamers, the intense sheath region is formed near the surface. This sheath is responsible for high value of E/N near the dielectric surface. It was demonstrated that the negative polarity streamers have a more diffuse structure with a lower E/N in the discharge front than the pos-itive streamers. It was found that the effect of secondary electron emission induced by photons can be neglected for both positive and negative polarities of applied pulses. However, for higher values of secondary emission coefficients for photons, the influence of photoemission can be essential.
Unfortunately, the obtained results refer only to the leading front of the voltage pulse and do not describe the discharge transformation at the trailing edge of the pulse. Simulations presented both in [33] and [41] were performed without binding to experimental data and analysis how the obtained results are close to observed ones. Thus, despite an intense and well thought numerical modeling performed by different authors we still have some ambiguous treatments of the SDBD physical model details, which could be clarified only by experimental validation.
1.2
Contraction of surface dielectric barrier discharge
One of the most important advantages of surface DBD is that it produces active species not in one point like a nanosecond spark discharge but in the uniform layer along the dielectric surface. The size of plasma region depends on the applied voltage, gas density and composition. The main reason of the high efficiency for airflow control application is a synchronous energy release on a sub–microsecond time scale.
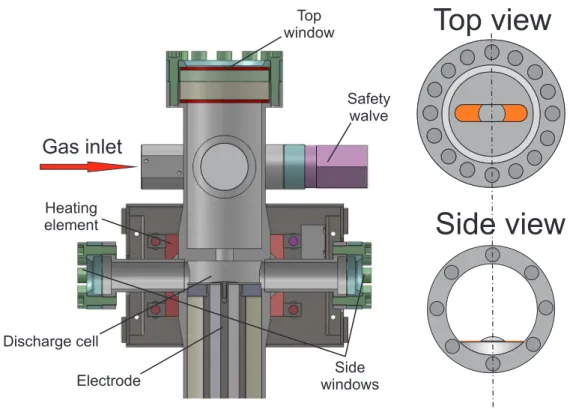
Nanosecond SDBD as a tool for plasma–assisted ignition has been suggested for the first time by Starikovskaia et al [42]. The electrode system in cylindrical geom-etry has been proposed for the following reasons: (i) to avoid edge effects as in flat configuration; (ii) to produce active species along entire dielectric surface of elec-trode system with the aim to get efficient 2D ignition of combustible mixtures; (iii) to adapt SDBD configuration for cylindrical combustion chamber of Rapid Com-pression Machines (RCM) [43,44]. The experimental conditions of RCMs reproduce
a)
b)
c)
Figure 1.7: (a) Chamber and compression system of rapid compression machine [45]; (b) cylindrical electrode system (top view), dielectric is given by green colour; (c) Discharge initiated in cylindrical configuration of SDBD (P = 1 bar, U = −25 kV) [42].
the conditions of internal combustion engines (P = 10 − 50 bar, T = 500 − 1500 K) in a single shot experiment. The schematic view of RCM chamber and compression systems is demonstrated in figure 1.7(a). The upper view of the electrode sys-tem [42] and corresponding image of the discharge at P = 1 bar are demonstrated in figure 1.7(b) and (c). It is clearly seen that the discharge covers entire dielectric surface.
Therefore, it was necessary to understand how the discharge behaves at elevated gas densities. The nanosecond SDBD discharge in a single shot regime was studied experimentally in air at high pressure (1-6 bar) by Stepanyan et al [46]. The width of applied HV pulses was ∼ 20 ns with the pulse rise time 0.5 ns. It was found that with increase of voltage and/or pressure the streamer surface discharge transforms to constricted mode. The constricted mode of the discharge represents a periodic structure of bright filaments starting from the edge of HV electrode and propagating in radial direction.
The discharge contraction is the phenomenon that has been first detected in AC, RF and pulse periodic surface DBD [2, 18, 47] and later in nanosecond SDBD discharges [11,46]. Visually, the filaments of surface discharge for all aforementioned cases are similar, however the mechanisms of transition in constricted phase are not the same. The majority of early experiments was carried out in ambient air in repetitive mode or for the long pulses.
Corke et al [2,3] describe the experimental investigation of SDBD initiated with sine wave AC applied voltage. It was demonstrated that transition from quasi– uniform discharge to filamentary mode is directly related to the frequency of ap-plied voltage. The number of well-pronounced filaments per unit of electrode length
1.2. Contraction of surface dielectric barrier discharge
increases with the frequency as it is demonstrated in figure 1.8.
Figure 1.8: Images of surface discharge initiated by AC applied voltage with different frequencies [3].
In a single shot regime with a rather long width of applied pulses (∼ 1 µs) several consecutive microdischarges take place [48]. The duration of each microdischarge is of the order of tens of nanoseconds. The negative polarity microsecond pulse with the current peaks corresponding to the discharge events is shown in figure 1.9(a). The corresponding images of the discharge are demonstrated in figure 1.9(b). It is clearly seen that discharge starts propagating in a quasi-uniform mode. For this mode the current increases gradually. As far as the applied voltage reaches the threshold of the transition into filamentary mode the discharge contraction takes place and well–pronounced current peaks are clearly seen. The filaments are not attached to the fixed plane from one to another microdischarge initiation. Each following filament is connected to the strip with individual cathode spot.
For a shorter time of applied pulses the filamentation of discharge was also ob-served in atmospheric air. Moreau et al [11] showed that single pulsed nanosecond SDBD discharge constricts at the trailing edge of applied pulses. During the decay-ing period of positive polarity pulse, as it is shown in figure 1.10, the second stroke of the discharge take place. The discharge is formed as a quasi-uniform front (fig-ure 1.10 moment A). The plasma propagates with relatively low speed of 0.1 mm/ns. Further, filaments are organized and the length of propagation exceeds the latter of the first stroke discharge. The filamentary discharge structure is different comparing to the discharge of Akishev et al [48]. Filaments are formed as a periodic structure but not as randomly appeared channels.
One more important example of surface DBD discharge contraction was observed in nanosecond pulse periodic regime of alternating polarity of applied pulses. It was found by Leonov et al [18] that discharge transforms to well–developed filamentary
Figure 1.9: (a) Discharge current and voltage waveforms, and (b) plasma emission images at different moments of time in strip-to-half-plane SDBD plasma in air at atmospheric pressure. Camera gate is 100 ns. The dielectric barrier is a ceramic plate 2 mm thick (ε ≈ 6.8). Labels indicate image timing [48].
Figure 1.10: Plasma formation and propagation during the decay-ing period of a positive polarity applied pulse. Real size per frame 26x9.7 mm2. [11].
phase within a few tens of nanoseconds when alternative polarity pulse train is used. At the same time the discharge remains diffuse when only negative polarity pulses are used, and a week filamentation takes place on a trailing edge of applied pulses when exposed electrode has positive polarity. The typical images of constricted and diffuse discharges are shown in figures 1.11(a) and (b). The corresponding schlieren images of produced shock waves are represented in figures 1.11(c) and (d). It is clearly seen that contraction significantly affects the compression wave amplitude and structure. For filamentary discharge, the compression wave length more than 2 times exceeds the latter produced by diffuse discharge. It was found [18] that the wave amplitude correlates directly with the coupled discharge energy. When the electrode is powered by a single (negative) polarity burst the appeared shock wave
1.2. Contraction of surface dielectric barrier discharge
is much weaker comparing to the wave generated by alternative polarity pulses.
(e)
(a)
(b)
( )
с
(d)
(f)
Figure 1.11: Direct correlation between negative polarity discharge im-ages 60 ns after the pulse voltage rise, and schlieren imim-ages of the shock wave take 7.5 µs after the discharge pulse: (a,c) alternating polarity pulse train, (b,d) single (negative) polarity pulse train. "Side view" (high volt-age electrode in on the left), Upsmax = 14 kV. (e,f) schlieren images of
the shock wave generated by pulse surface DBD plasma, taken 4 µsafter the discharge pulse for different pulse peak voltages: (e) Upsmax = 14 kV,
where strong contraction is observed and (f) Upsmax = 8 kV [18].
Figures 1.11(e) and (f) demonstrate how the amplitude of the applied voltage influences on the discharge structure and the structure of the generated shock waves. It is clearly seen, that the wavefront from the diffuse discharge (Upsmax = 8) kV
seems to be quite flat and uniform, whereas the waves generated by the constricted discharge of Upsmax = 14 kV amplitude has a well pronounced cylindrical structure.
The front becomes flat relatively fast with the distance from the electrode plane. Despite the fact that the detailed mechanism of the surface DBD contraction in the works of Leonov is not well understood, it was shown [18, 49] that the discharge contraction and thus the amplitude of the shock wave is directly related to the morphology of the surface charge transfer. The discharge contraction results in significant release of energy stored on the dielectric surface during and after discharge
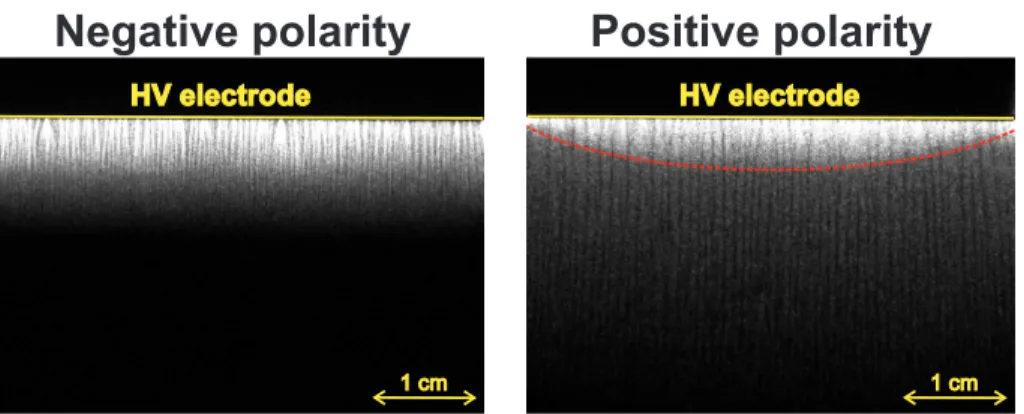
U=-26 kV, P=1 atm
HV electrode (d=20 mm)
P=3 atm, U=-47 kV
b)
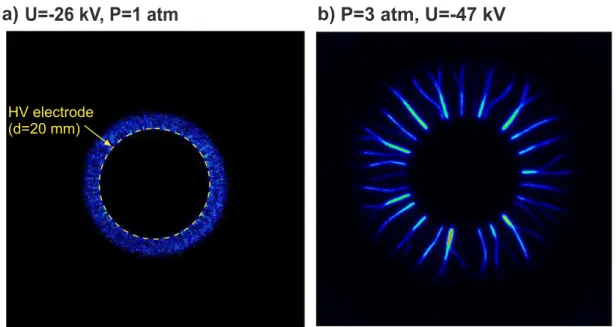
Figure 1.12: Streamer and filamentary nanosecond SDBD discharge. Camera gate 0.5 ns.
pulse, which in considered case exceeds the energy dissipated as Joule heat up to factor of 3–4. The stored energy is released as a heat if the discharge pulse is followed by an opposite polarity pulse. In discharge powered by a single polarity pulse, substantial accumulation of the surface charge limits the energy coupled to the plasma by subsequent pulses. therefore the filamentation is hindered.
The surface discharge filamentation in air in a single shot regime, when fila-ments appeared on the plateau of nanosecond pulses, was observed for the first time in [46]. The transition in filamentary mode has a threshold pressure Pth and
thresh-old voltage Uth. The quasi–uniform and filamentary discharge phases are shown in
figure 1.12. The discharge images were obtained for 1 and 3 bar pressure. Fila-mentary discharge at P = 3 bar and U = −47 kV appears abruptly 6 ns after the discharge start as a set of bright filaments propagating from HV electrode edge. The filamentary mode of nSDBD in a single pulse regime was observed, in considered conditions only for negative polarity of applied pulses [46]. The filaments were not observed for pressures P < 3 bar. During filamentary phase the discharge current, the discharge intensity and the maximum propagation length were higher than for streamer discharge.
Ionization–heating instability in the cathode layer was suggested [46] as a reason for the filamentation. Although, fast gas heating is able to provide significant tem-perature increase on the scale of a parts of micron during a few nanoseconds, the heated layer will have a longitudinal dimension of the cathode layer (sub–micron) and will be equal to a streamer radius in a lateral direction. There is no
explana-1.3. Plasma–assisted ignition/combustion at elevated gas densities
tion how the suggested shape of perturbation can initiate the ionization wave in the longitudinal direction (along the radius of the electrode system).
No experimental study of filamentary nSDBD at P ≥ 6 bar is available; the discharge has been studied only in air; very limited information about plasma pa-rameters in the filaments can be found.
1.3
Plasma–assisted ignition/combustion at elevated
gas densities
Equilibrium plasma initiated by spark discharge has been used for ignition of combustible mixtures for over a hundred years, the millisecond sparks are widely used in spark ignition engines. Low temperature non–equilibrium plasma is an effi-cient tool for initiation of the combustion chemistry. It can influence both accelera-tion of igniaccelera-tion and sustaining/stabilisaaccelera-tion of combusaccelera-tion. For the very first time, nanosecond discharges were suggested for PAI in [50]. During the last two decades significant advance in understanding of kinetics of ignition by non-thermal plasma has been made. The PAI domain was enlarged by a huge set of experimental data summarized in [51]. Figure 1.13 presents a summary of the initial thermodynamic parameters {P ; T } for the experiments on PAI/PAC with the help of nanosecond discharges. Only the experiments in combustible mixtures were taken into account. Showing the initial gas number density (before ignition) and temperature for each of the experiments, the P − T diagram in figure 1.13 allows comparison of the data related to the discharge development and combustion kinetics obtained by different scientific groups. The numbers on the right-hand side of the plot are linked to the appropriate papers in the table 1.1. Dashed lines in the diagram represent the isolines of the gas density, normalized to the atmospheric gas density at normal conditions, Natm.
It is clearly seen in figure 1.13, that the experiments at ambient initial temper-ature cover a wide range of pressures P = from ∼ 1 Torr [58–60] to 30 bar [72]. For higher temperatures the experiment are performed in different systems and conditions: (i) the reactors with preliminary gas heating are used for pressures 25 − 100 Torr and temperatures < 700 K [52, 53]; (ii) shock tubes [57, 61] are used for pressures 0.5 − 2 bar and temperatures 800 − 1700 K; (iii) the rapid compression machines for pressure ranges 2−50 bar and temperatures 700−1500 K [6,55,56]; (iv) low and atmospheric pressure burners are used in intermediate range of tempera-tures [64,66,67]. It can be noticed that the majority of the experiments is performed below atmospheric gas densities N < Natm. At the same time, the domain of high
Figure 1.13: P − T diagram of results available in the literature from ex-periments on combustion initiated or assisted by nanosecond discharges. The details of the symbols in the legend are given in table 1.1. Dashed lines represent the isolines of the gas density Natm for normal conditions.
Diagram is taken from review of Starikovskaia [51].
Table 1.1: Reference and mixtures under study for the data presented in the P − T diagram in figure 1.13 [51].
Number in fig. 1.13 Reference Composition of the mixture 1 [52–54] H2,CH4,C2H4,C3H8/O2/N2,Ar 2 [6, 55, 56] CH4,C4H10,C7H16/O2/N2,Ar 3 [57–60] H2,CnH2n+2,n = 1 − 6,C10H22/O2,N2O/N2,Ar,He 4 [61] C2H6/O2/N2,Ar 5 [62, 63] CH4,C2H4,C3H8/O2/N2,Ar 6 [64] CH4,DME/O2/He,Ar 7 [65] C2H2/O2/Ar 8 [66, 67] CH4/O2/N2 9 [68] CnH2n+2,n = (1 − 5)/O2/N2 10 [69] C3H8/O2/N2 11 [70–72] C2H2,CH4/O2/N2
The discharge morphology is very sensitive to both gas density and gas compo-sition. It was demonstrated by Pendleton et al [73] that the discharge morphology changes considerably with gas composition. The discharge becomes more branched
1.3. Plasma–assisted ignition/combustion at elevated gas densities
a)
b)
Figure 1.14: (a) Images of the discharge in: A-air, Φ = 0; B-air:CH4,
Φ = 0.3; C-air:CH4, Φ = 0.6; D-air:CH4, Φ = 1.2 [73]. (b) Diffuse
nanosec-ond discharge in pure air (left) and filamentation effect in air:propane (middle) and air:n-heptane (right) mixtures with 6% of hydrocarbon ad-ditives. The black arrows give the locations of the pin HV electrode [74]. with increase of fuel part in the gas mixture on the level of a few percent. The discharge [73] was initiated in point–to–plane geometry of electrode system. The tip radius was about 75 µm and the interelectrode distance was 8 mm. Nanosec-ond pulses with ∼ 20 ns pulse width were used. Figure 1.14(a) demonstrates the discharge imaging in air and air:methane mixtures with different equivalence ratios. Another independent group has observed similar behavior of the discharge in air and air:hydrocarbons. Figure 1.14(b) demonstrates the results of nanosecond discharge in a similar point–to–plane electrode geometry. Discharge was initiated with 20−40 ns and 40−50 kV pulses at atmospheric gas densities [74,75]. It is clearly seen how the diffuse discharge in air becomes "filamentary" in air:propane and air:n-heptane mixtures with 6% of hydrocarbon additives. Energy deposition and current in these two works are of the same order of magnitude. The discharge morphology is an extremely important parameter for the following ignition of combustible mixtures. It provides the information about the distribution of temperature and active species in the volume and/or surface where discharge is initiated. In general, the volume occupied by the discharge decreases when pressure is increased. Therefore, to provide
Figure 1.15: The chain length in a stoichiometric H2:O2 mixture at P =
20 Torr and current I = 150 mA as a function of initial temperature: the symbols correspond to the experiment [76], the curve correspond to the calculation [77]. And the dashed vertical line to the ignition threshold for the conditions in [76]. Plot is taken from [78].
efficient ignition at high pressure is a challenging task.
One of the pioneering and unique for nowadays work of ignition with transient plasma was done by Gundersen et al [70]. The results of ICCD images of nanosecond discharge and following flame initiation in a quiescent C2H2:air mixture at P = 1 bar
and T = 300 K are presented in [70]. Two different nanosecond pulses of 10 and 50 ns pulse widths were used to compare the efficiency of ignition regarding to conventional spark plug. The experiments were carried out at extremely high gas pressure, up to 30 bar at ambient temperature. The experiments were carried out in the cylindrical combustion reactor with constant volume. The stainless steel wire in the axis of cylindrical chamber served as the HV electrode. The discharge was initiated by 10 and 50 ns pulses in a single shot regime.
The efficiency of plasma–assisted combustion is directly related to three key points: (i) the production of active species and fast gas heating (FGH) during the discharge phase; (ii) the combustion chemistry that includes chain branching and development and that is exponentially dependent on the gas/flame temperature, and (iii) the hydrodynamics of combustion waves propagation. There is a number of theoretical works considering the FGH during non–equilibrium discharge [79–
1.3. Plasma–assisted ignition/combustion at elevated gas densities
82]. Experimentally fast gas heating is considered in [83, 84]. In spite of some mismatches in fraction of energy, transferred rapidly into heating due to FGH, in general the mechanisms are equivalent. Two–step processes are responsible for the rapid heat liberation: 1) N2(X)+e → N2(A,B,C,...)+e, and 2) N2(A,B,C)+O2 →
N2(X)+2O+heat.
The combination of the heat release due to FGH and production of active species determines the basis of ignition chemistry. As an example, the possibility of ignition temperature threshold decreases with production of active species in H2:O2 mixture
in photolysis was studied experimentally in [76] and later calculations for the same conditions were performed in [77]. The efficiency of the chain–branching reactions depending on the initial gas temperature was investigated. It was demonstrated that absorption of the radiation in the Schumann-Runge continuum of oxygen molecules is accompanied by O2 dissociation and the production of active O(1D) atoms, that
significantly increases the chain length. Figure 1.15 shows the experimental and the calculated chain length for different temperatures. It is clearly seen how temperature increase provided by FGH can increase the chain branching.
High reduced electric field in the discharge leads to efficient production of atomic particles. It was shown [82] that for E/N = 100 − 300 Td in air:fuel mixtures, up to 50% of the discharge energy is spent on the dissociation of molecules. The addition of atomic oxygen and/or atomic hydrogen to combustible mixtures causes the reduction of ignition delay time and ignition threshold. There are different channels of active atomic particles production: (i) dissociation by UV radiation [76, 85]; (ii) by direct electron impact [57,86]; (iii) quenching of electronically excited molecules [80,87,88],
etc. On the other hand, chain combustion reactions exponentially accelerate with
gas temperature. Therefore, while considering the most optimal way of efficient flame initiation it is necessary to "play" with a balance of active species production and fast gas heating, as far as the energy branching over internal degrees of freedom is determined by E/N values in the discharge. A few recent reviews devoted to the ignition with non–thermal plasma of hydrogen combustion [77,78,89] discuss all these aspects regarding to low temperature oxidation of hydrogen:air mixtures.
The combustion chemistry plays a crucial role on both stage of the flame initia-tion and of the propagainitia-tion of combusinitia-tion wave. Seeding of active species produced by non-thermal plasma changes the kinetic pathways and thus changes the ignition and extinction limits [90]. The changes of these limits can be represented as a tran-sition of S–curve into a monotonic curve as it is shown in figure 1.16(a). It can lead to the situation when no flame extinction limit will exist between ignition and flame [91]. To prove experimentally the so–called S–curve transition by plasma, nanosecond pulsed discharge experiment was carried out in methane/air mixture in counterflow diffusion flames [92]. The S-curve transition that is demonstrated in
a)
b)
Figure 1.16: (a) Schematic of the plasma assisted transition from the classical ignition and extinction S–curve (solid blue line) to the monotonic stretched S–curve (red dashed line). [91]; (b) Schematic of timescale and key kinetic pathways at different stages of plasma assisted ignition and combustion [93].
figure 1.16(a) due to the action of plasma is equivalent to a decrease of the activa-tion energy of the fuel oxidaactiva-tion reacactiva-tion at low temperature. It happens because plasma can produce radicals faster than the fuel oxidation chemistry alone.
It is schematically illustrated by Ju and Su in their review [93] and shown in figure 1.16(b), that the plasma–assisted combustion chemistry can be represented as three stages: (i) plasma chemistry, where the discharge produces active species and the electron impact excitation and dissociation play the main role; (ii) plasma– assisted combustion stage, where the radicals are produced in collisions with excited species N2(A,B,C,...), O(1D), O2(a1∆g), etc.; (iii) combustion kinetics, where chain
branching reactions lead to pressure/temperature increase and flame enhancement. In spite of rather well developed plasma kinetics during the initial period (∼ 100) ns, the energy transfer and kinetic interaction of plasma generated active species and other reactants at intermediate timescale at low temperatures (100 ns< t < 1 ms, T = 300 − 1000 K) remain unclear. The current plasma–assisted combustion ki-netic models cannot predict the behavior of key species at low temperatures and high pressure conditions. One of the still poorly understood phenomenon is the interaction of the plasma with cool flames [94].
Figure 1.17 demonstrates the theoretical results of Filimonova et al [95] concern-ing the study of the low–temperature plasma action on the negative temperature coefficient behavior in C3H8:air mixtures. Negative temperature coefficient (NTC)
1.3. Plasma–assisted ignition/combustion at elevated gas densities
a) b)
Figure 1.17: (a) Induction time as a function of initial temperature and input energy of the discharge; (b) Induction time as a function of initial temperature for different equivalence ratio of the C3H8:air mixture. [95].
delay increases with temperature. This happens when the chain branching is gov-erned by a density of relatively stable intermediate radicals (so–called degenerate chain branching). The discharge effect on the negative temperature coefficient is illustrated by figure 1.17(a). It is clearly seen that the discharge even with rel-atively small deposited energy W = 0.005 eV/molecule significantly reduces the amplitude of the NTC. For W = 0.02 eV/molecule the NTC completely disappears. The difference of discharge operation with W = 0.005 eV in mixtures with different equivalent ratio is demonstrated in figure 1.17(b). It is shown that for lean mixture with ER=0.7, the NTC region is totally eliminated by non–thermal plasma action. The worse a mixture ignites due to auto–ignition, the more efficient the influence of the discharge. This fact was experimentally confirmed in [96].
One more key point of combustion processes is related to the propagation and interaction of combustion waves. The gas dynamics and the thermochemical cou-pling between non–thermal plasma and the reactive flows are still unclear. One of the pioneering work demonstrating the impact of flow recirculation induced by nanosecond spark discharge on the ignition kernel is done by Castela et al [97]. 3–D DNS computations, with detailed combustion chemistry and a plasma model devel-oped in [97], for understanding of the plasma–flow–combustion interaction during the ignition by nanosecond repetitively pulsed (NRP) spark discharges. The results of a 3–D DNS was compared by experimental schlieren images of reactive kernel dynamic. The study was performed for methane-air mixture.
Figure 1.18(a) demonstrates the radial profiles of the key species in the middle of the gap between tip electrodes for the cases with and without gas recirculation at three time moments, and figure 1.18(b) shows radial temperature profiles for consid-ered time instants. Starting from t ∼ 80 µs the recirculation plays an important role
a)
b)
Figure 1.18: (a) Species mass fraction profiles along the radius of the nanosecond spark channel: on the left side refer to the case with gas recirculation (3-D DNS); on the right side refer to the case without gas recirculation (2-D DNS); (b) Temperature radial profiles with (on the left) and without (on the right) recirculation. [97].
in ignition processes. It decreases the temperature, however the diffusion length of the reactive species is increased by ∼ 1.5 times. The spreading of the intermediate species may lead to increase of the gas energy around the discharge zone, and to appearance of more favorable thermochemical conditions. This may influence on the flame speed enhancement observed previously by the same scientific group [98].
1.4. Plasma–assisted ignition with surface DBDs
It was demonstrated in [98], that the flame wrinkling induced by the NRP dis-charges seems to accelerate the flame propagation. The comparison between ignition initiated by conventional Audi coil and NRP discharges has been performed. The flame propagation strongly depends on the frequency and number of initiated dis-charge pulses. It was found that, the flame ignited by NRP disdis-charge has more wrinkling structure than that initiated by conventional spark. The turbulization of the flame front by plasma, although not clearly understood yet, can be an important issue of PAI/PAC problem.
1.4
Plasma–assisted ignition with surface DBDs
Non–equilibrium plasma can be produced by different ways. One of the most popular discharge for plasma–assisted ignition is nanosecond spark either a single spark or in pulse periodic regime [97–99]. However, there are a few other ways to initiate low temperature ignition, as corona or microwave discharges [96, 100, 101]. One of the most promising advantages of nSDBD for PAI is the distributed ignition along entire surface of the electrode. And as it was mentioned above, the nSDBD in cylindrical configuration was suggested for this purpose [42].
Some previous studies describe the ability of ignition with nSDBD in the constant volume chamber [5] and in the rapid compression machines [6]. The considered nSDBD provided two–dimensional low–temperature plasma in the vicinity of the end plate of the combustion chamber. The experiments in rapid compression machine described in [6] were carried out in methane–oxygen and n–butane–oxygen mixtures with equivalence ratios between 0.3 and 1 diluted by 70 − 76 % of Ar or N2 for
temperatures and pressures in top dead center between 600 to 1000 K and 6 −16 bar respectively. The study provides evidence of the efficiency of nanosecond SDBD to ignite combustible mixtures. A direct comparison of autoignition and PAI by nSDBD demonstrated a stable ignition and subsequent flame propagation in the combustion chamber of RCM for nanosecond pulse duration 20 ns in a single shot regime.
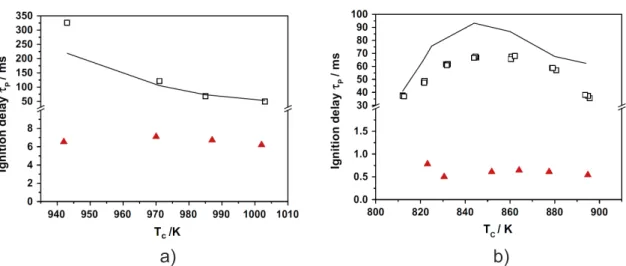
Figure 1.19 demonstrates the comparison of ignition delays for autoignition and ignition by nSDBD. The results were obtained for methane and n–butane containing mixtures. It can be observed that plasma–assisted ignition delay time is practically constant with initial temperature of the mixture and comprises about 6 ms for the CH4/O2/Ar, and about 0.5 ms for the n-C4H10/O2/Ar mixtures. The analysis
of flame propagation was also performed. The resulting combustion waves were recorded by fast imaging. A single combustion wave propagating from the electrode system is clearly distinguished. The energy deposition per one streamer to initiate a
a) b)
Figure 1.19: Evolution of the autoignition delay (white squares) and plasma assisted ignition delay (red triangles) with initial temperature. Lines: calculated autoignition delays using the mechanism from Healy et al [102]. (a) CH4/O2/Ar, ER=0.5, U = −24 kV. PT DC ranges from 15.4 to
16.0 bar; (b) stoichiometric n-C4H10/O2/Ar mixture. U = −52 kV. PT DC
ranges from 8.3 to 9.6 bar [6].
stable combustion wave was estimated to be in the range 5−10 µJ. Such a small value proves the efficiency of distributed (multi–point) ignition by non–thermal plasma at high pressures and intermediate temperatures.
Later [56] the experiments were carried out in n–C7H16/O2/N2=1.8/19.6/78.6
mixture at PT DC = 1.8 bar and TC = 630 K. At this conditions no autoignition
is observed. The discharge was initiated by double 20 ns pulses: first at top dead center point, the second 60 ms after. Starting from the certain amplitude of applied voltage U = −40 kV, the pressure trace is modified and demonstrate a low, about 0.1 bar rise of the pressure. This pressure rise corresponds to plasma–assisted cool flame. At the considered conditions no autoignition and no cool flame without discharge initiation were observed. With increase of voltage amplitude, the pressure rise also increased and when the voltage was about U ∼ 47 kV the second pulse initiated the sharp pressure increase corresponding to explosion of gas mixture. So, well pronounced two–stage ignition was controlled experimentally [56].
The chemical analysis of intermediate species of plasma–assisted cool flame at PT DC = 1.5 bar and TC = 650 K was studied experimentally by Vanhove et al [103]
with the help of gas chromatography. It was demonstrated that under particular conditions of the RCM experiment (N ≃ 0.9Natm), despite the aforementioned
elec-trode configuration the initiated discharge was volumetric with streamers that cross the combustion chamber of RCM. Comparison of the plasma–assisted cool flame
1.4. Plasma–assisted ignition with surface DBDs
a)
b)
c)
Figure 1.20: ICCD images of C2H6:O2=2:7 mixture ignition by (a) a
nanosecond spark discharge; (b) a nanosecond SDBD. Camera gate for both cases is 0.5 µs. (c) Flame propagation x − t diagrams for the SDBD and for spark ignition [5].
with spontaneous cool flame at somewhat higher pressure (PT DC = 2.4 bar) showed
that no new products are formed. Gas chromatography analysis of the cool flame at different time instances after the discharge demonstrates that the main reaction pathways of low–temperature combustion (LTC) chemistry are not changed under plasma action. It is concluded [103], that discharge mostly influence on the forma-tion of a radical pool that accelerates the LTC chemical mechanism.
Despite the fact that the discharge effect on ignition in RCM is well pronounced and demonstrated in [6, 56, 103], the optical access did not allow performing the
a)
b)
Discharge, U=-26 kV Flame, 200 µs Flame, 400 µs Flame, 600 µs Flame, 1000 µs
c)
Figure 1.21: The specific energies deposition (mJ·cm−3
) contours (top plots) and the contours of O-atom densities (1017cm−3
) near the high– voltage electrode edge at the end of streamer discharge formation (t = 13 ns) for (a) positive and (b) negative polarity of applied pulses with |U| = 14 kV; (c) image of the discharge and consequent flame initiation and propagation of combustion wave (top view) [7].
detailed study of the discharge in combustible mixtures and of the morphology of ignition pattern. For the very first time the morphology of ignition pattern initiated by nSDBD was studied in [5] on the example of stoichiometric C2H6/O2 mixtures
(P = 1 bar) in a constant volume chamber. It was demonstrated, that the nSDBD can be considered as a multi-point ignition system. The pulses of negative polarity with 25−30 ns FWHM and 10–15 kV amplitude were used to trigger the discharge in the same cylindrical SDBD geometry as described above and the nanosecond spark. To initiate the nanosecond spark, the two pin electrodes separated by 2 mm were used.
Figure 1.20(a) and (b) show the ICCD images of the flame propagation initiated by nanosecond spark and SDBD respectively. The energy of the incident pulse was kept the same, W = 60 mJ. It can be noticed that during the same period the flame
1.4. Plasma–assisted ignition with surface DBDs
from the nSDBD occupies bigger volume that that initiated by the nanosecond spark. Figure 1.20(c) shows the x − t diagrams of combustion waves. During the first 150 µs, the velocities of the combustion waves initiated by SDBD and spark are identical. However, at t > 150 µs the flame front initiated by SDBD moves significantly faster. The reason of such propagation velocity increase can be linked with the processes related to the interaction of several combustion waves. To our knowledge, for the moment there is no qualitative explanation of this phenomenon confirmed by simulation results.
One more recent study devoted to the plasma-assisted ignition with SDBD was carried out by the same scientific group of Moscow Institute of Physics and Technol-ogy [7]. In this work the stoichiometric C2H2/air mixture was ignited at P ≤ 1 bar
with a single pulsed nSDBD. Discharge was produced by both positive and negative polarity. It was found that negative polarity discharge ignites the mixture "easier" (smaller energy deposition) than the discharge of positive polarity. Anokhin et al [7] showed that for both polarities of applied pulses the ignition takes place at the edge of the high voltage electrode.
2-D modeling of the discharge in air was performed by Soloviev et al [7] and the results of this modeling are shown in figure 1.21(a) and (b). It is clearly seen that for negative polarity of applied pulses the energy deposition and O-atoms density in the vicinity of the HV electrode is significantly higher than the values provided by positive polarity of applied pulses. Subsequent flame initiation by the discharge of negative polarity is demonstrated in figure 1.21(c). Indeed, it is clearly seen that flame propagates from the HV electrode.
So, the question of the spatial distribution of energy in the discharge is very important for following chemistry, heating and finally for the ignition/combustion development.
Problem formulation
As it was described in literature review, the nanosecond surface dielectric barrier discharge (nSDBD) in a single pulsed regime in atmospheric air has been widely studied experimentally and with the help of numerical 2D simulation. It is known that the nSDBD starts from the edge of the HV electrode for both polarities of applied pulses. The velocity of positive polarity streamers is higher than the velocity of propagation of negative polarity. The synchronous start of the set of streamers leads to the synchronous energy release and to the generation of the compression wave. Attempts to measure E/N, although giving different results, indicate that the region of high electric field exist in the vicinity of the dielectric layer. The complexity of nSDBD structure is basically related to the highly nonuniform distribution of the reduced electric field both with the radius and along the length of the plasma channel. Validation of numerical schemes under these conditions is a challenge.
It is known that with increase of pressure and/or amplitude of applied voltage a single pulsed nSDBD transforms to contracted – filamentary mode. No information is available about transition parameters in different gases. No filamentation was observed at positive polarity of the high voltage pulse. The lack of the experimental data does not allow development of a reliable mechanism describing the transition to filamentary mode. The parameters of plasma in the filaments are not known.
As it was demonstrated, the surface discharge in the contracted mode is of par-ticular interest for aerodynamic and combustion applications. The nSDBD has a significant advantage regarding to other discharge types (f.e. spark, microwave dis-charge etc.) that can be applied for ignition of combustible mixtures. It is the ability to provide a regular structure of ignition kernels at high gas densities. All

![Figure 1.8: Images of surface discharge initiated by AC applied voltage with different frequencies [3].](https://thumb-eu.123doks.com/thumbv2/123doknet/2836790.69033/26.892.132.767.177.424/figure-images-surface-discharge-initiated-applied-different-frequencies.webp)