HAL Id: hal-00937167
https://hal.sorbonne-universite.fr/hal-00937167
Submitted on 27 Jan 2014
HAL is a multi-disciplinary open access
archive for the deposit and dissemination of
sci-entific research documents, whether they are
pub-lished or not. The documents may come from
teaching and research institutions in France or
abroad, or from public or private research centers.
L’archive ouverte pluridisciplinaire HAL, est
destinée au dépôt et à la diffusion de documents
scientifiques de niveau recherche, publiés ou non,
émanant des établissements d’enseignement et de
recherche français ou étrangers, des laboratoires
publics ou privés.
Measuring and Mitigating Web Performance
Bottlenecks in Broadband Access Networks
Srikanth Sundaresan, Nick Feamster, Renata Teixeira, Nazanin Magharei
To cite this version:
Srikanth Sundaresan, Nick Feamster, Renata Teixeira, Nazanin Magharei. Measuring and Mitigating
Web Performance Bottlenecks in Broadband Access Networks. ACM Internet Measurement
Confer-ence, Oct 2013, Barcelone, Spain. pp.213-226, �10.1145/2504730.2504741�. �hal-00937167�
Measuring and Mitigating Web Performance Bottlenecks in
Broadband Access Networks
Srikanth Sundaresan
Georgia Tech[email protected]
Nick Feamster
Georgia Tech[email protected]
Renata Teixeira
CNRS & UPMC[email protected]
Nazanin Magharei
Cisco Systems[email protected]
ABSTRACT
We measure Web performance bottlenecks in home broadband ac-cess networks and evaluate ways to mitigate these bottlenecks with caching within home networks. We first measure Web performance bottlenecks to nine popular Web sites from more than 5,000 broad-band access networks and demonstrate that when the downstream throughput of the access link exceeds about 16 Mbits/s, latency is the main bottleneck for Web page load time. Next, we use a router-based Web measurement tool, Mirage, to deconstruct Web page load time into its constituent components (DNS lookup, TCP con-nection setup, object download) and show that simple latency opti-mizations can yield significant improvements in overall page load times. We then present a case for placing a cache in the home net-work and deploy three common optimizations: DNS caching, TCP connection caching, and content caching. We show that caching only DNS and TCP connections yields significant improvements in page load time, even when the user’s browser is already performing similar independent optimizations. Finally, we use traces from real homes to demonstrate how prefetching DNS and TCP connections for popular sites in a home-router cache can achieve faster page load times.
Categories and Subject Descriptors
C.2.3 [Computer-Communication Networks]: Network Opera-tions—Network Management; C.2.3 [Computer-Communication Networks]: Network Operations—Network Monitoring
Keywords
Broadband Networks; Web performance; Bottlenecks; Popularity-based prefetching; Connection caching; DNS prefetching
1.
INTRODUCTION
Home broadband Internet access is getting faster: the OECD re-ports that broadband speeds are increasing by about 15–20%
ev-ery year. Average advertised broadband speeds are now about
16 Mbits/s in the U.S. and 37.5 Mbits/s across OECD areas [45].
Permission to make digital or hard copies of all or part of this work for personal or classroom use is granted without fee provided that copies are not made or distributed for profit or commercial advantage and that copies bear this notice and the full cita-tion on the first page. Copyrights for components of this work owned by others than ACM must be honored. Abstracting with credit is permitted. To copy otherwise, or re-publish, to post on servers or to redistribute to lists, requires prior specific permission and/or a fee. Request permissions from [email protected].
IMC’13,October 23–25, 2013, Barcelona, Spain. Copyright 2013 ACM 978-1-4503-1953-9/13/10 ...$15.00. http://dx.doi.org/10.1145/2504730.2504741 .
As downstream throughput continues to increase, one might expect the Web to get faster at home, as well. Meanwhile, Internet ser-vice providers and application providers are increasingly cognizant of the importance of reducing Web page load times; even seem-ingly small differences in latency can introduce significant effects on usability (and revenue). The Bing search engine experiences re-duced revenue of 1.2% with just a 500-millisecond delay [53], and a 400-millisecond delay resulted in a 0.74% decrease in searches on the Google search engine [16]. Forrester research found that most users expected online shopping sites to load in two seconds or fewer [42]. Content providers struggle to mitigate any network performance bottleneck that can slow down Web page loads in ac-cess networks by even tens of milliseconds. Thus, it is crucial to understand both how network properties of access networks such as latency can introduce bottlenecks in Web page load times and the extent to which various optimizations can help further mitigate these bottlenecks.
Towards this goal, in this paper, we use measurements from a router-based Web performance measurement tool, Mirage, to an-alyze Web page load times to nine popular Web sites. This tool has been deployed in over 5,000 home networks as part of the FCC/SamKnows deployment in the US. We also deploy the tool in our own smaller deployment, BISmark. We examine how ac-cess network latency and throughput can introduce performance bottlenecks and evaluate how to mitigate these bottlenecks by de-ploying various caching optimizations on the router in the home network. Next, we demonstrate that caching on a home router can improve page load time, even if the router does not cache any con-tent (i.e., even if it only caches DNS records and TCP connections), and even if the end host or Web browser is already independently performing similar optimizations. Finally, we show how prefetch-ing DNS records and TCP connections from the home router can improve cache hit rates; we use a trace-based emulation to show that prefetching can help achieve these performance improvements in real home networks. We now describe each of these contribu-tions in more detail.
First, we measure Web performance from 5,556 broadband ac-cess networks to nine popular Web sites and identify bottlenecks that contribute to Web page load time in these networks (Section 5). Our results suggest that latency is the main bottleneck for Web page load times for access links whose downstream throughput exceeds about 16 Mbits/s. Last-mile latency is an important contributor to the end-to-end latency, and an increase in last-mile latency of just 10 milliseconds can sometimes induce delays of hundreds of milliseconds for page load times of popular sites. In the case of small objects, we find that TCP latency overhead exceeds the actual download time of the object. Our results corroborate and quantify
anecdotal evidence from users, Internet service providers, and con-tent providers who are increasingly finding that latency is becoming a critical performance bottleneck [30, 42].
Second, we use Mirage to deconstruct page load time into its constituent components (i.e., DNS lookup, TCP connection setup, content download) and show that even small improvements in la-tency can yield significant improvements in overall page load times (Section 6). To our knowledge, this paper presents the first study to compare the relative benefits of content caching, DNS caching, and TCP connection caching from within home networks. As part of this analysis, we explore how the page load time that Mirage measures relates to Web page load time measured by other tools (e.g., Phantomjs, Web browsers). We find that latency is a signif-icant contributor to all factors that affect page load time. These results—in conjunction with previous studies that have observed that characteristics of the access network can introduce signifi-cant latency [55]—present the case for home caching, the process of caching DNS lookups, TCP connections, and content from the home router.
Third, we deploy an OpenWrt module that performs various caching optimizations in home routers on the BISmark testbed and show that such a cache can yield improvements in page load time, even if it does not cache content, and even if the browser is already
performing similar optimizations(Section 7). As expected, content
caching offers the most significant reductions in page load time and can reduce page load times by up to 53% in some cases. Yet, simply caching TCP connections and DNS records at the home router can reduce mean page load times by 20% and 7%, respectively, even if the ISP and browser are also independently performing their own caching optimizations.
Finally, to improve cache hit rates in real home networks, we introduce popularity-based prefetching, which prefetches DNS records and TCP connections for Web sites that are commonly ac-cessed from a home network. Using Web traces from twelve home networks, we find that prefetching DNS records and TCP connec-tions for only the twenty most popular sites significantly increases DNS and connection cache hit rates and therefore could offer sig-nificant improvements in page load times.
The Web performance measurements from the SamKnows de-ployment are available on the FCC Web site [?]. We have published both the Web performance measurements from the BISmark ex-periments [15] and the OpenWrt module that performs popularity-based prefetching [50].
2.
BACKGROUND
Factors that affect page load time. Web downloads begin by downloading the home page of the requested Web page. The home page object typically contains references to other objects that the browser must subsequently retrieve. Each of these objects is ref-erenced with another URL, which the browser retrieves with addi-tional HTTP requests. These objects are either static, in which case the URL is in the home page itself; or dynamic, in which case the URL is determined by running active scripts (e.g., Javascript) that determine which objects to download. Modern Web sites typically contain a mix of static and dynamic objects. Browsers minimize the download time of the individual objects using many optimiza-tions such as parallel fetches, DNS caching, TCP connection reuse, and optimizations for processing scripts and rendering. Different browsers implement different sets of optimizations.
Because the time for the browser to render a page depends on the choice of browser and machine configuration, we instead de-fine page load time as the time from the initial request to the time
when all objects for the page have been retrieved. The retrieval time for each object has the following components: (1) the DNS
lookup timefor the domain referenced in the object URL; (2) the
TCP connection time, which is the time to complete the TCP three-way handshake to the server; (3) the server response time, which is the time it takes for the server to start sending the object once it has been requested; and (4) the object download time, which is the time to download the object itself over TCP. Some of these factors, such as the DNS lookup and TCP connection times, are bound by latency; others, such as the object download time, are bound by both latency and throughput.
Optimizations to improve page load time. A number of optimiza-tions have been proposed and implemented in the quest to minimize page load time. Server-side optimizations include HTTP replace-ments [?, 54] and TCP modifications [13, 14, 21, 22, 28]. Recent proposals suggest using a larger initial congestion window sizes on servers for TCP connection, so that small objects can be transferred with significantly fewer round trips [28]. Al-Fares et al. studied the effects of server-side optimizations, such as increasing TCP’s ini-tial congestion window (ICW) and enabling HTTP pipelining on Web page load times [9]. They found that increasing the ICW can reduce page load times by several hundred milliseconds in many cases. Although these server-side optimizations can improve page load times, they do not reduce certain components that contribute to page load time, including DNS lookup and the TCP connection setup time.
Many client-side optimizations from the browser have also been developed. HTTP/1.1 introduced persistent connections and pipelining. Persistent connections allow the client to retrieve multi-ple objects over the same TCP connection (thereby amortizing the three-way handshake and TCP congestion window ramp up cost over multiple objects). Pipelining allows the client to initiate a request for the next object as soon as it sees a reference to that object in another object (rather than waiting for the object down-load to complete). Nielsen et al. showed the superior performance of HTTP/1.1 over HTTP/1.0 [44]. However, most browsers do not enable pipelining by default, and some servers do not enable persistent connections. Zhou et al. propose a new protocol that minimizes connection time by having DNS resolvers set up TCP connection on the client’s behalf [60]. Browsers also download multiple objects in parallel and have highly optimized engines for parsing and rendering objects.
Content cachingis also a common optimization. Content
Distri-bution Networks (CDNs) are large distributed caches that are typi-cally deployed at the edge of ISPs to reduce the latency between the end-host and the content. Ihm et al. characterized five years of Web traffic traces from a globally distributed proxy service; they observe that Web caches typically have a 15–25% hit rate, and these rates could almost double if caches operated on 128-byte blocks [33]. Previous studies have reported object cache hit rates in the range of 35–50%, although these cache hit rates have continued to drop over time [4, 18, 32, 43, 59]. Some browsers also support content prefetching [41]; Padmanabhan et al. proposed predictive content prefetching using server hints [47].
To improve cache hit ratios, Web browsers prefetch DNS records anticipating client requests; the browser parses certain downloaded pages (e.g., a search result page) for domains and resolves them before the user clicks on them [26]. To reduce the time associated with DNS lookups, browsers and intermediate DNS servers employ caching and prefetching [23, 24]. Jung et al. studied DNS perfor-mance and the effectiveness of DNS caching [36], and saw that DNS cache hit rates can be as high as 80%, even with only a few
clients [35]. Feldmann et al. observed in Web traces from AT&T home users that 47% of objects retrieved incur more than half of the total download time from TCP connection setup [31]. Based on this observation, the study proposes a connection cache in the ISP network to reduce connection setup time, which reduces download times by up to 40%.
3.
RELATED WORK
There is much previous work on measuring and modeling Web performance, ranging from protocol modeling to empirical anal-ysis to designing techniques to improve performance. Many of these previous studies were performed before the growth of broad-band access networks, content distribution networks, and modern browsers. This evolution suggests that it is time for a reappraisal of some past studies in the context of broadband access networks, although it is important to put our study in the context of previous work. Below, we compare past work in measuring and modeling Web performance to the study in this paper. This study is a more complete version of our own previously published work, which explored the contribution of latency to Web page load time [57] and the positive performance benefits of proactive caching and prefetching [56].
Measuring Web performance. Barford et al. analyzed the contri-bution of server, client, and network delays to HTTP 1.0 transac-tion times [12]; the authors used virtual clients on several campus networks to request files from a virtual Web server. They found that for small files, server load is the dominant factor for perfor-mance, while for large files, the network properties dominate. Kr-ishnamurthy and Wills analyzed the impact of variants of TCP (i.e., Tahoe, Reno) and HTTP (i.e., persistent, parallel, or pipelined) on Web performance; they also studied the effects of network latency and server load on observed performance [38]. These studies were performed more than ten years ago. During this time period, the Web has changed dramatically, in terms of the type of content is served, how content is hosted, and how browsers operate. Addi-tionally, broadband Internet access has proliferated since the late 1990s. It is also much faster than it was when these original studies were conducted and is now a predominant mode of Internet access. To our knowledge, this study is the first to explore Web page load times from broadband access links, and the first to quantify the extent to which latency becomes a bottleneck on high-throughput access links.
More recent work has studied the performance of CDNs [34] and caching [29]. Akella et al. [5–8] studied the effects of the perfor-mance of 68 CDN sites across 17 cities, focusing on how server multihoming can improve CDN performance for clients. “Why-High?” identifies cases where a certain set of clients experience higher Web page load times [39]. Butkiewicz et al. recently studied how the complexity of modern Web sites may contribute to slower page load times and found that more than 60% of the Web sites they profiled retrieve content from five non-origin sources that con-tribute to more than 35% of the bytes downloaded [17]. Our work complements existing literature by exposing how access networks introduce bottlenecks and assessing how well existing Web perfor-mance optimizations work when they are deployed in homes.
The online service webpagetest.org [?] analyzes the con-tribution of different network components to overall page load time via a “waterfall”; the analysis is similar to the decomposition that we perform in this paper, although the software we develop can run directly on home routers, unlike webpagetest.org, which runs from data centers. Keynote [37] and Compuware [25] perform end-to-end Web performance measurements from a variety of vantage
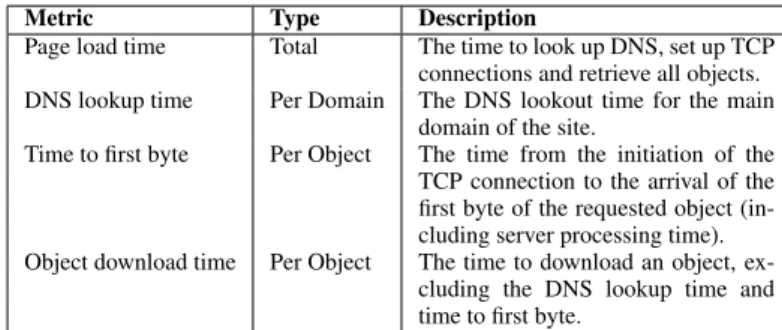
Metric Type Description
Page load time Total The time to look up DNS, set up TCP connections and retrieve all objects. DNS lookup time Per Domain The DNS lookout time for the main
domain of the site.
Time to first byte Per Object The time from the initiation of the TCP connection to the arrival of the first byte of the requested object (in-cluding server processing time). Object download time Per Object The time to download an object,
ex-cluding the DNS lookup time and time to first byte.
Table 1: Performance metrics. For each per-object metric, Mirage measures the maximum, minimum, and average times for each ob-ject in the transaction.
points, but they do not study how individual network factors such as latency, loss, or throughput ultimately contribute to page load time.
Modeling Web performance. Previous work developed models for TCP and HTTP performance based on various network proper-ties such as latency and packet loss [10, 11, 19, 20, 46]. We present an empirical study of Web performance from thousands of access networks. This empirical approach provides new insights into how access network characteristics affect each component of page load time. WebProphet [40] and WProf [58] analyze dependencies be-tween Web page objects to predict browser-level response time and study bottlenecks in the critical path of page load times. These tools are valuable in the quest to improve page load times by exposing inefficiencies in Web site design, but they are difficult to deploy at scale.
4.
MEASURING PAGE LOAD TIME
The notion of page load time depends on many factors, including the underlying network, the design of the Web site, and the endhost, including the browser. Every browser downloads pages using dif-ferent methods (and difdif-ferent optimizations), and the pages them-selves may be optimized for different browsers and devices. In this paper, we explore how the characteristics of broadband networks affect Web page load times. Page load time will necessarily vary depending on the above characteristics. Thus, to conduct controlled experiments of the effects of network characteristics on page load time, we use a single tool on a common platform to measure page load times as various network conditions change. We now explain the design of the active measurement tool that we use, and how the numbers it yields compares to that of a browser.
4.1
Mirage: Home Router-Based Web Testing
We use measurements from the FCC/SamKnows deployment of routers across the US [55]. The deployment uses a custom tool, which we call Mirage, to measure page load time. Mirage is a headless Web client designed by SamKnows for deployment on home router devices; the initial deployment of Mirage was spon-sored by the Federal Communications Commission (FCC) on more than 5,000 homes across the US. We also use it in the BISmark deployment.
4.1.1
How Mirage Works
Mirage downloads the home page of a Web site and parses it to determine the static objects that are needed to render the page. It then performs all the DNS lookups at once before downloading the rest of the objects. The tool is based on libcurl, which can
de-0 1000 2000 3000 4000 5000 Duration (ms) 1 2 3 4 . . 18 19 20 21 22 . . 60 61 62 . . 81 82 83 Object DNS TCP Connect TTFB Download Time
(a) Real Browser
0 1000 2000 3000 4000 5000 Duration (ms) 1 2 3 4 . . 18 19 20 21 22 . . 60 61 62 . . 81 82 83 Object DNS TCP Connect TTFB Download Time (b) Mirage
Figure 1: Comparison of a real browser (from
webpagetest.org) with Mirage for www.ebay.com;
some objects are omitted. The browser optimizes object retrieval differently, and also retrieves more objects. Still, the performance bottlenecks are similar for both.
compose the overall page load time into the download times for in-dividual objects. Mirage separates the page load time into the time to perform DNS lookups, the time to first byte (which combines the TCP connection time and the server processing time), and the actual load time for each object. It uses persistent TCP connections if the server supports them and up to eight parallel TCP connec-tions to download objects. Because Mirage uses many of the basic network optimizations that a browser uses including persistent TCP connections and parallel TCP connections, it approximates the that a real browser might see, even though it does not emulate any par-ticular browser. Table 1 shows the performance metrics for each download and how the performance measurements from Mirage compare to those from webpagetest.org.
Mirage is ideal for our goal of studying the effect of the charac-teristics of broadband access networks on Web performance for a number of reasons. First, because Mirage can be deployed directly on home routers, it provides measurements from a single platform that is directly connected to the access link, thereby normalizing some of the effects that might otherwise affect page load times (e.g., the use of different browsers, home network effects). Second, Mirage is already in use in the large FCC/SamKnows deployment, which provides longitudinal measurements of the same set of di-verse access links. Because Mirage breaks down each object into its constituent parts, it exposes important performance bottlenecks in access networks. Finally, Mirage is freely available and portable; we have used Mirage in our own BISmark deployment.
4.1.2
Validation
Comparing Mirage to real browser behavior. Mirage’s behav-ior differs from a browser in several ways. We explain these dif-ferences using the example download in Figure 1. This figure shows the partial breakdown of the page load time for Ebay both using a real browser through webpagetest.org and Mirage. First, Mirage waits to download the home page before processing it and downloading subsequent objects; in contrast, many modern browsers start downloading objects as they process the home page. This difference is visible in objects 2–4 in Figure 1, where the real
CNN
Wikipedia Facebook Yahoo Google Amazon Ebay MSN Youtube
0 500 1000 1500 2000 2500 3000 3500 4000
Page load time (ms)
Mirage Phantomjs
Figure 2: Comparison of Mirage to Phantomjs. We see that Mirage underestimates the page load times: real load times are higher than what we measure.
browser initiates the download before object 1 is complete. Mirage also performs DNS queries for all the unique domains after parsing the home page before downloading any of the remaining objects; it adds the maximum DNS time to the total time to download the objects. Although Mirage performs the DNS queries before down-loading any objects, the effect on total page load time is not signifi-cant. The time to retrieve each individual object and the time spent on each component of the object retrieval is nearly identical for the case of the real browser and Mirage.
Mirage also downloads a slightly different, smaller set of objects than a real browser. Modern Web sites, especially content-heavy ones, employ active scripts. These scripts result in additional pro-cessing latency and also frequently result in the browser download-ing more objects. Mirage only processes static objects, so it down-loads a subset of the objects that are downloaded by a real browser, usually resulting in a smaller page load time than a normal browser would see. For example, in Figure 1, the browser downloads 83 objects, while Mirage downloads 62 objects.
Validation with Phantomjs. To understand how the differences between Mirage and a real browser affect overall page load time, we compare Mirage’s measurements to those of a real browser en-vironment. For this comparison, we use Phantomjs [48], a head-less client that implements the Webkit browser engine and has a JavaScript API. Phantomjs is used extensively for Web benchmark-ing and testbenchmark-ing [49].
Figure 2 shows the median page load time of Mirage and Phan-tomjs for an emulated 10 Mbits/s access link with a last-mile la-tency of 40 ms; the results also hold for lower lala-tency (10 ms) links. Mirage always underestimates the actual page load time because it downloads fewer objects than a real browser would. Depending on the amount of dynamic content on the site, the difference may vary: in some cases, Mirage underestimates load times by up to 50%; in others, its measured page load time is close to the load time that Phantomjs sees.
The implementation differences between Mirage and real browsers imply that the page load times that Mirage sees may not reflect the times that any real browser would see. Yet, page load times will always differ across different browsers, and we do not aim to estimate page load time from any particular browser. Our goal is to illustrate how components of network latency (e.g., DNS lookup time, TCP connect time) contribute to Web page load times. Mirage decomposes Web page load time into these components, which will be the same regardless of browser or any optimizations that a browser might perform. Mirage also allows us to evaluate how optimizations that a browser might perform can mitigate
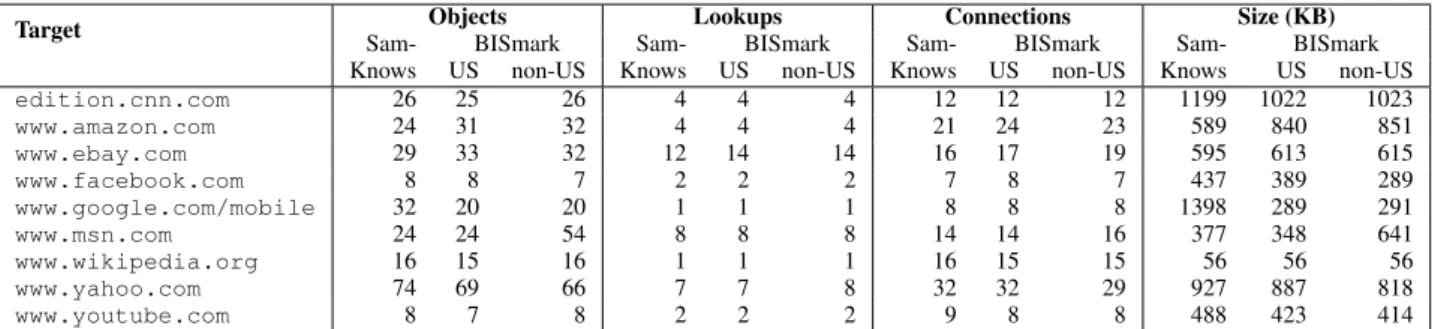
vari-Target Objects Lookups Connections Size (KB) Sam- BISmark Sam- BISmark Sam- BISmark Sam- BISmark Knows US non-US Knows US non-US Knows US non-US Knows US non-US edition.cnn.com 26 25 26 4 4 4 12 12 12 1199 1022 1023 www.amazon.com 24 31 32 4 4 4 21 24 23 589 840 851 www.ebay.com 29 33 32 12 14 14 16 17 19 595 613 615 www.facebook.com 8 8 7 2 2 2 7 8 7 437 389 289 www.google.com/mobile 32 20 20 1 1 1 8 8 8 1398 289 291 www.msn.com 24 24 54 8 8 8 14 14 16 377 348 641 www.wikipedia.org 16 15 16 1 1 1 16 15 15 56 56 56 www.yahoo.com 74 69 66 7 7 8 32 32 29 927 887 818 www.youtube.com 8 7 8 2 2 2 9 8 8 488 423 414
Table 2: Properties of the Web sites in our data set. The values represent the average of the parameters over all transactions. Objects
denotes the number of objects that must be downloaded;lookups are the number of DNS lookups required; and connections are the number
of unique TCP connections the client set up to download all objects in the page. The number of connections depends on whether the server
supports persistent connections, whether the objects are located on one or more domains, and the order in which objects are retrieved.Size
denotes the number of bytes for all of the objects for a site.
ISP Number of Avg. last-mile Avg. downstream homes latency (ms) tput (Mbits/s)
AT&T 718 18 8.7 Cablevision 209 6 34.1 CenturyLink 248 23 5.8 Charter 579 7 27.4 Comcast 932 8 22.8 Cox 618 7 21.2 Mediacom 242 14 18.7 TimeWarner 952 8 16.0 Qwest 299 30 10.0 Verizon 608 5 38.0 Windstream 251 20 5.9
Table 3: The SamKnows deployment in the US.
Location # of Avg. last-mile Avg. downstream homes latency (ms) tput (Mbits/s)
US 43 12 24.2
Europe 3 24 8.3
N. Amer. (non-U.S.) 3 15 5.5 E. Asia/Australia 4 3 46.5 Southeast Asia 8 12 5.7
Table 4: The BISmark deployment across the world.
ous network bottlenecks under different network conditions. When we evaluate the effects of different optimizations in Section 7, we again “close the loop” by showing that the benefits as predicted by Mirage are realized, even from a browser that is already performing its own optimizations.
4.2
Deployment
We use data from the FCC/SamKnows deployment, spanning 5,556 homes in the US; and the BISmark deployment, spanning 61 homes across the world. For both deployments, we use Mirage to characterize nine sites as chosen by SamKnows/FCC. Because it is difficult to measure a large number of Web sites from home routers and constrained access links, we focus on nine of the most popular sites around the world. Table 2 shows the sites that we measure and their properties. All of the measurements from both deployments are public. In some cases, the properties of the sites are differ-ent across deploymdiffer-ents. Because both deploymdiffer-ents use the same tool, these differences may result from either the vantage point or the time that the measurements were conducted. Because we do
Page load times for users outside the US are significantly higher for many sites; these higher times result mostly because of higher latencies to these sites.
§5.1, Fig. 3
Page load times stop improving beyond a downstream throughput of about 16 Mbits/s. For higher throughputs, latency is the performance bottleneck.
§5.2, Fig. 5a
The time to first byte can exceed the object load time in the cases of many small objects and for some pages can be as much as 21% of the page load time. The last-mile latency can be up to 23% of the time to first byte.
§5.3, Fig. 6b
Table 5: Highlights of Section 5 results.
not compare measurements across the two deployments, however, these differences are not consequential.
• We analyze measurements from 5,556 participants in the FCC/SamKnows study across 11 ISPs in the US from October 2011, April 2012, and September 2012. We include only users who have reported more than 100 measurements during the du-ration of the study from ISPs with more than 100 users. Table 3 summarizes the deployment; our previous study describes it in more detail [55]. We report on results from September 2012; the results that we present are consistent with measurements from October 2011 and April 2012.
• We also analyze measurements from the BISmark deploy-ment [51]. Table 4 characterizes the homes in the BISmark de-ployment by region. BISmark-US collects measurements from 44 routers across the US, and BISmark-nonUS collects mea-surements from 18 routers in other parts of the world, in-cluding Europe, North America (exin-cluding the US), and Asia. The BISmark-US data is from May 17–June 7, 2012, and the BISmark-nonUS data is from May 24–June 7, 2012. The URLs are the same for both datasets, and we rely on DNS to locate the local version of a site, if one exists.
5.
CHARACTERIZING BOTTLENECKS
We study page load times for popular sites and evaluate how downstream throughput and latency of an access link affects these times. Table 5 summarizes our results.
We find that latency is a performance bottleneck for Web page load time in access networks whose downstream throughput
ex-CNN
Amazon EbayFacebookGoogle MSNWikipediaYahooYoutube
0 1000 2000 3000 4000 5000 6000
Page fetch time (ms)
(a) SamKnows
CNN
AmazonEbayFacebookGoogle MSNWikipediaYahooYoutube
0 1000 2000 3000 4000 5000 6000
Page load time (ms)
(b) BISmark-US
CNN
AmazonEbayFacebookGoogle MSNWikipediaYahooYoutube
0 1000 2000 3000 4000 5000 6000
Page load time (ms)
(c) BISmark-nonUS
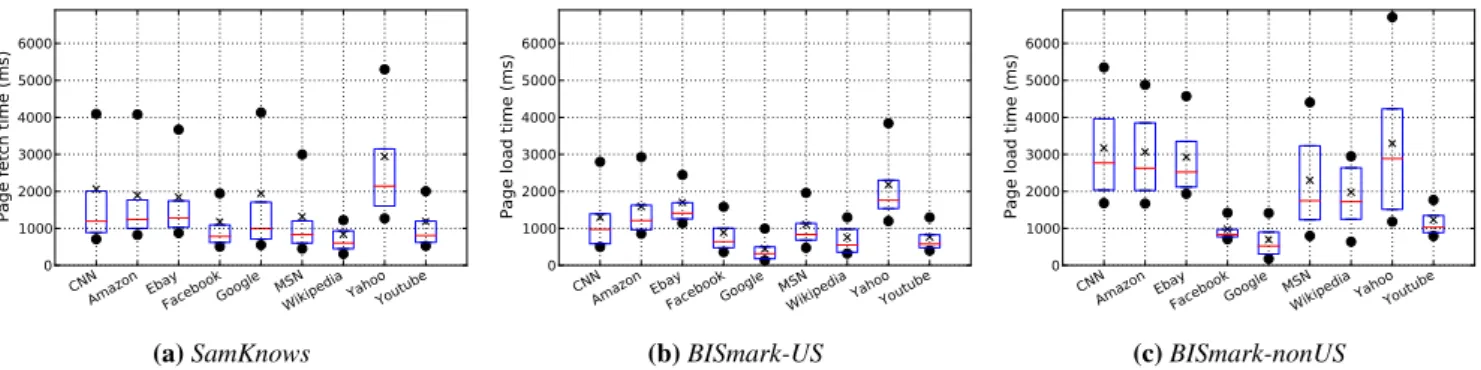
Figure 3: Page load times for popular sites. The lower edge of each box indicates the 25th
percentile of the distribution of page load times
for each site, the upper edge is the 75thpercentile, the middle line is the median, the cross represents the average, and the dots the 10thand
90thpercentile page load times.
ceeds about 16 Mbits/s. Last-mile latency (i.e., the latency between the home network and the first hop in the access ISP) is a significant overall contributor to both DNS lookup times and the time to first byte. Therefore, even when Web caches are deployed at the edge of access ISPs, optimizations in the home network that reduce the effects of last-mile latency can still offer significant performance improvements in page load time.
5.1
Page Load Times of Popular Web Sites
We study the page load times to nine popular Web sites. Fig-ure 3a shows the load times for access links in the SamKnows de-ployment while Figure 3b shows load times for links in the BIS-mark deployment (both in the US). Figure 3c shows page load times for links in the BISmark deployment outside of the US. As expected, page load time varies both by site and the location of the access network. Some variability results from differences in page size and design (see Table 2); the largest four sites (CNN, Yahoo, Amazon, and Ebay) also have the largest load times (e.g., the me-dian for CNN in the US is more than one second).
Figure 3c shows that access links outside of the US typically ex-perience higher page load times for a given site than links in the US. The median and variance is higher for all sites we measure from outside the US, as well. A few sites have different sizes de-pending on the from which the page is requested, but most perfor-mance differences result from the fact that content is farther away from clients that are outside of the US. Figure 4 illustrates this phe-nomenon; the figure shows that the average time to first byte is in general higher in most regions outside the US. Our measure-ments also indicate that the global deployment of content distri-bution networks is somewhat spotty for certain sites. Sites with more expansive CDNs (e.g., Google, YouTube) have low median and maximum page load times, whereas other sites have more vari-able performance, both in the US and abroad. Even Google has relatively poor performance from Southeast Asia; we discussed this phenomenon with network operators at Google, who confirmed that Google’s CDN deployment is not extensive in that region.
5.2
Effects of Downstream Throughput
We study how page load time and its components vary with downstream throughput using measurements from the SamKnows
deployment. We use the 95thpercentile of the distribution of
down-stream throughput over the duration of the measurements for a given user to capture the capacity of each access link. We group access links according to downstream throughput into seven bins that reflect common ranges of Internet access plans in the dataset:
0–1 Mbits/s, 1–2 Mbits/s, 2–4 Mbits/s, 4–8 Mbits/s, 8–16 Mbits/s, 16–32 Mbits/s, and 32–64 Mbits/s. Figure 5a shows the median page load time for each category for five representative sites.
Median page load time decreases as downstream throughput creases, up to about 16 Mbits/s. As downstream throughput
in-creases further, page load times decrease only modestly.For
exam-ple, the median time for CNN is 8.4 seconds for links with through-put 0–1 Mbits/s and 1.3 seconds when throughthrough-put is 8–16 Mbits/s. Yet, when downstream throughput exceeds 32 Mbits/s, the page load time is 790 ms, only slightly better than for links with 8– 16 Mbits/s.
We study how each component of page load time varies with ac-cess link throughput. Page load time is heavily influenced by the maximum DNS lookup time and the maximum time to download a single object (regardless of any caching, parallel lookups, or other optimizations), so we can interpret the maximum times for these values as a lower bound on page load time. Large objects also have a correspondingly lower TCP overhead. Figure 5b shows how these values decrease as throughput increases; each point shows the me-dian value for the group of hosts with the corresponding range of downstream throughput. As downstream throughput increases to 32–64 Mbits/sec, object load time decreases from 3.2 seconds to 530 ms. In contrast, the time to first byte decreases as the through-put of the link increases from 0–1 to 1–2 Mbits/s, but does not improve further for higher values of throughput. DNS lookup time decreases from about 50 ms to about 15 ms. In summary, as down-stream throughput increases beyond 8–16 Mbits/sec, time to first byte and DNS times become a larger component of page load time and depend more on latency than on throughput—even for large objects.
Page load times for clients outside of the US illustrate the effect of latency on page load time. For example, the average page load time for Facebook is 1.7 seconds in southeast Asia, 990 ms in east Asia and Australia, and 924 ms in Europe. Table 4 shows that clients in east Asia have higher average throughput than Europe, but do not necessarily see a corresponding improvement in page load times because latency bottlenecks negate the effects of higher throughput.
5.3
Effects of Last-Mile Latency
Our previous study of access links in the US observed that last-mile latency contributes significantly to end-to-end latencies [55]. To study the effect of last-mile latency on page load times, we group access links into 10 ms bins, according to the 10th percentile last-mile latency. Figure 6a shows the median page load time for
0 1 2 4 8 16 32 Throughput bins (Mbits/s)
102 103 104
Page fetch time (ms)
CNN Ebay Facebook
Google Yahoo
(a) Page load times
0 1 2 4 8 16 32
Throughput bins (Mbits/s)
101 102 103 104
Latency (ms)
Max object download time Max time to first byte Max lookup time
(b) Components of page load time
Figure 5: Page load times decrease with downstream throughput, but only up to 8–16 Mbits/s. X-axis labels denote the start of each throughput bin (e.g., “0” is the set of users with downstream throughput up to 1 Mbits/s.) (SamKnows)
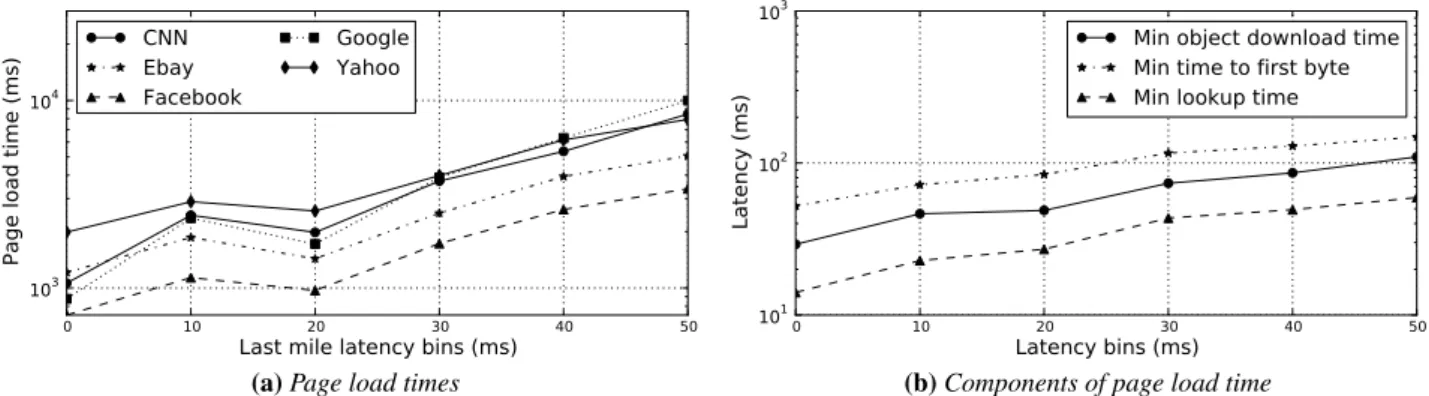
0 10 20 30 40 50
Last mile latency bins (ms)
103 104
Page load time (ms)
CNN Ebay Facebook
Google Yahoo
(a) Page load times
0 10 20 30 40 50 Latency bins (ms) 101 102 103 Latency (ms)
Min object download time Min time to first byte Min lookup time
(b) Components of page load time
Figure 6: Page load times increase with last-mile latency. X-axis labels denote the start of each latency bin. (SamKnows)
Wikipedia Google Youtube
MSN Yahoo Facebook 0 200 400 600 800 1000
Time to first byte (ms)
US Europe NA (exc. US)
E Asia/AU SE Asia
Figure 4: Average time to first byte to six representative sites from BISmark clients broken down by location.
each group for five representative sites. In general last-mile latency has a multiplicative effect on page load time, which is intuitive be-cause it affects all packets in the transaction. The increase we see is not monotonic because other factors such as downstream through-put also affect page load time and some groups have more links than others: 75% of links have less than 10 ms last-mile latency. Even accounting for differences in throughput, an increase in last-mile latency of only 10 ms can result in a few hundred milliseconds increase in page load time. Increasing downstream throughput
be-yond 16 Mbits/s yields only marginal improvements, but decreas-ing last-mile latency can have a larger impact on page load time.
To understand the overhead of TCP on small objects, we look at the minimum object download time and compare it to the min-imum time to first byte and DNS lookup time. Figure 6b shows the median of each of these values for each group of links. For smaller objects, the time to establish the TCP connection to the server is often greater than the time to actually transfer the object. Although the effect is magnified in smaller objects, we saw that it exists across all objects; in fact, we found that the average time to first byte ranges from 6.1% (for Yahoo) to 23% (for Wikipedia) of the total page load time. We also observed that last-mile latency can be as much as 23% of the time to first byte.
5.4
Conclusion: Optimize Latency
The results in this section suggest that for the increasing number of homes that have downstream throughput above 16 Mbits/s, the most effective way to reduce Web page load time is to focus on reducing latency as much as possible.
Improving Object Fetch Time. Because most pages have many objects, the time to download all of them can dominate other fac-tors when downstream throughput is small. Links with less than 16 Mbits/s will thus benefit the most from content caching. For links with higher downstream throughput, however, reducing ob-ject download time is less important than reducing latency. Thus, intuition suggests that faster access links can realize significant im-provements in Web page load time simply by caching DNS records
and TCP connections, without even having to cache any content. Our evaluation in Section 6 confirms this intuition.
Improving DNS Lookup Time. Figure 6b shows that minimum lookup time increases as last-mile latency increases. Minimum lookup times are about 15 ms, and they increase as the last-mile latency increases. The only approach to eliminate the last-mile la-tency is to cache DNS records inside the home itself. Even when the resolver is well-placed in the access ISP network, DNS lookup latencies are bound by last-mile latency (previous work confirms this observation [3]).
Improving Time to First Byte. Optimizations in the home net-work cannot improve server processing time, but they can improve TCP connection setup time. The connection setup time depends on the round-trip latency to the server. Web service providers use content distribution networks to place servers as close to users as possible. Figure 4 shows that servers are in general closer to homes in the US, but even users in the US can experience slowdowns in TCP connection setup time due to the last-mile latency. Client-side optimizations such as connection caching [31] can reduce this latency by maintaining TCP connections to popular sites, thereby reducing overhead for new connections.
6.
THE CASE FOR HOME CACHING
We use Mirage to evaluate the benefits of DNS caching, TCP connection caching, and content caching in a home network. Al-though the optimizations that we evaluate are well known, the placement of these optimizations in the home router is new. Our analysis in this section offers two important contributions: (1) It is the first study to quantify the benefits of deploying them in the home network, where many users now access Web content; (2) To our knowledge, it is also the first study to quantify both the rela-tive benefits to DNS caching, TCP connection caching, and con-tent caching across a large number of popular sites and the holistic benefits of performing all three optimizations together.
Table 6 summarizes the main results in this section. Perhaps the most important takeaway from this section is that optimiza-tions that reduce latency can significantly reduce page load time, even if content caching is not used. This result offers good news, since so much Web page content is dynamic, and since caching a large amount of content on end-hosts or inside home networks may prove infeasible. This finding also emphasizes the importance of placing optimizations inside the home network, since even the last-mile access link can introduce additional latency on the order of tens of milliseconds [55]. Similar optimizations already exist in the browser; we explain how a home cache provides additional benefits beyond browser-based optimizations in Section 7.
6.1
Experiment Setup
We develop a controlled experiment to investigate how de-ploying three different caching optimizations in the home—DNS caching, TCP connection caching, and content caching—contribute to reducing page load time. We use the BISmark deployment de-scribed in Section 4 for our measurements. Mirage runs on the BIS-mark router; it uses a locally running DNS resolver and an HTTP
proxy. dnsmasq is a lightweight caching DNS resolver [27]
that caches up to 150 domains and honors the TTL values of the lookups. To evaluate TCP connection and content caching, we use polipo, a HTTP proxy that splits the TCP connection by open-ing a connection to the requested domain on behalf of the client and communicates with the client over a separate connection and
Performing DNS caching inside the home can improve maximum lookup times by about 15–50 milliseconds, com-pared to simply relying on the ISP’s DNS resolver.
§6.2, Fig. 7
Connection caching reduces median page load time by 100–750 milliseconds depending on the Web site.
§6.2, Fig. 8
Placing a content proxy inside the home versus in a nearby network improves median page load times between 150 and 600 milliseconds, depending on the site.
§6.3, Fig. 10
Applying all three optimizations together can reduce Web page load times by up to 60% at the router.
§6.4, Fig. 11
Table 6: Highlights of Section 6 results.
Measurement Proxy Location DNS Conn. Content Baseline Measurements
No Proxy, ISP DNS —
Cold Home Proxy — •
ISP Proxy Network • • • Optimizations
Home DNS Home • Home Conn. Caching Home • •
Home Proxy Home • • •
Table 7: The measurements we perform to evaluate the benefits of DNS, connection, and content caching in the home.
reuses TCP connections where possible. We run polipo with a 4 MByte cache in RAM.
Measuring Baseline Performance. Table 7 illustrates how we measure baseline performance and compare it with performance for each optimization. To measure the three baseline performance measurements, the client first performs the following three sets of requests:
1. ISP DNS Cache (“No Proxy, ISP DNS”). The client clears the local DNS cache and fetches the page directly from the server. This measures the baseline performance of fetching the Web page. The DNS lookups required for this measure-ment may reflect caching in the ISP’s DNS resolver. 2. Empty Caching Proxy in the Home (“Cold Home
Proxy”). The client fetches the same page by
direct-ing the request through a fresh polipo instance runndirect-ing in the router. Because polipo’s cache is empty at this point, this measurement reflects the performance of a “cold” proxy. This step takes advantage of any DNS caching that
dnsmasqperforms in the previous step.
3. Shared ISP Caching Proxy (“ISP Proxy”). We cannot con-trol a Web cache in a real ISP’s network, so we approximate the behavior of an ISP cache by deploying a caching proxy in our university network. To measure the benefits of perform-ing DNS, connection, and content cachperform-ing at a shared proxy (the most common setup for content caches), the client first fetches the page through a polipo proxy running on a uni-versity server to warm the cache. It then immediately repeats the step. We perform the measurements from eleven BIS-mark routers that are less than 35 ms away from the proxy, so that it emulates nearby ISP caches.
Quantifying the Benefits of Caching in Home Networks. Af-ter collecting the baseline measurements, the client then performs
three additional requests to measure the relative benefit of perform-ing different optimizations in the home.
4. Home DNS caching only (“Home DNS”). The client
fetches the same page directly from the servers. This
measures the benefits of DNS caching in the home (since
dnsmasqcaches the DNS responses from earlier
measure-ments).
5. Home proxy with DNS caching, persistent connections, and content caching (“Home Proxy”) The client fetches the page through the local polipo again; this measurement takes advantage of DNS, content and connection caching, since the proxy would have cached any cacheable objects and reused TCP connections where possible from the requests in the “Cold Home Proxy” experiment.
6. Home proxy with DNS caching and persistent connec-tions only (“Home Connection Caching”) The client clears the polipo cache on the home router — this gets rid of the content in the cache, but keeps the TCP connections from the previous step alive. It then fetches the page through the proxy again. All content is retrieved again from the origin service, but the TCP connections from the previous step are reused. These experiments allow us to isolate the effects of (1) the rela-tive benefits of performing DNS, connection, and content caching inside the home network and (2) placing a cache inside the home versus elsewhere (e.g., in the ISP).
6.2
Effects of Home Caching on Latency
Benefits of DNS caching in the home vs. in the ISP. To quantify the benefits of DNS caching in the home, we compare the max-imum lookup time for the Home DNS Cache and No Proxy, ISP
DNScases. Figure 7 shows the CDF of the improvement in the
maximum lookup time for the page load. In the median case, DNS caching in the home reduces the maximum lookup time by 15– 50 ms, depending on the site. Certain clients outside the US can re-duce their lookup time by several hundred milliseconds for certain sites like Ebay and CNN by caching DNS responses in the home. For a small fraction of cases, DNS caching in the home actually slightly impairs performance; in these cases, the detriment in small and may result from changes in network conditions between exper-iments (this effect occurs for some of our TCP connection caching and content caching experiments, too).
Benefits of TCP connection caching in the home. Figure 8 shows the additional improvement in page load time due to connection caching by measuring the difference between the load times for the Home Connection Caching and the Home DNS Cache mea-surements. The median improvement varies from 100–750 ms de-pending on the site. Ebay and Yahoo experience the most improve-ment in load times because both sites require many objects from many domains to render; connection caching can significantly re-duce TCP overhead in such cases.
6.3
Effects of Home Caching on Throughput
Benefits of content caching vs. connection caching. Figure 9 shows the improvement in page load time due to content caching over connection caching. We compute the improvement by sub-tracting the page load time for the Home Proxy experiment from that for the Home Connection Caching experiment. Caching con-tent inside the home can decrease median page load times in the US by 75–400 ms over connection caching, depending on the site. Ob-viously, sites with more cacheable content will benefit more. Our
−100 −50 0 50 100 150 200 250 300
Difference in maximum lookup time (ms)
0.0 0.2 0.4 0.6 0.8 1.0 CDF CNN Amazon Ebay Facebook Google MSN Wikipedia Yahoo Youtube
Figure 7: Caching DNS in the home can reduce the maximum DNS lookup time by 15–50 ms. (Home DNS Measurement vs. No Proxy, ISP DNS Measurement)
0 500 1000 1500 2000
Difference in page load time (ms)
0.0 0.2 0.4 0.6 0.8 1.0 CDF CNN Amazon Ebay Facebook Google MSN Wikipedia Yahoo Youtube
Figure 8: Connection caching in the home can reduce median page load times by 100–750 ms.(Home Connection Proxy vs. Home DNS Measurements)
analysis shows that this benefit is even more significant for clients outside the US; at least 20% of clients experienced an improvement of 500 ms or more for all sites.
Benefits of content caching in the home vs. in the ISP. We com-pare the Web page load time when using a remote HTTP proxy (the ISP Proxy measurement from Table 7) versus using a local HTTP proxy running on the router (the Home Proxy measurement). Figure 10 shows that a proxy in the home can offer a median im-provement in page load time of 150–600 ms, depending on the site. Yahoo and CNN experience the most benefits, likely because these pages are larger and have many objects (Table 2). A cache in the upstream ISP is still constrained by the access link’s throughput and last-mile latency, while a local cache is not. For some sites, the re-mote proxy performs better than the home proxy about 20% of the time, perhaps because of varying access link characteristics across tests (due to cross traffic) or because the proxy is in a university network that potentially has better connectivity to these sites.
6.4
Putting It Together
We now quantify the collective benefit from performing all three optimizations. We use Mirage’s No Proxy, ISP DNS measurement
0 200 400 600 800 1000
Difference in page load time (ms)
0.0 0.2 0.4 0.6 0.8 1.0 CDF CNN Amazon Ebay Facebook Google MSN Wikipedia Yahoo Youtube
Figure 9: Content caching reduces the median page load time by 75–400 ms over connection caching alone. For sites with more cacheable content, the benefit is greater (Home Proxy vs. Home Connection Caching Measurements)
−500 0 500 1000 1500 2000
Difference in page load time (ms)
0.0 0.2 0.4 0.6 0.8 1.0 CDF CNN Amazon Ebay Facebook Google MSN Wikipedia Yahoo Youtube
Figure 10: Running a proxy in the home improves median page load times by 150–600 ms versus running a proxy in the ISP. (Home Proxy vs. ISP Proxy Measurement)
as the baseline. We compute the relative improvement as (b − v)/b, where b is the baseline load time and v is the optimized load time.
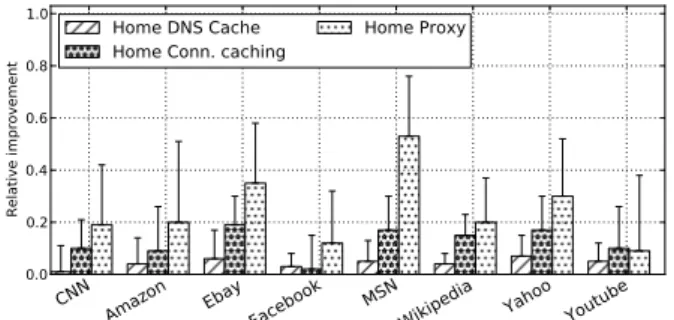
Figure 11a shows the relative improvement of each optimization relative to the baseline of performing no optimizations in BISmark-US. Applying all three optimizations improves page load time by as much as 60%. Even without content caching, connection caching can yield up to a 35% improvement in load time, and DNS caching
alone can improve page load time by as much as 10%.Figure 11b
shows the relative improvement for clients outside the US. The im-provement is slightly less than for the users within the US because the absolute page load times for users outside the US are already higher (Figure 3). The variance is also higher because of the wide range of operating conditions outside the US (Table 4 and Figure 4). The improvements we measure represent the best-case scenario be-cause the quick succession of Web page retrievals will always in-duce a cache hit at the router. In the next section, we explore how to design a cache in the home that achieves high cache hit rates in practice.
CNN
Amazon Ebay Facebook Google MSN
Wikipedia Yahoo Youtube
0.0 0.2 0.4 0.6 0.8 1.0 Relative improvement Home DNS Cache Home Conn. Caching
Home Proxy
(a) BISmark-US
CNN
Amazon Ebay Facebook Google MSNWikipedia Yahoo Youtube
0.0 0.2 0.4 0.6 0.8 1.0 Relative improvement Home DNS Cache Home Conn. Caching
Home Proxy
(b) BISmark-nonUS
Figure 11: Average relative improvement in page load times for
various optimizations, as observed from therouter. Error bars
denote standard deviation.
7.
HOME CACHING IN PRACTICE
The previous section demonstrated how home caching can im-prove page load times in the best-case scenario, but the results measured the benefits in isolation from other optimizations (e.g., browser caching) and also assumed that these cache hits could be realized in practice. Thus, our experiments from Section 6 raise two questions:
1. How can users inside a home network practically realize
cache hits on a home cache? Prefetching DNS queries and
maintaining open TCP connections to all sites visited by a user is not practical. To intelligently determine which DNS records and TCP connections to cache, we implemented a lightweight router-based popularity-based prefetching sys-tem that prefetches and caches DNS records and maintains active TCP connections to popular domains to help im-prove cache hit rates. We analyzed cache hit ratios resulting from this system with a trace-driven simulation using passive traces collected from twelve homes. (Section 7.1)
2. Are the performance benefits that home caching offers signif-icant, in light of the fact that browsers already perform some
amount of caching and prefetching?To answer this question,
we retrieve Web pages from a laptop in a home network us-ing Phantomjs under a variety of emulated access link char-acteristics with various caching optimizations enabled on the home router. (Section 7.2)
Our results indicate that popularity-based prefetching can comple-ment existing browser optimizations.
7.1
Popularity-based Prefetching
We design, implement, and evaluate a popularity-based caching
and prefetchingsystemthat prefetches DNS records and keeps TCP
connections to Web servers active based on the sites that users in the household visit most frequently. We develop a proof-of-concept OpenWrt module, which is publicly available [50]. The system consists of (dnsmasq) and (polipo), instrumented to track pop-ular DNS lookups and HTTP domains respectively. The system tracks popularity and refreshes DNS lookups and maintains an ac-tive TCP connection to popular domains by using a simple caching mechanism. The system aims to maximize the hit rate of the DNS and TCP connection caches. The two parameters that affect the hit rate are (1) the number of domains to be tracked: the system ac-tively prefetches DNS records and maintains active connections to these domains; the system maintains the two lists separately; and (2) timeout thresholds: the system tracks the time since a lookup or a TCP connection was requested to a domain and removes the domain from the popular list if this time exceeds a threshold. The system does not prefetch content but exploits any content caching that polipo performs by default.
Does popularity-based prefetching improve Web page load times in homes? To analyze whether popularity-based prefetch-ing can improve performance, we perform a trace-based simulation using real browsing activity in home networks, with optimizations enabled and disabled. We capture Web browsing activity of users from routers deployed in twelve homes in the US for the period October 15–31, 2012 to evaluate the potential improvements from proactive DNS and connection caching in home networks. We cap-ture DNS and HTTP traffic. We record the timestamp, hashed do-main, and TTL of all resolved DNS responses. Each HTTP flow event has a timestamp of all connections, hashes of their corre-sponding IP addresses, flow duration, and TCP connection time. To preserve user privacy, we do not capture packet payloads, so we do not evaluate cache hit ratios for content.
Using these traces, we run a trace-driven simulation that main-tains the DNS cache using the timestamp, hashed domain, and TTL of resolved DNS responses from the trace. When prefetching a domain, the simulation delays each incoming DNS response by a random interval between 50 and 200 ms; the TTL value is set ac-cording to the value in the trace. Requests for domains waiting for a DNS response are considered cache misses. To characterize the benefit of TCP connection caching, the simulation maintains the TCP connection cache based on the timestamp, five-tuple flow identifier, and duration of both the entire TCP connection and its connection establishment of all port 80 requests from the passive traces. For each new request, the simulation compares it with the entries in the connection cache. In the event of a cache miss, or when a connection to an IP address is in use by another request, we establish a new connection with the flow and TCP connection es-tablishment durations that correspond to the TCP connection in the trace. Upon a cache hit, the simulation denotes the cache entry to be in use for the duration of TCP connection minus the connection establishment time to that IP.
Baseline DNS cache hit rates without popularity-based prefetch-ing vary from 11–50%, dependprefetch-ing on the home; the baseline cache hit ratio for TCP connection ranges from 1–8% across homes. Set-ting a cache size of 20 and a timeout threshold of 120 seconds for both DNS and connection prefetching causes DNS hit ratios im-prove to 19–93%, representing at least a 40% imim-provement over the baseline in every home. Connection cache hit ratios increase to 6–21% across homes. These results show that popularity-based
CNN
Amazon EbayFacebook MSNWikipedia Yahoo Youtube
0.0 0.2 0.4 0.6 0.8 1.0 Relative improvement Home DNS Cache Home Conn. caching
Home Proxy
Figure 12: Average relative improvement in page load times for
various optimizations, as observed from thebrowser. Error bars
denote standard deviation.
prefetching for only a few sites and with a short timeout can signif-icantly improve performance.
7.2
Benefits of Home Caching from Browsers
We evaluate the benefit of home caching as seen from a browser by analyzing the improvement in page load times from Phantomjs with various caching optimizations enabled. We measure page load times from a Web browser using Phantomjs running on a Linux lap-top that is connected through a wired link to a Netgear home router; the router shapes the uplink to represent different home network throughputs and latencies. We use two settings for the downstream throughput of the access link (10 Mbits/s and 20 Mbits/s) and three settings for the latency of the access link (0 ms, 20 ms, and 40 ms). We download each of the sites 25 times for each setting. These parameters approximate common access-link throughputs and last-mile latencies. The router also runs popularity-based prefetching, discussed in Section 7.1.
Home caching complements browser optimizations. Figure 12 shows the relative improvement in Web page load times as a result of deploying various caching optimizations from a home router, as observed from the laptop running Phantomjs. Because we had problems with Phantomjs using polipo for Google, we omit re-sults for it. DNS caching improves page load times by as much as 7%; connection and DNS caching improve load times by about 20%; all three optimizations together reduce load times by as much as 60%, depending on the site. The benefits as measured using Phantomjs are lower, but they are comparable to what we observe at the router in Figure 11. Although the improvements in page load time that a browser realizes obviously depends on many factors, our results demonstrate that home caching complements existing optimizations that browsers already perform.
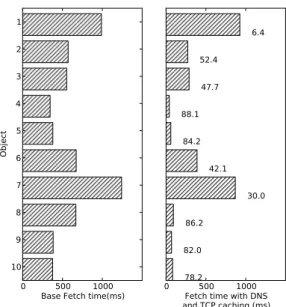
To further illustrate these benefits, we show the page load time for Ebay, for a single experiment. Figure 13 shows how DNS and TCP connection caching improves per-object downloads. It shows the time to download the first ten objects of the site using Phan-tomjs. We measure the total time for the first ten objects. The left plot shows the baseline case without optimization, and the sec-ond plot shows the benefits that the browser observes when the home router performs DNS and connection caching. We observe an 6.4% reduction in page load time for the home page alone when the home router performs both DNS and TCP caching. The im-provements are relatively more significant for smaller objects. The numbers next to the objects show the percentage improvement in the baseline. All objects show some improvement; objects that are cacheable see more improvement.
0 500 1000 Base Fetch time(ms) 10 9 8 7 6 5 4 3 2 1 Object 0 500 1000 Fetch time with DNS and TCP caching (ms) 6.4 52.4 47.7 88.1 84.2 42.1 30.0 86.2 82.0 78.2
Figure 13: The time to load the first ten objects for Ebay using Phantomjs. We plot the total download time for the first ten objects. The first plot shows the breakdown for the base case; the second when there is DNS and TCP connection caching. The numbers in the second plot denote the percentage improvement over the base case.
8.
CONCLUSION
We presented the first large-scale study of Web performance bot-tlenecks in broadband access networks. We first characterize per-formance to nine popular Web sites from 5,556 access networks using Mirage, a router-based Web measurement tool, and identify factors that create Web performance bottlenecks. Regardless of the optimizations that clients, servers, and browsers may perform, the access link is a fundamental limit to the efficacy of optimizations. As throughput increases, latency becomes more important, to the extent that even having caches on the edge of ISPs could prove to be insufficient. We show that Web page load times stop improving as throughput rates increase beyond 16 Mbits/s. We also show that last-mile latency contributes to the time required for performing DNS lookups, completing TCP connection setup, and download-ing Web objects and can be up to 23% of the time to first byte.
Moreover, we evaluate techniques to mitigate latency bottle-necks by implementing home caching, which performs DNS and TCP connection caching and prefetching inside the home network. We demonstrate that home caching can improve Web performance, even if the ISP and browser are already independently performing similar optimizations. TCP connection caching alone can improve Web page load times by up to 20%, depending on the site. Per-forming all three optimizations together from the home router can reduce page load times by up to 53%.
Although the optimizations we describe can be implemented anywhere in the home network, we believe that the home router is a reasonable location for caching and prefetching DNS records and TCP connections. In addition to further reducing page load times, even in the presence of similar optimizations that browsers already implement, it is worth noting that there are many Web-based applications that do not run from a standard browser. Any device in the home network that retrieves Web content can benefit
from home caching. Indeed, as Singhal and Paoli state, “apps—not just browsers—should get faster too” [52]. Our publicly available OpenWrt module for popularity-based prefetching may serve as yet another important component for reducing page load times in home networks.
Acknowledgments
This research was funded in part by NSF award CNS-1059350, a Google Focused Research Award, and the European Community’s Seventh Framework Programme (FP7/2007-2013) no. 258378 (FI-GARO). We would like to thank the Federal Communications Commission and SamKnows for access to the data. We would also like to acknowledge BISmark volunteers worldwide for supporting the platform.
REFERENCES
[1] Tel-Aviv, Israel, Mar. 2000. [2] Berlin, Germany, Nov. 2010.
[3] B. Ager, W. Mühlbauer, G. Smaragdakis, and S. Uhlig. Comparing dns resolvers in the wild. In Proceedings of the 10th annual conference on Internet measurement, IMC ’10, pages 15–21, New York, NY, USA, 2010. ACM.
[4] B. Ager, F. Schneider, J. Kim, and A. Feldmann. Revisiting cacheability in times of user generated content. In INFOCOM IEEE Conference on Computer Communications Workshops, 2010, pages 1–6. IEEE, 2010.
[5] A. Akella, B. Maggs, S. Seshan, and A. Shaikh. On the performance benefits of multihoming route control. IEEE/ACM Transactions on Networking, 16(1), Feb. 2008.
[6] A. Akella, B. Maggs, S. Seshan, A. Shaikh, and R. Sitaraman. A measurement-based analysis of multihoming. In Proc. ACM SIGCOMM, Karlsruhe, Germany, Aug. 2003.
[7] A. Akella, J. Pang, B. Maggs, S. Seshan, and A. Shaikh. A comparison of overlay routing and multihoming route control. In Proc. ACM SIGCOMM, Portland, OR, Aug. 2004.
[8] A. Akella, S. Seshan, and A. Shaikh. Multihoming performance benefits: An experimental evaluation of practical enterprise strategies. In Proc. USENIX Annual Technical Conference, Boston, MA, June 2004.
[9] M. Al-Fares, K. Elmeleegy, B. Reed, and I. Gashinsky. Overclocking the Yahoo! CDN for faster Web page loads. In Proceedings of Internet Measurement Conference, 2011.
[10] E. Altman, K. Avrachenkov, and C. Barakat. A stochastic model of tcp/ip with stationary random losses. In ACM SIGCOMM, 2000. [11] M. Arlitt, B. Krishnamurthy, and J. Mogul. Predicting Short-transfer
Latency from TCP arcana: a Trace-based Validation. In Proc. ACM SIGCOMM Internet Measurement Conference, New Orleans, LA, Oct. 2005.
[12] P. Barford and M. Crovella. Critical path analysis of tcp transactions. In IEEE/ACM Transactions on Networking, 2000.
[13] M. Belshe. A Client-Side Argument for Changing TCP Slow Start. http://goo.gl/UDKXz.
[14] M. Belshe. More Bandwidth Doesn’t Matter (much). http://goo.gl/OIv47.
[15] BISmark Web Performance data. http://dl.dropbox.com/ u/13045329/bismark_webperf_data.tar.gz. [16] J. Brutlag. Speed matters for Google Web search.
http://services.google.com/fh/files/blogs/ google_delayexp.pdf, June 2009.
[17] M. Butkiewicz, H. Madhyastha, and V. Sekar. Understanding website complexity: Measurements, metrics, and implications. In Proc. Internet Measurement Conference[2].
[18] R. Caceres, F. Douglis, A. Feldmann, G. Glass, and M. Rabinovich. Web proxy caching: The devil is in the details. June 1998. [19] J. Cao, W. S. Cleveland, Y. Gao, K. Jeffay, F. D. Smith, and
M. Weigle. Stochastic models for generating synthetic http source traffic. In IN PROCEEDINGS OF IEEE INFOCOM, 2004.