HAL Id: hal-01152328
https://hal.archives-ouvertes.fr/hal-01152328
Submitted on 15 May 2015
HAL is a multi-disciplinary open access
archive for the deposit and dissemination of sci-entific research documents, whether they are pub-lished or not. The documents may come from
L’archive ouverte pluridisciplinaire HAL, est destinée au dépôt et à la diffusion de documents scientifiques de niveau recherche, publiés ou non, émanant des établissements d’enseignement et de
expected credits come through?
Alain Cormier, Valentin Bellassen
To cite this version:
Alain Cormier, Valentin Bellassen. The risks of CDM projects: How did only 30% of expected credits come through?. [Research Report] 2012-11, auto-saisine. 2012, pp.173. �hal-01152328�
W
ORKING
P
APER N
°
2012-11
CDC Climat Research is the research department of CDC Climat, a subsidiary of the Caisse des Dépôts dedicated to the fight against climate change. CDC Climat Research provides public
research on the economics of climate change.
The risks of CDM projects: how did only 30% of expected
credits come through?
Alain Cormier and Valentin Bellassen
January 2012
Abstract
The Clean Development Mechanism (CDM), launched in 2001, has attracted more than 7 000 projects. Many however, did not fully deliver the emissions reductions promised in their project design documents: out of 1.8 billion of expected Certified Emissions Reductions (CER) by April 1st, 2011, only 576 million had been issued. This study classifies the risks incurred by CDM projects, attributes a share of the non-delivered CER to each risk, and identifies the most influent factors driving each risk. 29% of expected CER will never be issued due to failure of projects (negative validation, project withdrawn, …), 12% were not issued on time due to delays during the approval process (validation and registration), 27% were not issued on time due to delays at issuance, and only 1% will never be issued due to underperformance of projects in terms of CER delivered per day. Technology is identified as a key driver for all these risks: some technologies are less risky than others. Time is mainly influencing approval process and issuance delay. Other factors such as location, size of the project, auditor or consultant are occasionally important, but not for each risk. Keywords: CDM, risk, technology, host country, CER
Publishing director: Benoît Leguet - ISSN 2101-4663
This publication is fully-funded by “Caisse des Dépôts”, a public institution. CDC Climat does not contribute to the financing of this research.
Caisse des Dépôts is not liable under any circumstances for the content of this publication.
This publication is not a financial analysis as defined by current regulations.
The dissemination of this document does not amount to (i) the provision of investment or financial advice of any kind, (ii) or of an investment or financial service, (iii) or to an investment or financial proposal of any kind.
There are specific risks linked to the markets and assets treated in this document. Persons to whom this document is directed are advised to request appropriate advice (including financial, legal, and/or tax advice) before making any decision to invest in said markets.
The research presented in this publication was carried out by CDC Climat Research on an independent basis. Organisational measures implemented at CDC Climat have strengthened the operational and financial independence of the research department. The opinions expressed in this publication are therefore those of the employees of CDC Climat Research alone, and are independent of CDC Climat’s other departments, and its subsidiaries.
The findings of this research are in no way binding upon, nor do they reflect, the decisions taken by CDC Climat’s operational investment and broking services teams, or by its subsidiaries. CDC Climat is not a provider of investment or financial services.
Contents
1
Introduction
4
2
Material and Methods
5
2.1 Databases 5
2.2 Risk definition and quantification 5
2.2.1 Definition 5
2.2.2 Quantification 8
2.3 Risk factor identification 8
2.3.1 Potential risk factors 8
2.3.2 Determination of key risk factors 10
3
Results
13
3.1 Risk quantification 13
3.1.1 Frequency of risk occurrence 13 3.1.2 Impact on CER issuance as of April 1st, 2011 14
3.2 Risk factor analysis 15
3.2.1 Key factors determining project success 15 3.2.2 Key factors determining approval process delay 16 3.2.3 Key factors determining issuance delay 18 3.2.4 Key factors determining issuance performance 19
4
Discussion
20
4.1 Technology 20
4.2 Project size 21
4.3 Location 21
4.4 Time 22
4.5 Validator, Verifier & Consultant 22
4.6 Other comments 23
5
Conclusion
23
6
Acknowledgements
24
1 Introduction
The Kyoto Protocol introduced greenhouse gas (GHG) emissions reductions objectives for developed countries (Annex B). To help countries meet their objective at the lowest cost, it also introduced three flexibility mechanisms. The Clean Development Mechanism (CDM) is one of them: it allows a project developer who achieves emissions reductions in a non-Annex B country to be rewarded with CDM credits – Certified Emission Reduction (CER) – and to sell these credits on international carbon markets. The credit buyers are either companies that buy credits for compliance under the European Union Trading Scheme (EU ETS), banks, carbon funds or governments.
The planning of the first CDM projects started in 2001, on the basis of the Marrakesh accords (UNFCCC, 2002) which laid down the guidelines governing the mechanism. The CDM has since experienced a remarkable development with CER of an average value of 12.4 €/tCO2e in 2010 (Bluenext, 2011). However a wide selection of literature has identified CDM-specific risks and transaction costs as the major obstacle in attracting private investors and project developers (Michaelowa, 2005; Michaelowa & Jotzo, 2005; UNEP-Risoe, 2005; Guigon, Bellassen, & Ambrosi, 2009).
The issuance of CER is supervised by the CDM Executive Board (EB), an organ of the United Framework Convention on Climate Change (UNFCCC). The CDM life cycle can be broken down into three main steps:
Elaboration of the Project Design Document (PDD): the project developer and/or its consultant write the PDD, an administrative document containing all the relevant project information (methodology used, baseline scenario, stakeholders involved, monitoring plan, location, …).
Approval Process: project approval is divided in two sub-steps, validation and registration. Validation consists in the audit of the project by a Designated Operational Entity (DOE), that is an independent third party accredited by the UNFCCC. The DOE controls the accuracy of the PDD, and its consistency with the relevant methodology and with field observations. The DOE may ask for clarifications or modifications, and eventually issues a positive or negative opinion. Following upon a positive opinion, the last stage of the approval process consists in the positive assessment by the CDM EB of the PDD and the
validation report.
Issuances: after registration, the CDM project can be implemented and issue CER. A first sub-step consist in the on-site verification, by another DOE, of monitored emissions reductions. The second sub-step is the assessment, by the CDM EB, of the verification report.
A project may fail or be delayed at any of the aforementioned stages, which therefore constitutes as many risks. Indeed, as of April 1st, 2011, only 580 million CER had been issued, against 1.9 billion CER initially expected at this date on the basis of compiled PDD estimates (UNEP-Risoe, 2011). Several studies have already assessed the role of the host country as a risk factor in CDM projects (Jung, 2006; Winkelman & Moore, 2011; Wang & Firestone, 2010; Dinar, Rahman, Larson, & Ambrosi, 2008). Very few however have investigated other risk factors such as sector, project size, DOE, … Castro & Michaelowa (2008) conducted such an investigation, yet with
This study brings a new, comprehensive, and quantitative assessment of the risks of CDM projects. In a first part, the risks associated with a CDM projects are identified, classified and quantified. The analysis is based on the CDM project cycle and its different steps, from which intermediate risks are extracted and then regrouped in four major risks. As a result, the 1.3 billion expected CER that were not actually issued by April 1st, 2011, are attributed to one of these four risks. In a second time, an influent-factors analysis is conducted in order to characterize each risk: the key factors explaining risk variation and variance among projects are identified.
2 Material and Methods
2.1 DatabasesOnly free access databases are used. Four databases (Table 1) have been aggregated in one for this study.
Table 1. List of public databases
N.B.: The primary source of these databases is the UNFCCC (http://cdm.unfccc.int/). The study is based on information on each individual project available as of April 1st, 2011.
2.2 Risk definition and quantification 2.2.1 Definition
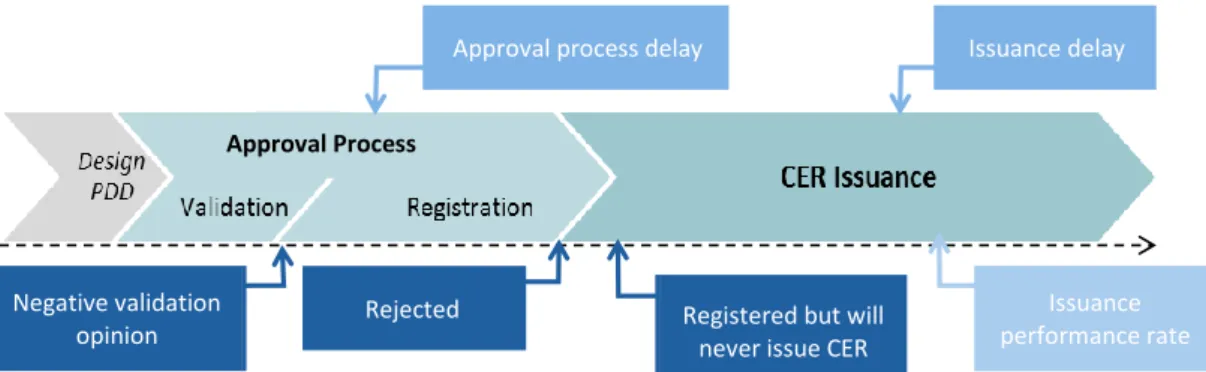
Delays and failures can put a CDM project at risk at all the steps of the CDM process (Figure 1).
Name Institute Source Periodicity Description
CDM Pipeline UNEP
RISOE
http://cdmpipeline.org/ Monthly Lists many elements of a project: host country, technology, date of registration request …
CDM Pipeline IGES http://www.iges.or.jp/en/cdm/r eport_cdm.html
Monthly Similar to UNEP-Risoe, but, in addition, keeps record of changes in the crediting period start date (the one initially planned in the PDD and potential changes after registration). CDM Monitoring and Issuance IGES http://www.iges.or.jp/en/cdm/r eport_cdm.html Every 2 months
Groups all requests for issuance that have been approved by UNFCCC. CDM Review and Rejected IGES http://www.iges.or.jp/en/cdm/r eport_cdm.html Every 2 months
Groups all projects that have been requested for a review, reviewed or rejected, either at registration step or at request for issuance step.
Figure 1. Classification of the risks affecting CDM projects
To improve the clarity of the analysis, similar risks were bundled to yield four overarching risks:
Rejection or non-issuance; Approval process delay; Issuance delay;
Performance.
2.2.1.1 Rejection or non-issuance
This is the risk that a project never issues CER. It may have received a negative opinion at validation, it may be bogged down in validation with no chance of ever receiving an opinion, it may have been rejected at registration step, it may have never been implemented despite having been registered, or it may be denied its request for issuance by the CDM EB.
For the sake of clarity, success rate at each of these steps will be studied instead of
rejection rate ( - ). The different success rates are
defined in Equation 1 to Equation 4. Equation 1
with SRoverall the overall success rate, SRvalidation the success rate at validation, SRregistration the success rate at registration and SRissuance the success rate at issuance. Equation 2
with SRvalidation the success rate at validation, Nval_success the number of projects which passed validation, Nval_ended the number of projects for which validation was ended (either positively or negatively) and Nval_bogged_down the number of “projects bogged down at validation”, defined below. The equation is split in 2 ratios for convenience. The first one is the probability to get a positive validation opinion given that validation is finished. The second one is the probability to don’t be bogged down at validation.
Equation 3
CDM projects life cycle:
Approval Process
Rejected Negative validation
opinion Registered but will never issue CER
Issuance performance rate Issuance delay Approval process delay
with SRregistration the success rate at registration, Nreg_success the number of registered projects and Nreg_ended the number of projects for which registration was ended (either positively or negatively). The number of projects potentially bogged down at the registration stage was overlooked because a decision is usually quickly reached at this stage.
Equation 4
with SRissuance the success rate at issuance, Niss_success the number of projects which have already issued CER and Niss_bogged_down the number of “projects bogged down at issuance”, defined below.
Definition of “bogged down projects”
In this study, “bogged down projects” are defined as projects that are not officially withdrawn from the pipeline, and yet have been abandoned in practice. That means they will never receive a validation opinion – bogged down at validation – or that they have been registered but will never issue CER – bogged down at issuance. In July 2011, the CDM Pipeline (UNEP-Risoe, 2011) introduced a new status “not alive”, corresponding to the few projects clearly identified as bogged down, often through a direct interview with the project developer. In this study, bogged down projects includes all projects likely abandoned, due to an unusually long time spent at the same stage of the project life cycle.
In order to estimate the number of projects which are bogged down at validation, a risks-influent factors analysis (see 2.3 for details on the method) is performed on successfully validated projects to characterize the validation duration. The selected factors are used in a multilinear regression to estimate the expected delay for each project. All projects at validation for longer than this estimated delay plus twice the residuals of the regression are considered to be “bogged down”, i.e. are expected to never terminate the validation step. Provided that the hypotheses of the linear model are verified, a successful project has only a 2.5% chance of passing this date without being successfully or negatively validated. The same method is used to determine the number of projects bogged down at issuance, by summing the estimated monitoring period and the estimated issuance delay, and adding twice the residuals of the overall estimate (Equation 5). Projects bogged down at issuance are registered projects which will never receive any CER.
Only a couple of projects got bogged down at registration, so this term is neglected. Equation 5
2.2.1.2 Approval Process delay
This is the risk of delay before registration. Delay may occur both at the validation and at the registration steps. These delays may stem from the project developer, the DNA, the DOE or the EB. This delay often impacts the start date for the crediting period. The PDD indicates a planned date but eventually, the date of request for registration or the date of registration is retained if they are later than the planned start date of the PDD. The request for registration date is retained if the project requested registration later than December 11th, 2010 and was automatically registered – that without a request for review by the EB. Otherwise, the registration date is retained. Note that projects registered before March 31st, 2007, could claim credits for up to two years before the registration date.
2.2.1.3 Issuance delay
This is the risk related to delay in issuance of CER, once the project was registered. This delay is divided between monitoring delay, corresponding to the duration of the monitoring period, and the certification delay, corresponding to the time between the end of monitoring period and the corresponding issuance. The monitoring delay depends on project developers, who choose their time to verify their project, and the certification delay depends on the DOE, who performs the verification and requests issuance, and the EB who eventually approves the issuance and delivers the credits on the developer’s account.
2.2.1.4 Performance
Projects publish, in the PDD, estimates of the amount of CER they plan on generating at any given time (by year). But the actual amount of CER generated is often different from these initial estimates over the same period of time. Performance risk quantifies this difference. Note that this risk is the only one which may lead to more CER than expected, as some projects over-perform against the initial estimates (a project may under performs if it issues less CER than planned in the PDD over the same period of time or over performs if its estimates was too low).
2.2.2 Quantification
Each risk is quantified with two indicators: frequency of occurrence, that is the number of projects affected, and overall impact on the issuance of CERs as of April 1st, 2011. Note that the different natures of these risks imply different variable types: for example, numeric for a step-duration or boolean for a success probability.
2.2.2.1 Impact on the issuance of CERs as of April 1st, 2011
A theoretical amount of CER expected as of April 1st is computed by summing CERs estimates in the PDDs of all projects up to April 1st. The scenario is limited to the first crediting period of the project. Thus, the end of the theoretical monitoring period is either the end of the crediting period or April 1st, 2011. From this initial estimate, non-issued CER are imputed to each risk according to the following rules:
Non-issued CERs from projects rejected or bogged down at any given step (validation, registration or issuance) are imputed to the corresponding risks. Non-issued CERs from projects not yet registered and delayed CERs
corresponding to the difference between initial and actual crediting period start are imputed to approval process delay.
During the effective monitoring period, non-issued CER are imputed to the performance risk
Finally, the remaining non-issued CERs are imputed to issuance delay. 2.3 Risk factor identification
2.3.1 Potential risk factors
The number of factors explaining the aforementioned risks is potentially large. The current analysis is limited to the factors identifiable in the databases (Table 2). These factors can be quantitative, qualitative or boolean.
Table 2. List of risk factors
The factor “scale”, characterizing the size of a project in expected CER per year, is initially quantitative. Yet, as Castro & Michaelowa (2008) showed that its impact on performance was not linear, we chose to convert it into a qualitative factor, thus allowing a non-linear response (Table 3).
Table 3. Size factor definition
For quantitative factors, each category must contain a minimum number of projects in order to get robust statistical estimates. When necessary, factor categories have been grouped to reach this minimum threshold. This threshold is set to 20 projects per group.
For location, projects are first grouped by host country, then by sub-region (eg. South
America, Sub-Saharan Africa) and finally by region (eg. Latin America including central America, Africa) if necessary. For technology, projects are first grouped by
sub-type (eg. rice husk, mode shift – road to rail), and then if necessary by Type (eg.
biomass energy, transport). For all factors except location and technology, projects
for which the modality cardinal was lower than the threshold, are grouped in a new modality called “others”. The two only exceptions are the technology and dates factors: the 19 HFC projects (that have issued as April 1st, 2011) have their own category, due to the large number of CERs issued by each of these project categories.
Name Description Nature Remarks
Location Host country or continent Qualitative
Technology Sector or sub-sector Qualitative
PDD consultant Consultant used during PDD design step Qualitative
Validator DOE which validates the project Qualitative
Verifier DOE which controls issuance report Qualitative Only available for projects that have already issued Size Size of a project according to definition above Qualitative
Request for review at registration
Probability for a review to be requested before
registration Boolean
Only available for projects that have been registered Review at registration Probability for a review to be conducted before
registration Boolean
Only available for projects that have been registered Request for review of
an issuance request
Probability for a review to be requested before
issuance Boolean
Only available for projects that have already issued Review of an issuance
request
Probability for a review to be conducted before
issuance Boolean
Only available for projects that have already issued Planned crediting
period start date Planned crediting period start date in the PDD
Qualitative (date) Actual crediting
period start date
Actual crediting period start date chosen after registration
Qualitative (date)
Only available for projects that have been registered Validation duration Time between end and start of validation step Quantitative Only available for projects
that have been validated Registration duration Time between end and start of registration step Quantitative Only available for projects
that have been registered First monitoring
duration
Time between end of first monitoring period and
crediting period start date Quantitative
Only available for projects that have already issued First certification
duration
Time between first issuance date and end of first monitoring period date (DOE and EB assessment of an request for issuance)
Quantitative
Only available for projects that have already issued 1
Size Modality Threshold Number of projects in the pipe, as
1st April, 2011
Very Small < 20 kCER per year 1655
Small 20 kCER < … < 50 kCER per year 2131
Average 50 kCER < … < 100 kCER per year 1489
Large 100 kCER < … < 500 kCER per year 1776
Very large 500 kCER per year < 298
Dates are grouped by year, even for the 4 projects which started in 2003. For PDD consultant, when there were several consultants for a single project, only the most experienced consultant – the consultant already involved in the highest number of other projects – is retained.
2.3.2 Determination of key risk factors
The purpose of the determination of key risk factors is to select, for each risk, the factors that best explain the risk in terms of variation and variance. Our method is based on the correlation between risk and factors.
2.3.2.1 Data cleaning
Data cleaning is performed to make sure no obviously wrong data interfere in the statistics (risk-influent factors analysis or regression).
Thus, if a project does not respect the following “common sense” rules, it is not taking into account:
The validation duration must be greater than 1 day;
The registration duration must be greater than 28 days (length of the public comment period, and so the minimum theoretical duration of the validation step); The monitoring period duration must be greater than 1 day;
The certification duration must be greater than 15 days (length of the public comment period and so the minimum theoretical duration of the validation step). Fewer than 1% of the projects are overlooked due to this data cleaning.
2.3.2.2 Correlation matrix
For each risk and its potential key explaining risk factors, a correlation vector is computed. The calculation method for the correlation depends on the type of risk and the type of criteria. Three cases may be distinguished:
Link between 2 qualitative variables (example a success rate X and a host country Y)
The contingency table is formed:
where nij is the number of projects which have both the modality i in the criteria X
and the modality j in the criteria Y. n is the total number of project. s is the number of modalities for Y and m for X.
The Cramer coefficient for the correlation between two qualitative variables is used (Equation 6).
y1 ... ... yj ... ... ys sum
x1 n11 · · n1j · · n1s n1+
... ...
xi ni1 · · nij · · nis ni +
... ...
xm1 nm1 · · nmj · · nms nm+
Equation 6
Note that c varies from 0 (no correlation) to 1 (functionally dependent).
Link between 2 quantitative variables (example the durations X and Y for 2 different steps of the process)
Pearson’s correlation coefficient is used (Equation 7). Equation 7
with is the standard deviation of variable X.
c varies from 0 (no correlation) to 1 (functionally dependent).
Link between one quantitative variable and one qualitative (example a duration Y and a success rate X) (Equation 8)
Equation 8
with the k modalities of the qualitative variable X, the average of the
quantitative variable Y, the averages of Y by modality of variable X, and
the number of projects by modality of variable X. N is the total number of project. c varies from 0 (no correlation) to 1 (functionally dependent).
The more the factor is correlated with the resulting risk variable, the more it is able to explain variation and variance of this risk between projects.
Next, because a lot of factors are analyzed for each risk, some of them will necessarily be largely collinear with one another. The linear model used for multi-linear regressions assumes that factors are independent. Although this is seldom the case in practice, one must try to limit collinearity between factors, as it may lead to wrong results interpretation. In order to measure collinearity between factors, the same calculation than for correlation is used for each factor.
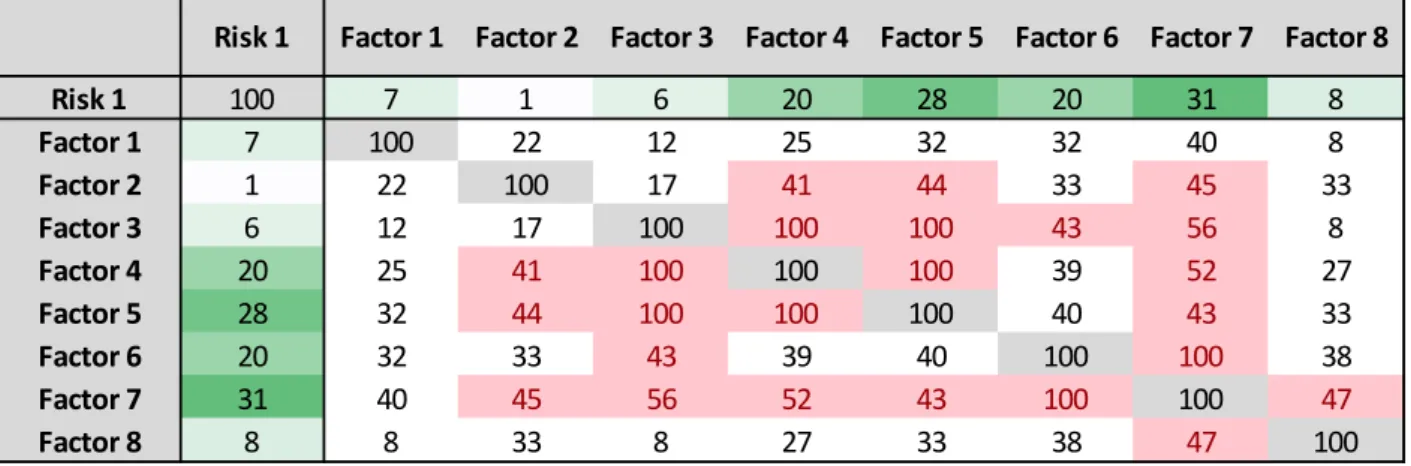
The results of this correlation analysis are presented in a single “correlation matrix” for each risk. An example is presented in Table 4.
Table 4. Correlation matrix example
Risk 1 Factor 1 Factor 2 Factor 3 Factor 4 Factor 5 Factor 6 Factor 7 Factor 8
Risk 1 100 7 1 6 20 28 20 31 8 Factor 1 7 100 22 12 25 32 32 40 8 Factor 2 1 22 100 17 41 44 33 45 33 Factor 3 6 12 17 100 100 100 43 56 8 Factor 4 20 25 41 100 100 100 39 52 27 Factor 5 28 32 44 100 100 100 40 43 33 Factor 6 20 32 33 43 39 40 100 100 38 Factor 7 31 40 45 56 52 43 100 100 47 Factor 8 8 8 33 8 27 33 38 47 100
Factor 1 is correlated to Risk 1 at 7% for example. Factor 2 and Factor 1 are 22 % collinear. Cells in red, at the intersection of two factors, means they are over 40% collinear.
2.3.2.3 Determination
Based on the correlation matrix, three criteria are applied to determine the key risk factors:
The correlation between the risk and the factor is higher than 15%;
The collinearity between two key factors is lower than 40%. When two key factor have a larger degree of collinearity, only the most strongly correlated with the risk is retained;
Expert judgment is used to check the “common sense” of these criteria and to make exceptions when warranted. Only 2 exceptions are made, and they are clearly identified in the Results section.
2.3.2.4 Quality control
To control the reliability of this factor-selection method, regressions are performed for each risk. Logistic regressions, which estimate the probability of success, are used for boolean risks (eg. issuance success) and linear regressions are used for quantitative risk (eg. registration delay).
Linear regression Equation 9
where are the estimated coefficients for each factor.
Logistic regression Equation 10
-where are the estimated coefficients for each factor.
In both cases, two different multiple regressions are performed: a first uses all available factors, and a second only uses key factors. If our factor-selection method is reliable, the proportion of total variance (r²) explained by the two regression is expected to be similar.
All statistical analyses are performed with the open-source R software
3 Results
3.1 Risk quantification
3.1.1 Frequency of risk occurrence
3.1.1.1 Success rate
Out of 100 projects posting a PDD on the UNFCCC website, only 52 will eventually issue CER. Approval process is the most risky step: 33% of projects receive a negative opinion, withdraw or get stuck in the pipe. On the other hand, 10% of registered projects will never issue any CER as well (Figure 2).
Table 5. Success rate and its components Figure 2. Probability to be rejected
3.1.1.2 Approval process delay
Validation is more than twice longer than registration, with an average of 362 days to be completed (Table 6). For both of them, standard deviation is about 60% of average, sign of very disparate durations among projects. The quickest projects to satisfy to all requirements did it in 72 days while the slowest needed close to 5 years. 50% of projects needed less than 11 months to be validated and 5 months to be registered. Approval process delay was responsible for the non-issuance of 221 Million CERs as of April 1st, 2011, that is about 12% of expected CERs.
Table 6. Approval Process delay and its components
3.1.1.3 Issuance delay
Projects wait on average 2 years and 3 months after their crediting period start to obtain their first CERs (Table 7). The possibility of retro-crediting – projects registered before 31st Mars 2007 – makes a huge difference to this delay: for these projects, the delay is 1 years and 6 months longer than average.
Step Step Success
Rate
Validation
Probability of not being bogged down at
validation step 88%
Terminated validation success rate 76%
Validation success rate 67%
Registration 93%
Issuance 83%
TOTAL 52%
1
Step Average duration (days) Standard deviation (days) Standard deviation (% of average) Median (days) Validation 362 215 59% 308 Registration 159 99 62% 142 TOTAL 521 - - - 1
In both cases, certification lasts around 319 days, exactly twice longer than registration duration at approval step. Standard deviation is around 60% of the average, meaning there is a large inter-project variability. 50% of projects needed less than 9 months to be granted their request for issuance.
Table 7. Issuance delay and its components
First issuance delay vs later issuances delay
The average duration of later issuances is on average 19% shorter than that of the first issuance (Table 8). This is mainly due to the “monitoring period” component of early projects, whose duration drops by 59% in monitoring duration for projects for which crediting period start is before registration. The monitoring duration of projects registered after 31st March 2007 and the certification duration of all projects are similar between first and later issuances.
Table 8. Quantification of duration comparison between following issuance and first issuance
3.1.1.4 Issuance performance rate
Over the 595 million of expected CER by April 1st, 2011, once other risks have been discounted, the issuance performance rate is 97% (Table 9). For the first issuance this rate falls to 67% and an over performance rate of 106% is observed for later issuances.
The average performance rate by project – that is not weighted by project size – is 82% over all issuances, starting at 79% for the first and growing to 87% for later issuances.
Table 9. Issuance Performance and its components
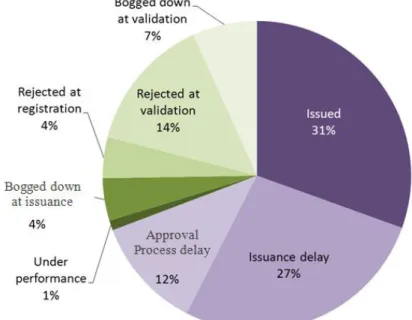
3.1.2 Impact on CER issuance as of April 1st, 2011
576 million CERs had been issued by April 1st, 2011, which is 31% of the 1.88 billion
Step Average duration (days) Standard deviation (days) Standard deviation (% of average) Median (days)
Monitoring Crediting period started before registration
1017 575 57% 989
Crediting period started after registration 272 157 58% 237
Certification 319 205 64% 267
TOTAL 812 - - -
1
Step Average duration
- first issuance (days) Average duration - following issuances (days) Variation %
Monitoring Crediting period started before registration
1017 413 -59%
Crediting period started after registration 272 304 12%
Certification 319 312 -2%
TOTAL 812 658 -19%
1
Issuance Performance Rate Average project issuance performance
CER volume weighted issuance performance
First issuance 79% 67%
Later issuances 87% 106%
TOTAL 82% 97%
The purple sections represent CER for which issuance is only delayed, while the green sections represent CER that will never be issued. The 1% for underperformance is the result of 69% gross underperformance and 119% gross over performance. Figure 3. Repartition of expected CER as April 1st, 2011
3.2 Risk factor analysis
Technology is the only factor that is influent at each step of the process. Date – year of registration end and year of issuance respectively – is mainly influencing approval process and issuance delay. Location, size of the project, DOE or consultants are important factors but not for each risk. Next parts describe in details factor influences at each intermediate risks.
3.2.1 Key factors determining project success
The most influent factors over all CDM steps are (in the order of importance) the technology, the PDD consultant, the location, the end registration year and the validator. Technology and PDD consultant are correlated to all risks with at least 25%, validator is only important at validation (Table 10).
Table 10. Most influents factors for project success
At validation step, the most risk-influent factors are the location, the technology, the PDD consultant and the validator. With some validators (Deloitte, KFQ), the
Correlation (%) Validation Registration Issuance Influent factors Probability to
come out from validation step
Terminated validation success rate
Success rate Success rate
Technology 27 25 37
PDD Consultant 16 22 18
Location 19 41
End registration year 52
(through probability to be reviewed)
Validator 19
Size of the project 24
probability of getting stuck at validation is only 5%, but this figure reaches 25% with others (RINA, AENOR).
The technology is correlated to the terminated validation success rate at a level of 27%: almost 100% for HFCs or N2O projects are successfully validated, against only 50% for industry energy efficiency projects.
China is in the first third with 84% success while India is the last participant (among countries with at least 20 projects) with 66% success.
At registration step, risk-influent factors are the technology, the fact that a review is conducted and the PDD consultant. With 52% correlation, being subject to a review or not is the most important factor which determines registration. Thus, 99% of projects for which no reviews had been conducted were registered whereas only 63% of projects which were reviewed were then registered. Without review, a project is 36% more likely to be registered.
Factors which influence the probability to have a review are the technology, the end registration year, the location and the PDD Consultant. A review is conditioned by the fact that the project is first requested for a review. Factors influencing a request for review and a review are the same.
The end registration year is 16% correlated to the probability to have a review. Thus, from the start of CDM, 17% of projects (for which registration is finished, positive or negative) were reviewed; another way to present it is that 46% of projects requested for review were eventually reviewed. But the probability to be reviewed varied with time. More than 50% of requested reviews for which registration ended in 2008, led to a review being actually undertaken whereas only 40% of the requests led to a review reviewed in 2010.
At issuance step, risk-influent factors are the location and the technology. With 41% correlation, the location is the most important factor. Projects in South American countries and China (92% and 95% success) have higher success than average at issuance; India is not far from the average with 81%. In some African countries on the other hand, projects only have 50% chance to ever issue and in Mexico less than 50%.
32% of methane avoidance or industry energy efficiency projects and almost 45% of manure projects will never issue CER; while HFC, fossil fuel switch and cement heat projects are almost certain to issue.
3.2.2 Key factors determining approval process delay
The most influent factors explaining approval process delay are (in the order of importance) the year of registration or request for registration, the technology, the PDD Consultant, the location, the size of the project and the validator (Table 11). Table 11. Key factors determining approval process delay
At validation step, risk-influent factors are the location, the technology, the
Correlation (%) Validation Registration
Influent factors
Technology 22 25
PDD Consultant 23 26
Location 25 25
Validator 15
End validation Year 47
End registration Year 52
Size of the project 22
Year of request for registration is correlated with the validation duration at a 47% level. A sharp increase in validation duration over years is observed (Figure 4): it increased by 160% from an average of 189 days for projects requesting registration in 2005, to 490 days in 2011. Standard deviation, that is inter-project variability, grew in the same proportion, from 108 days in 2005 to 307 days in 2011. Eliminating the influence of others factors - that is assuming that same type of projects entered the pipe every year - 350 more days were needed between 2005 and 2011 (750% increase).
Figure 4. Validation duration by year
In red: average; in blue: 1st and 3rd quartile; white line: median and pink line: standard deviation
Moreover, 14% of validated projects were submitted twice. In this case, 239 more days are needed to go through validation. The probability to have a second submission is determined by the technology, the location and the PDD consultant. With less than 300 days on average, projects hosted by Mexico, Israel, South Korea and countries in Europe and Central Asia are the fastest to be validated. On the other hand, projects in Sub-Saharan countries need more than 500 days on average.
At registration step, risk-influent factors are the technology, the location, the PDD consultant, the size of the project, the fact that there is a request for review and the year of registration. Validation delay also has 16% correlation with registration delay but it is excluded based on expert judgment: its coefficient in the regression is small, and counter-intuitively negative.
Of registered projects, 37% received a requested for review. In this case 95 days are added to registration duration, almost 60% of the average. The probability to be receive a request for review is influenced by the year of registration, the location, the technology and the PDD consultant. Thus, the probability to have a request for review dropped from 50% for projects registered in 2008 and 2009 to 6% for projects registered in 2011.
An important increase of registration duration is observed from 2005 until 2010 (Figure 5).In 2011, it dropped down to its 2007 level. Projects registered in 2011 were on average faster but there still with a high variability between projects. Eliminating the influence of others factors influence - that is assuming that same type of projects entered the pipe every year - 119 more days were needed in 2010 than in 2005 (116% increase).
Figure 5. Registration step duration by year
In red: average; in blue: 1st and 3rd quartile; white line: median and pink line: standard deviation
The size of the project is 22% correlated; very small and small projects are registered 20% to 30 % faster than large projects.
Projects in China are those which need longest time to be registered with 184 days in average.
3.2.3 Key factors determining issuance delay
The most influent factors for issuance delay are (in the order of importance) the technology, the first issuance year, the size of the projects, the location, the registration duration and the verifier (Table 12).
Table 12. Most influent factors for issuance delay
For the monitoring period, risk-influent factors are the technology, the delay between crediting period start and registration, the size of the project, the registration duration and the verifier.
The size of the project is the second most influent factor with 44% correlation. The monitoring period of very large projects is 218 days shorter than that of very small projects. Similarly, there is a 167 days difference between the slowest technology (landfill power) and the fastest (steel heat).
For the certification period, risk-influent factors are the technology, the delay between crediting period start and registration, the size of the project, the registration duration and the verifier.
First issuance year is the most correlated factor: certification duration increased from 190 days on average in 2006 to 428 days in 2011 (Figure 6). Eliminating others factors influence - that is assuming that same type of projects entered the pipe every
Correlation (%) Monitoring Certification
Influent factors
Technology 40 20
First issuance Year 37
Location 21
Registration duration 29
Size of the project 44
Verifier 15 17
durations is less intuitive than the other, already numerous, risk-influent factors: the consultant usually intervenes before registration, and is unlikely to influence the issuance delay.
Figure 6. Certification duration by years
In red: average; in blue: 1st and 3rd quartile; white line: median and pink line: standard deviation
A request for review by the EB on the request for issuance leads to an additional delay of 84 days. Factors that determine the probability to have a request for review are the first issuance year, the technology and the location.
3.2.4 Key factors determining issuance performance
The most influent factors for issuance performance are (in the order of importance) the technology, the location, the size of the project (Table 13).
Table 13. Issuance performance most influents factors by step
The most important factor is the technology with a 34% correlation. HFCs, N2O and Industry energy efficiency projects have an average issuance performance rate of 103%, 94% and 93% whereas landfill power projects do not exceed 45%.
In China or India, average performance rate by project is greater than 83% while in Mexico it is lower than 50% and in Central America, it is higher than 115%.
Correlation (%) Issuance
Performance Influent factors
Technology 34
Location 31
Size of the project 15
Figure 7. Issuance performance by size
CER issuance performance decreases with the size of the project except for very large projects which over-perform (Figure 7). The over-performance of very large projects is explained by a few over performing huge HFC and N2O projects. Indeed, the average issuance performance, not volume-weighted, follows the decreasing trend with size.
Correlation between first issuance performance rate and later issuances performance rate is 65%. Thus, despite global improvement between first and later issuance (see section 3.1.1.Issuance performance rate), projects with a better rate for the first issuance will still be better later.
4 Discussion
4.1 TechnologyTechnology is the only factor that influences all steps of the process. Several causes may be proposed.
Industrial or operational risk, while implementing the project, varies between technologies. It may impact issuance performance, issuance success or issuance delay in both ways: positive or negative. For example, HFCs or N2O sectors prove reliable because industrial gases production is a mature process, well organized within large industrial firms, and the production of the gas – and therefore the occurrence of the reductions – is itself reliable: no environmental factors such as wind speed or rainfall directly influence it. Methane avoidance or energy efficiency are newer and more complex sectors, prone to organizational difficulties and emissions reductions supply instability. Teichmann (in prep.) showed that landfill methane CDM projects often suffer from an inappropriate sharing of incentives between stakeholders that eventually leads to a discontinuous supply of waste, and to other operational difficulties.
The difficulty to estimate CER in PDD may as well influences issuance performance. Thus, renewable energy or landfill power plants projects have issued less CER than expected because they depend on exogenous parameters: for example, the intermittence of the resource for renewable energy makes energy production
Castro and Michaelowa (2008) has shown that the demonstration of additionality is the point most often pointed out by the EB to justify a negative registration decision. Some technologies for which carbon finance is the only rationale for reducing emissions, such as HFCs, N2O or methane capture, do not struggle to demonstrate additionality. Other technologies, such as energy efficiency, generate other revenues that CER (eg. energy saving or fuel saving) and sometimes struggle to justify that CER are necessary for the project to be profitable.
4.2 Project size
4.2.1.1 Influence on delays
Very small and small projects get registered faster than other projects. The EB indeed exercises a shallower scrutiny for small scale projects. However, despite their derogatory right to use the same DOE for validation and certification, small-scale projects are not certified faster. Moreover, size has no visible effect on validation duration which is the longest step. Overall, small scale projects only gain on average 33 days – over 159 for the average certification delay – compared to larger projects, at registration. This compares well to a theoretical gain of 28 days over 154, estimated by Guigon et al. (2009) based on the less stringent requirements for small-scale projects. Castro and Michaelowa (2008) did not conclude on this point due to disagreement between their quantitative and qualitative – experts interviews – analysis. Our results are consistent with the latter.
Monitoring period duration is longer for small and very small projects. One of the most relevant reasons is transaction costs: because transaction costs are fixed, small projects need to wait longer before they can claim enough CER to cover them.
4.2.1.2 Influence on issuance performance
Issuance performance is higher for smaller projects and for very large projects (more than average 500 kCER a year). For very large projects, issuance performance is driven by a small number of N2O and HFC projects. If these technologies are removed from the sample, very large project issuance performance without them falls to 70% (instead of 104%), which is consistent with the trend of decreasing performance. Indeed, when the project average (rather than volume-weighted average) is considered for issuance performance, very large projects do not perform better than large or medium projects.
Two factors may explain the over-performance of smaller projects: 1) ex-ante analysis and estimates, found in the PDD, are probably more accurate for smaller size projects which often have fewer factors to control for; and 2) the number of stakeholders involved is likely increasing with project size, which in turn increases the risk that stakeholders do not interact efficiently. In particular, Castro and Michaelowa (2008) reports that when two different entities are in charge of the design of the administration and the monitoring of the project respectively, a lack of coordination often results in a poor monitoring implementation, and therefore an under-performance in terms of CER issuance.
4.3 Location
To the contrary of Castro and Michaelowa (2008), we find that host country directly affects validation success, although only to a small extent, and issuance performance, although technology is a more important driver. Our findings also contradict the importance they attribute to location for registration success: indeed, most of the qualitative justification they give relate to other factors such as technology, which
would in our case be attributed exclusively to this factor through the non-collinearity threshold we set for key factors.
China is the favored location to implement a project. In April 1st, 2011, it hosted 39% of all projects in the pipeline and 50% of the projects which entered the pipeline in 2011. India is second, far behind China.
Projects hosted in countries with a high degree of industrialization, a stable political and economic environment, streamlined procedures to approve CDM projects, and sometimes even capacity building programs such as CDM technical centers, encounter fewer issues to be implemented as anticipated in their PDD (Winkelman & Moore, 2011; Wang & Firestone, 2010; Dinar, Rahman, Larson, & Ambrosi, 2008). In South Korea, for example, 87% of expected CER as of April 1st, 2011 had actually been issued - 19% of over-performance - and only 7% of expected CER will never be issued due to rejection of projects. To the contrary, out of the 81 million CERs expected from Africa, 58% will never be issued because the projects were rejected. 4.4 Time
4.4.1.1 Influence on delays
End year for each step is often the most important factor explaining delays at approval steps (validation, registration and certification). Since the beginning of CDMs, these durations have steadily increased. Explanation may be that DOE and EB didn’t anticipate such a keen interest in the CDM and were therefore increasingly overwhelmed by the workload. The EB indeed hired consultants at the end of 2010 in order to clear the pile of projects waiting for a decision. The effect of this move was clear on registration duration, which dropped for projects registered in 2011.
For certification duration, at issuance step, no slowdown is even observed in duration increase. This trend is likely to continue as the number of new projects in the pipe does not diminish despite the growing doubts on the demand for CER after 2012. The recent increase in the number of DOE, and in particular of DOE located in developing countries, does not seem to reduce this delay.
4.4.1.2 Influence on success
The year does not have a major influence on success at validation. It is however influent on the probability to have a review, which in turns strongly influences registration success. Thus, although the time to validate a PDD has increased overtime, probably due to DOE overload, the quality of submitted PDDs has increased as project developers and DOE become more familiar with the process. Between 2007 and 2011, registration success rate grew from 90% to 97%.
4.4.1.3 Influence on issuance performance
Issuance performance increases between the first and following issuances, which is consistent with the findings of Castro and Michaelowa (2008). Project developers and DOE learn from the first issuance and potential problems of calibration or implementation are reduced.
4.5 Validator, Verifier & Consultant
The probability to get stuck at validation step is influenced by the choice of validator. Some validators may be discouraging project developers by asking for more details than others (Castro & Michaelowa, 2008). However, the probability to be
4.6 Other comments
An important remark is if a project faces a problem at any step, that doesn’t mean probability to face another difficulties at a later stage is higher. For example, neither conducting a review nor being delayed at any stages are a premonitory sign to issues at certification.
The factors which are not readily available from the databases listed in the Methods section have not been taken into account. Some of them may be particularly influent: for example, when the primary price of CER is indexed on the secondary CER price in the ERPA, the secondary CER price probably influences the decision of project developers to request an issuance. It may also influence the number of projects entering the pipeline every month – with a lag probably.
The CER buyer could be a good indicator for success rate, due to horizontal integration and learning effects (Castro & Michaelowa, 2008; Teichmann & Bellassen, in prep). Some project owners also actively contribute to the project design and implementation although Teichmann and Bellassen (in prep) shows that this does not influence project success in the waste sector. Bilateral projects – projects involving a developed country buyer – have also been found to be more successful than unilateral projects (Castro & Michaelowa, 2008).
It is also interesting to notice that validation is by far the step at which most project failures occurs: 69% of failed projects – representing 75% of the CER potential that will never be issued – drop out before requesting registration. This weakens the complaints about the weight of the perceived arbitrariness of the CDM EB. Moreover, the project selection process is quite efficient in the sense that most failures occur early in the process chain.
5 Conclusion
The combination of long delays – 2 years and 4 months on average to get the first credits – and poor success rate – only 52% of submitted projects actually make it to issuance – is a pressing call for caution to investors in the CDM and for reform of the CDM. Differences among technologies, countries, PDD consultant and project size are nevertheless substantial: up to a threefold difference can be observed for delays or success rate. Finding the right partner (PDD consultant, verifier etc), in the right place, and on the right technology can turn a cumbersome process into a smooth implementation and return on investment. This, however, is not a good sign for improving the geographical distribution of CDM projects, as Africa is by far the less attractive location in terms of success rate.
Some leads identified in this study may find a resonance within current discussions around CDM reform. Among others, our finding that small projects are certified faster and perform better in terms of issuance justify the shift towards more and more programs of activities (PoAs), which are a smooth way of bundling many small projects as Components of Program of Activities (CPA). PoAs can also help to mitigate many of the risks analyzed in this study as a single approval process is necessary for many instances of emissions reductions (CPA). Yet, there are still too few PoAs in the pipeline to conduct a thorough statistical analysis, and check if this theoretical improvement is borne out by practice. Another widely discussed topic is sectoral crediting. The discrepancies between sectors highlighted in this study show that some sectors may be totally adapted to the current CDM process while others perform worse and may benefit from a more sector-specific approach.
6 Acknowledgements
The authors are thankful to Dorothee Teichmann (CDC Climat Research), Pierre Guigon (Bluenext) and Igor Shishlov (CDC Climat Research), for their useful inputs on earlier versions of the manuscript. They are also thankful to the team of CDC Climat Research and to Raphaël Trotignon (Climate Economics Chair) for their ideas and critical review of the method.
7 Bibliography
Bluenext. (2011). Volume-weighted average of CER spot price in 2010. Retrieved 04 01, 2011, from www.bluenext.eu
Castro, P., & Michaelowa, A. (2008). Empirical Analysis of Performance of CDM
Projects. Climate Strategies Report, Zurich, Switzerland.
Dinar, A., Rahman, S. M., Larson, D., & Ambrosi, P. (2008). Factors Affecting
Levels of International Cooperation in Carbon Abatement Projects. Policy Research
Working Paper 4786, World Bank, Washington D.C., USA.
Guigon, P., Bellassen, V., & Ambrosi, P. (2009). Voluntary Carbon Markets: What
the standards Say... CDC Climat Research Working Paper n°2009-4.
Jung, M. (2006). Host country attractiveness for CDM non-sink projects. Energy
Policy , 34, 2173-2184.
Michaelowa, A. (2005). CDM: current status and possibilities for reform. HWWI Research Paper No.3, HWWI Research Programme International Climate Policy. Michaelowa, A., & Jotzo, F. (2005). Transaction costs, institutional rigidity and the size of the Clean Development Mechanism. Energy Policy , 33 (4), 511-523.
Teichmann, D. (in prep.). The environmental efficiency of contractual structures of public-private partnerships: a case-study analysis of CDM projects in the landfill gas-flaring sector. Ecological Economics .
Teichmann, D., & Bellassen, V. (in prep). Risk-sharing and management of transaction costs: impact of partnerships on the success of CDM projects. Ecological
Economics .
UNEP-Risoe. (2011). Retrieved 04 01, 2011, from http://cdmpipeline.org/
UNEP-Risoe. (2005). Financing structure and CDM project risk. Retrieved 04 01, 2011
UNFCCC. (2002). Report of the Conferences of the Parties on its Seventh Session
held at Marrakesh from 29 October to 10 November 2001
(FCCC/CP/2001/13/Add.2).
Wang, H., & Firestone, J. (2010). The analysis of country-to-country CDM permit trading using the gravity model in international trade. Energy for Sustainable
Development , 14, 6-13.
Winkelman, A. G., & Moore, M. R. (2011). Explaining the differential distribution of Clean Development Mechanism projects across host countries. Energy Policy , 39, 1132-1143.