HAL Id: hal-01591959
https://hal.archives-ouvertes.fr/hal-01591959
Submitted on 25 Sep 2017
HAL is a multi-disciplinary open access
archive for the deposit and dissemination of
sci-entific research documents, whether they are
pub-lished or not. The documents may come from
teaching and research institutions in France or
abroad, or from public or private research centers.
L’archive ouverte pluridisciplinaire HAL, est
destinée au dépôt et à la diffusion de documents
scientifiques de niveau recherche, publiés ou non,
émanant des établissements d’enseignement et de
recherche français ou étrangers, des laboratoires
publics ou privés.
Project risk management conceptual model
Daouda Kamissoko, François Marmier, Didier Gourc
To cite this version:
Daouda Kamissoko, François Marmier, Didier Gourc. Project risk management conceptual model.
GOL’16 - 3rd IEEE International Conference on Logistics Operations Management, May 2016, Fes,
Morocco. �10.1109/GOL.2016.7731689�. �hal-01591959�
Project risk management conceptual model
Daouda KAMISSOKO, François MARMIER, Didier GOURC University of Toulouse, Ecole des Mines d’Albi-Carmaux
Albi, France dkamissoko@mines-albi.fr
Abstract -
The realization of most complex infrastructures requires project formalism. The main observation in the project management field is the cost and delay overrun. This situation is due to the difficulty to predict risks that can occur during realization phase. Hence the is a need of a conceptual framework is risk situation. The objective of this paper is then to propose a conceptual model for project management process in risk situation. Our proposal is a base that can be use to assess the project risk indicator, the analysis of its variants, the determination of risky critical path etc.Keywords - Project, Risk, Strategy, Task, Scenario, Model.
I. INTRODUCTION
Complex project management is always endowed of risk and uncertainties. In this situation, the control of its attributes such as cost, delay, quality is a real challenge for all stakeholders (Contractor, Owner, Tenderer, Project manager). Lack of control of these attributes causes the project failure. This failure could have damaging consequences on stakeholders and the project environment. This situation is linked to the environment variability, and the relationship that can be between involved entities. Moreover, stakeholders are evaluated with regard to their success rate, their conformity to internal, external and environmental constraints. The project management in this context must identify and model the context. The modeling of the context allows decision maker to measure the complexity of the situation, anticipate problems, and identify preventive actions.
The objective of this paper is then to propose a conceptual model for project management in risky situations. Our proposal contains three main steps: Concepts modeling, scenario generation (risk and treatment), results analyze and decision-making.
In the modeling phase, we describe all concepts that consist in Resource, Project, Task, Risk, Strategy, Dependence and Action. For each of them, a simple example allows the comprehension. The next section shows our approach to determine scenarios in term of risk and treatment. Afterward, the decision making step is presented. This model is fully in our own build software named ProRisk.
In the next section, we begin by the process.
II. PROCESS
Our proposal consists in three phases as shown in Figure 1: (1) Modeling of the project, risks and strategies (2)
Generation and the evolution of project’s scenarios (3) Decision aiding.
Figure 1: Process
The modeling phase gives an initial planning that does not integrate any risks. The initial project is then described by set of tasks. Afterward, risks are assessed for every single task. After the modeling, Risk scenarios are generated. It is then possible to perform an analysis for the overall scenario or for some selected ones. These three steps are in the following.
A. Modeling
The objective of this section is to present manipulated concepts in our proposal model for project’s risk analysis. This framework is implemented in an open source software named PRORISK and shown in Figure 2. The model is an
enhancement of that presented in [1] and mentioned in [2]. In [3] the authors propose a method of modeling of project breakdown structures (WBS, OBS, TRM, network model etc.) and its relationships on the basis of ER-methodology. In a conceptual point of view, manipulates concepts of our proposal are discussed in the following sections.
1) Resource
Resource is a consumable human or material entity, available for the project. It might have competences at many levels. Competence is the skill and/or qualification acquired. It is characterized by levels witch represents acquired expertise in a domain. Every resource has a cost, an availability situated between two dates. A resource is available at a given rate.
A clean room available at 20% between 12pm and 14pm for 207$/hour. This clean room offers sterilization and
negative pressure. It has a sterilization level of 7 on a scale of 10.
2) Project
A project is a “temporary and unique endeavor undertaken to deliver a result” [4]. This definition underlines the uniqueness and the time limitation of the project. From the project context, the objective dates (beginning and end) and cost correspond to the wish of its owners. These parameters represent constraints. When a project is defined, others parameters have to be provided for the purpose of the model calibration. Thus, the day type indicates if the analysis is performed in week or month. The time unit informs on either the time is in second, minute or hour. The cost unit refers to the currency type. Besides cost and duration, others criteria such as carbon impact, quality could be selected for the analysis. Every selected criterion is between a minimum and a maximum value. This interval (maximum value – minimum value) can be spited in many sub intervals. Hence during the analysis, it becomes possible to define several situations. Every situation corresponds to set of criteria intervals.
If the delay is between 18-22 months, the cost could be until 20000$, but if the delay is more than 22 months, the
cost must not be more than 18000$
In such way it is possible to identify many objectives to be taken into account in the analyze phase. It is also possible to choose a function that will aggregate a given criteria. At this point of our analyze, we have identified six functions out of the scope of this paper.
For the duration, the function called sign impact duration is “Plus” or “Max”. In the same way, the function for the cost is the sign impact cost. Project belongs to a kind of organization (Firm, Department) called Entity. Entity and Project are under the responsibility of one Resource.
The construction of a new prototype of a cell phone. This project has to begin at the latest the 10/02/2000 and may be
finished before 7/04/2000. 350000$ are allocated for projects if it could last less then one moth, 325000$ otherwise. All personnel and equipment of the research
department could be requested.
In this paper we does not take into account Multi project environment as in [5].
3) Task
Project is constituted of task to be planned. Task is an elementary activity realized to fulfill project objectives. In order to achieve this, Task will last some time reflected by its duration. It is decomposed in as much level as necessary. That is to say that a task could contain subtasks. Furthermore, task could be preceded or precede many tasks. It is characterized by a fixed cost representing the financial value necessary for it realization. It is supposed to begin (correspondingly end) between a pessimist and optimist time. These values reflect the earliest start (correspondingly end) date and the latest start
(correspondingly end) date. Pessimistic and optimistic dates are different from objective ones, which state the point of view of the project manager.
Tasks are classified into two categories: fixed rate and fixed load.
Task is under the responsibility of one resource. But many resources could be affected to its realization at a given rate. This rate is named affectation rate. Task belongs necessarily to only one project and requires competences. In this model, competence, resource or both of them can be affected to Task.
Test of component performed in the clean room by an expert engineer during 6.8 hours. The test includes physical
test of component, and the analyze of radio waves. At the actual state of our model, we do not analyze the fact that when a risk occurs, there are three situations: (1) The task continues in a degradation mode until the implementation of a strategy; (2) the task is stopped until the implementation of a strategy; (3) the task is stopped. The implementation of these modes will be an interesting challenge.
4) Risk
Risk is the feared event which occurrence is susceptible to impact Task or Resource. It is mainly characterized by an initial probability. Its occurrence time (period) is indexed to the period of one or more tasks, to a resource or both of them. This characteristic is described in our model by a “Risk object”. When the period is the resource, the associated risk will occur every time this one is used. [6] describes specific techniques for identifying both project and technical risks.
Considering the occurrence type, we distinguish two kinds of risk in the context of project management: recurrent risk and non-recurrent risk. None-recurrent risk appears only once during the task period and recurrent risk could appear many times. The latter refers essentially to naturals risk such as flood, earthquake etc. There are three behaviors for every occurrence mode: Go, No Go, and Failed. Go means that the realization of the task can continue after the risk occurrence. The task is then affected but it realization is not interrupted by the risk. On the contrary, No Go interrupts the task until an appropriate strategy is taken for its management. Failed means that the project will stop definitively.
In a decision scope point of view, risk could belong to a strategic, tactical or operational category [7].
Every risk is under the responsibility of a resource. It affects resource and task, according a value of its topology occurrence. The typology occurrence refers to how the risk appears during the task. Hence, risk can occur at the beginning of a task, in the middle or at the end. According the occurrence time, the assessment of its impacts is
performed by specified functions. Regarding Tasks, it could impact the delay, the cost, or other criteria.
Flood risk of the clean room with a probability occurrence of 0.3. At it occurrence the test process is stopped until the
complete drying.
The impact of the risk in this paper is assumed to be from external data or from expertise. Whatever it occurrence date time during the task realization, it impact is assumed to be the same. But in reality, the impact depends on the occurrence time. Hence, a risk could impact differently function of either it occur at the beginning, in the middle or at the end of the task. Furthermore, for some risk such as flood, the occurrence typology could be modeled and follow a given function. We then intend to integrate such models in our proposal.
5) Strategy
The ability of decision maker to manage risk should be taken into account in the risk management process [8]. In our proposal this ability refers to Strategy. We define it as an identified measure to manage Risk. It can be preventive, corrective are mixed (preventive and corrective). The main aim of strategy is to reduce the occurrence probability of the risk it manage (reduced probability). It is under the responsibility of a resource.
Strategy manages only one risk, but a risk can be managed by more than one strategies. Tasks impacted by the associated risk are then impacted in term of delay, cost, quality etc. Result of this impact is assessed by models implemented in previous functions (Reduced impact).
A strategy for the risk of flood is sealing of the clean room. This strategy reduces the probability of flood from 0.3 to
0.05
6) Dependency
The occurrence of certain risks could favor the modification of existing ones. We call this phenomena dependency. The modification concerns either the occurrence probability, either the impacts or the associated strategies, but not many of these attributes.
Figure 3: Risk Dependency
To avoid infinite loops, (a) the dynamic generation of the risk is not possible, (b) target risks must be defined, (c) there are no common risks between the two sets of risk (source and target). If the target parameter is the risk probability, then we need only sources risks in the risk
scenario. But if the target parameter is an impact or a strategy, we need booth source and target risks in the strategy.
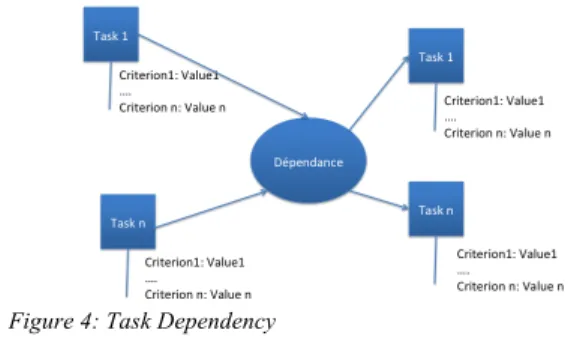
Another type of dependency refers to the criteria associated to Task. For instance, a complexity level on two different tasks could increase that of another one.
Figure 4: Task Dependency
The fire risk occur if there is overload and human error The concept of dependency presented in this paper refers to the links between Risks end that between Tasks. We have eliminated situations where conjunction of quite a few of criteria might modify the behavior of a risk. In such situation, it is possible to have an infinite loop witch could be the source of crisis situation. It will be really enriching to analyze these kinds of situations.
We have supposed that criteria are independent. In some situation, this independency is very subjective and non-explicit. In our point our view it will be interesting to allow the dependency between criteria and to analyze their impact on the decision process.
7) Action
Strategy is set of actions. Action consists in deleting, modifying or adding new task. It can belong to one or more strategy and is under the responsibility of a resource.
The sealing of the clean room consists in raising the building and changing the carpentry.
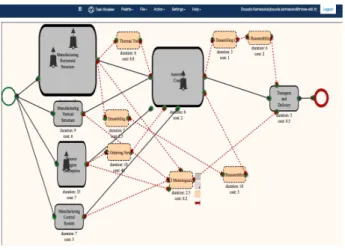
For the modeling of these concepts, our Decision Support System ProRisk uses four modelers:
• Project modeler: allows to model project’s parameters,
• Task modeler: allows to model tasks of the project in the form of PERT network, as well as those of risks’ treatment actions,
• Resource Modeler: allows to model mobilized resources to carry out tasks.
To validate this proposal, we applied it to a use case. It refers to a project a crane construction as the Figure 5 shows it. It consists in six tasks: Manufacturing the horizontal structure, Manufacturing the Vertical Structure, Conception of the source engine, Manufacturing the control system, Assembling, and the Transport.
Figure 5: Use case
Attributes in term of cost and delays characterizes every task. Afterward, probable risks of tasks are assigned. Then we have determined for every risk, preventive and/or corrective Strategies that can manage it as in Figure 6.
Figure 6 : Risks And Strategies B. Scenario generation
A project scenario is a possible way to perform the project. Then, every scenario is evaluated according many criteria in order to compare them. Used criteria are for instance, the occurrence probability of the scenario, the cost and the duration, etc. The generation and evaluation phase allows identifying all scenarios of the project in regard to:
• The occurrence or none occurrence of some risks (risks scenarios),
• Possible corrective or preventive treatment strategies (treatment scenarios).
After risk affectation to tasks, the risks scenarios are generated by ProRisk for the global project. For n risks, the number on possibility is:
RS = 1+
C
n i i=1 n∑
( 1 ) WhereR
sis the number of risk scenario, andi n
C
thecombination operator. This formula takes into account the fact to have any risk. Equation 1 supposes that risks occurrence order is not important and has any influence in the model.
In the same way, for every risk scenario, the strategy scenario is generated. In our methodology, there is at the most one preventive and one corrective scenario for a risk. However, it is possible to have both preventive and corrective strategies for a given risk. The number of scenario is then given by:
SS = RS + C
Str i i=1 Str∑
−
C
l i+ C
k i+
... +C
mi+ C
ni i=2 n∑
i=2 m∑
i=2 k∑
i=2 l∑
#
$
%
&
'
(
(2) The case study corresponds to 215 scenarios. The objective of the next section is to illustrate decisions that can be taken from the two previous steps.C. Decision aiding
In the decision-aiding phase, we propose to the user much visualization of the results. So, results could be represented in the form of tables, or graphics (bubble charts, decision trees, histograms). The user can then conduits his analysis by identifying:
• The most relevant scenarios: scenarios to which the project has to be oriented, while striving preventives strategies that lead to these scenarios,
• Scenarios to avoid,
• The global risk level of the project: final uncertainty about the total duration and/or about the total cost, • The confidence level on the objectives fulfillment:
number of scenarios that overpass delay and cost objectives.
This step is performed by using our tool ProRisk. This DSS is a project steering aiding tool through a better risks management inside the project. Its objectives are to assist the global project risk level evaluation on one hand, and to help choosing the best response strategies (mitigation) on the other.
For this purpose, it relies on project’s scenarios generation and evaluation techniques described is the previous sections. As it can be seen in this paper, the analysis is performed for a single initial planning. We don’t take care of the others possibility of planning. In many situations, particularly in the bidding one, the decision maker has to choice the best tender with regard of many criteria. Over ranking methodology such as AHP or
ELECTRE could be used to select the compromising planning that reflects the decision maker preferences.
For the case study, we conducted the analysis to determine feared scenarios. For instance, for the risk scenario R1R2, the management scenarios are shown in
figure
Figure 7.
Figure 7: Risk scenario and management strategies
III. CONCLUSION AND FUTURE WORK
Project management in risk situation is a challenging and complex activity. It requires taking into account many elements of the context and their interactions. In this paper we have proposed a method to structure and model the project context in risk situation for a best decision-making at the risk occurrence. With our proposal, it is possible to:
Identify the risk scenarios and the associated treatment (preventive and corrective)
Assess project attributes more closer to the reality (cost, duration, quality etc)
In this proposal, risk and strategy scenarios are generated and simulated. Risk occurs or not in a scenario. Because of the uniqueness of the project, there are any study witch determines the probability law of the project risk in our knowledge. By assuming that risk occurrence follows a normal law, we intend to simulate the project evolution in discrete time. Then, it will be possible to analyze the behavior of a single task, or those of the project during a period.
In the actual state of our proposal we use the Work Breakdown Structure (WBS) instead of the Product Breakdown Structure (PBS). But there are some criteria, which characterize better the product than the task. For instance, the performance is mainly used to characterize the product; it is not relevant to characterize a task by a performance. For this reason, we intend to introduce the concept of product in our model. In the literature, critical path in the project is often assessed by considering only the time. This path might be different according risk and strategy. This analysis will allows to determines the task
witch is critical by considering one or more risk, strategy, criterion.
IV. REFERENCES
[1] F. Marmier, D. Gourc, et F. Laarz, « A risk oriented model to assess strategic decisions in new product development projects », Decis. Support Syst., vol. 56, p. 74‑82, déc. 2013. [2] F. Marmier, I. F. Deniaud, et D. Gourc, « Strategic
decision-making in NPD projects according to risk: application to satellites design projects », Comput. Ind., vol. 65, no 8, p. 1107‑1114, 2014.
[3] A. Kukushkin et S. Zykov, « The Dynamic Modeling of the Project Management Process », Procedia Technol., vol. 9, p. 893‑899, 2013.
[4] L.-A. Vidal, F. Marle, et J.-C. Bocquet, « Measuring project complexity using the Analytic Hierarchy Process », Int. J.
Proj. Manag., vol. 29, no 6, p. 718‑727, août 2011.
[5] E. G. Too et P. Weaver, « The management of project management: A conceptual framework for project governance », Int. J. Proj. Manag., vol. 32, no 8, p. 1382‑1394, nov. 2014.
[6] M. Fontaine, « 4 - Project Risk Management A2 - Green, Philip E.J. », in Enterprise Risk Management, Boston: Butterworth-Heinemann, 2016, p. 47‑58.
[7] D. Kamissoko, « Decision support for infrastructure network vulnerability assessment in natural disaster crisis situations », Doctorate, University of Toulouse, University of Toulouse 1 Capitole, 2013.
[8] I. Dikmen, M. T. Birgonul, et S. Han, « Using fuzzy risk assessment to rate cost overrun risk in international construction projects », Int. J. Proj. Manag., vol. 25, no 5, p. 494‑505, juill. 2007.