HAL Id: hal-02055530
https://hal-ensta-bretagne.archives-ouvertes.fr/hal-02055530
Submitted on 4 Mar 2019
HAL is a multi-disciplinary open access
archive for the deposit and dissemination of
sci-entific research documents, whether they are
pub-lished or not. The documents may come from
teaching and research institutions in France or
abroad, or from public or private research centers.
L’archive ouverte pluridisciplinaire HAL, est
destinée au dépôt et à la diffusion de documents
scientifiques de niveau recherche, publiés ou non,
émanant des établissements d’enseignement et de
recherche français ou étrangers, des laboratoires
publics ou privés.
Distributed under a Creative Commons Attribution - ShareAlike| 4.0 International
CTMC modelling for H2H/M2M coexistence in
LTE-A/LTE-M networks
Ahmad Hani El Fawal, Mohamad Najem, Ali Mansour, Frédéric Le Roy,
Denis Le Jeune
To cite this version:
Ahmad Hani El Fawal, Mohamad Najem, Ali Mansour, Frédéric Le Roy, Denis Le Jeune. CTMC
modelling for H2H/M2M coexistence in LTE-A/LTE-M networks. The Journal of Engineering, IET,
2018, 2018 (12), pp.1954-1962. �10.1049/joe.2018.5042�. �hal-02055530�
The Journal of Engineering
Research Article
CTMC modelling for H2H/M2M coexistence in
LTE-A/LTE-M networks
eISSN 2051-3305 Received on 30th April 2018 Revised 13th June 2018 Accepted on 15th October 2018 doi: 10.1049/joe.2018.5042 www.ietdl.orgAhmad Hani El Fawal
1,2, Mohamad Najem
3, Ali Mansour
1, Frédéric Le Roy
1, Denis Le Jeune
1 1Lab-STICC, UMR 6285 – CNRS, ENSTA Bretagne, 29806 Brest, France2AUL University, Beirut, Lebanon 3LIU University, Beirut, Lebanon
E-mail: [email protected]
Abstract: Machine-to-machine (M2M) devices with their expected exponential booming in the near future, will be one of the
significant factors to influence all mobile networks. Inevitably, the expected huge number of M2M devices causes saturation problems, and leads to remarkable impacts on both M2M and human-to-human (H2H) traffics, services, and applications. The research free-space lack requires creating an appropriate model which describes the functionality of long-term evolution-advanced (LTE-A) and long-term evolution for machine (LTE-M), through mathematical frameworks to evaluate relevant performance metrics. In this study, we bridge this gap by proposing a continuous-time Markov chain (CTMC) model as a stochastic process tool to characterise the H2H/M2M coexistence based on analytical equations. Afterwards, the authors validate the proposed model through extensive Monte Carlo simulations. Eventually, it becomes approachable to characterise the impact of H2H/M2M coexistence in one LTE-A/LTE-M radio resource allocation in dense areas and under disaster scenarios. The simulation results show that using a prioritise LTE-A system for both M2M and H2H traffics is convenient in dense area scenarios, while in emergency cases, it is more appropriate to use a non-prioritise traffic strategy to keep H2H and M2M traffics working properly at the same time.
1 Introduction
Traditionally, long-term evolution-advanced (LTE-A) network was developed to better serve human-to-human (H2H) services such as voice calls, video-streaming, and data traffics. However, with the novel paradigm so-called machine-to-machine (M2M) communications (e.g. actuators, sensors, smart meters etc.), an unprecedented innovation for the current LTE-A becomes a must [1]. Offering an attractive M2M services in a utopian autonomous internet of things (IoT) world seems tempting, but with massive connectivity, significant challenges arise on how to manage large number of devices, typically transmitting only small payloads, across wide range applications. In 2020, there will be around 50 billion connections with unavoidable coexistence among H2H and M2M traffics in one LTE-A network [2]; consequently, an efficient radio access strategy becomes one of the most challenges for mobile operators, researchers and the third generation partnership project (3GPP) community [3]. This community sounds ultimately keen on conducting several studies and researches to identify the mutual impact among M2M and H2H communications. In this paper, we mathematically characterise the key performance characteristics of M2M and H2H communications, then we propose an analytical methodology using continuous-time Markov chain (CTMC) model with the following objectives:
• Studying the mutual impact of both M2M and H2H traffics. • Measuring and analysing the M2M congestion solutions. • Modelling a new framework called coexistence analyser and
network architecture for long-term evolution (CANAL). The CANAL framework optimises prioritise radio resource allocation procedures in a LTE-A/long-term evolution for machines (LTE-M) network and achieves understanding of the system performance to reach good balance between M2M and H2H communications. Then, we simulate different dense area and disaster scenarios, which can be studied, analysed, and measured. Finally, by comparing the calculated results with the simulated ones, we come to the conclusion that with a noticeable results’
correlation we can validate our assumptions, models, and proposed architecture.
2 State of the art and motivations
Since the dawn of long-term evolution (LTE) in Rel-8 [4] till the recent Rel-15 [5], 3GPP has made major enhancements on LTE perspectives in term of reducing latency, power consumption, improving measurement accuracy, improving random access reliability, and small cell support [6].
LTE-A was coined initially to support H2H communications (e.g. web-browsing, phone calls, internet televisions etc.). M2M devices (e.g. smart cities, mobile health, smart meters etc.), with their sporadic small packet sizes, pour their payloads into the same LTE-A channel but with different aspects and specifications. Due to these differences, it would be an imperfect match for these two traffics to share the same LTE-A bandwidth. To solve this issue, the 3GPP introduces a licensed spectrum technology so-called LTE-M to serve M2M traffics, which occupies 1.4 MHz from the LTE-A bandwidth. However, with different perspectives and a diversity of applications of M2M and H2H traffics, many challenges are expected as a result of this coexistence. In [7], the main challenges raised by the M2M vision are spotted and by focusing in particular on the problems related to the support of massive M2M access in current cellular communication systems. Then, the most common approaches proposed in the literature to enable the coexistence of H2H and M2M services in the current and next generation of cellular wireless systems are analysed. In [8], the authors study the coexistence of H2H traffic and M2M traffic originating from wireless sensors. By using experimental measurements of real-world smart grid applications, the impact of variable H2H traffic loads on the sensor end-to-end delay performance is investigated. The obtained results show that a conventional Ethernet may cause a bottleneck and increase the delay for both H2H and M2M traffics. In [9], the author addresses the high overhead signalling load problem of M2M devices using a priority-based data aggregation scheme at the M2M gateway to maintain a good trade-off between the power consumption and delay requirement. According to this work, three types of priority are assigned to
M2M devices based on their related applications. Therefore, the data from M2M devices with higher priorities are served faster than the ones with lower priorities. An analytical model considering the idle and busy states behavior of the aggregator using preemption queuing with priority disciplines is developed and analysed. In [10], a shared channel resource allocation in an H2H/M2M coexistence scenario was considered in order to formulate the resource sharing problem among M2M and H2H communications. In [11], the author proposes a cognitive-based radio access model with a priority queuing scheme. The model is applied for a LTE-A networks with M2M/H2H coexistence distinguishing M2M devices based on their traffic quality of service (QoS) requirements, in which M2M communications have real-time (M2M-RT) and non-real-time (M2M-NRT) traffic. Radio access gives the highest priority to H2H, while M2M-RT has higher priority than M2M-NRT. Although an analytical methodology is developed in normal scenarios, but the expected surge number of M2M devices which might have higher priority during disaster scenarios and how to deal with this sticky situation have not been discussed.
Additionally, Markov chains are also found in the literature to characterise M2M and/or H2H traffics in LTE-A/LTE-M networks, due to the specificity of LTE-A/LTE-M networks as time-variant networks. Thus many works can be spotted based on this stochastic method. In [12], an efficient radio access strategy is proposed to manage an LTE network system where M2M devices and H2H users coexist. In this paper, a CTMC model is developed to evaluate the system performance in terms of service completion rate (SCR), blocking and forced termination probabilities, and mean queuing delay of the M2M traffic. Although the proposed model can be used to improve the system performance of M2M communication with different priorities, but the model design does not allow the analysis of the system behavior when facing different H2H applications with different priorities. Now, with a close look to many works found in the literature, many research flaws can be spotted: RACH (random access channel) congestion in a LTE-A/ LTE-M network, high and low priority for both M2M and H2H strategies, queuing for high and low priority M2M and H2H mechanisms, adaptive resource allocation, and emergency scenario solutions.
As for to the congestion and overload problems, which may occur when a large number of M2M devices attempt to access the LTE-A network using RACH, a serious degradation of performance for both M2M and H2H devices is more likely to happen [13]. In our previous work [14], we compare the most
common mechanisms found in the literature that deal with the RACH procedure issues and challenges by analysing the existing solutions and approaches to avoid RACH overload congestion in the M2M communications. In [15], the overload of physical RACH caused by M2M delay sensitive was addressed. The authors proposed a non-preemptive queuing model in order to investigate the performance of different M2M and H2H traffic classes under dynamic access grant time interval controlled scheduling scheme. This was done by using a queuing model focusing on the resource utilisation and the QoS. The results show a delay reduction and a less percentage of packet loss.
Based on all previous work outcomes, we are motivated to propose a CTMC model to study the H2H and M2M coexistence through a mathematical framework. Additionally, a new architecture is proposed which can help in studying and analysing the mutual impact between M2M and H2H traffic coexistence while considering high and low priority traffics for both M2M and H2H devices. Moreover, an adaptive resource allocation is proposed also to scale the network bandwidth especially during disaster scenarios.
3 Coexistence analyser and network architecture
for LTE
Our aim is to measure the mutual impact of M2M and H2H traffics in different scenarios while maintaining a sustainable level of services with minimal congestion during emergency events by allowing both M2M and H2H devices to access the network resources efficiently. In this context, we propose a new architecture so-called CANAL, which extends the classical functionality of the eNodeB and includes an adaptive control of bandwidth based on the M2M load status throughput, as shown in Fig. 1.
The proposed CANAL architecture manages automatically both H2H and M2M traffics. Based on the instantaneous requests of M2M, a part of the total bandwidth is dedicated to fulfill these sudden needs. To this end, the model operates at different conditions depending on the M2M load state throughout the network. The CANAL architecture consists of a single uplink cell in one eNodeB dedicated for a LTE-A/LTE-M network.
Let RBH2H be the maximum resource blocks reserved for
LTE-A network and RBM2M be the one reserved for LTE-M network.
There are two types of traffics: M2M and H2H traffics. Each traffic has LP and HP arrival rates (λi) assumed to be following Poisson's
distributions [16]. Let (λH1/λH2) be the average arrival rates for
Fig. 1 CANAL architecture
H2H HP/LP, respectively. Similarly, (λL1/λL2) the average arrival
rates for M2M LP/HP.
The CANAL architecture contains also a queuing control unit (QCU) consisting of four different queues: two for H2H HP and LP traffics (H2H LP-Q, H2H HP-Q) with queue sizes n and o, respectively; similarly, two queues for M2M low and high priority (M2M LP-Q, M2M HP-Q) with queue sizes p and q, respectively.
Additionally, the CANAL architecture includes a resource allocation control (RAC) unit used to control, manage, and grant access the network requests based on the available resources. The RAC has a vital role when congestion occurs especially during emergency scenarios by dominating the resources adaptively in order to fulfill the excessive requests of M2M devices, while keeping the H2H requests within the acceptable norms.
Finally, service rates (μH1, μH2, μL1, μL2) will be accomplished for
each traffic, respectively, H2H HP, H2H LP, M2M LP, and M2M HP. All notations used in our model architecture are summarised in Table 1.
3.1 Queuing control unit
The CANAL architecture contains four feedback queues for the four traffic types: H2H LP, H2H HP, M2M LP, and M2M HP. By applying a special priority strategy, we end up with an efficient radio management which dominates the H2H/M2M coexistence.
The system is considered in the ‘full state’ when the number of reserved resource blocks in a LTE-A network peaks to RBH2H
and/or in a LTE-M network peaks to RBM2M. In Fig. 1, the queuing
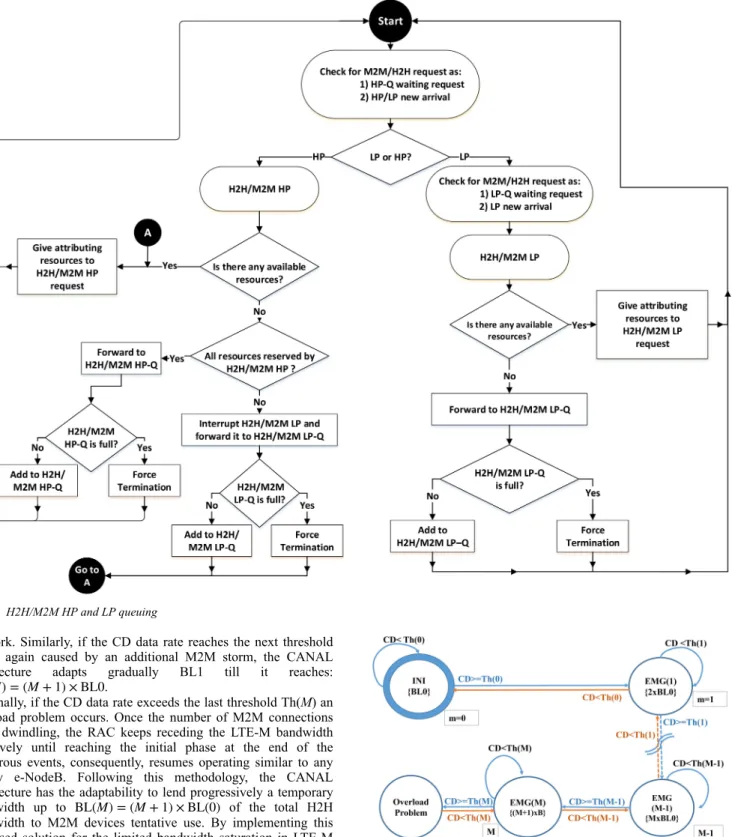
process is initiated when the system reaches its cut-off point (the full state) and a new M2M/H2H device request contends to access the system. The new arrival request might be either H2H/M2M HP or H2H/M2M LP. The contention resolution is the core of the QCU by differentiating between two cases:
• H2H/M2M LP new arrival: When a H2H/M2M LP requests an access to the system the QCU checks the RAC for available resources. If there is at least one resource available the RAC grants the request access to the network. If there is no available resources the request will be forwarded to the H2H/M2M LP-Q. However, if the queue is full the request is terminated, otherwise the request is enrolled in the appropriate queue, as shown by the flowchart presented in Fig. 2.
• H2H/M2M HP new arrival: When a H2H/M2M HP requests an access to the system, the QCU checks the RAC for available resources. If there is at least one resource available, then the RAC grants the request access to the network. If there is no available resources, the QCU verifies whether all resources are reserved by H2H/M2M HP or not. If the answer is ‘yes’, the request will be forwarded to the H2H/M2M HP-Q. However, if the queue is full, then the request is terminated, otherwise the request is enrolled in the appropriate queue. If the answer is ‘No’, an interruption command will be initiated asking for an immediate evacuation of a H2H/M2M LP resource reservation which will be pushed to the H2H/M2M LP-Q. Similarly, if the queue is full the request is terminated; otherwise, the request is enrolled in the appropriate queue, as shown by the flowchart presented in Fig. 2.
3.2 Resource allocation control unit
The CANAL architecture contains an important part so-called RAC unit, which plays a crucial role in granting access, interrupting services, and managing resources for both LTE-A and LTE-M networks. Especially when it comes to an increasing storm of requests during normal and emergency scenarios caused by the synchronisation behavior of M2M devices. A balancing act must be kept continuously; on one hand, the RAC might fulfill the excessive requests of M2M devices, but on the other hand any major QoS degradation on H2H traffic is not tolerated at all costs. Thus, we are in need of an efficient strategy to dominate network resources in an adaptive, simulative and rescued way which might help to master a new eNodeB that can go ahead of the curve, as shown in Fig. 3.
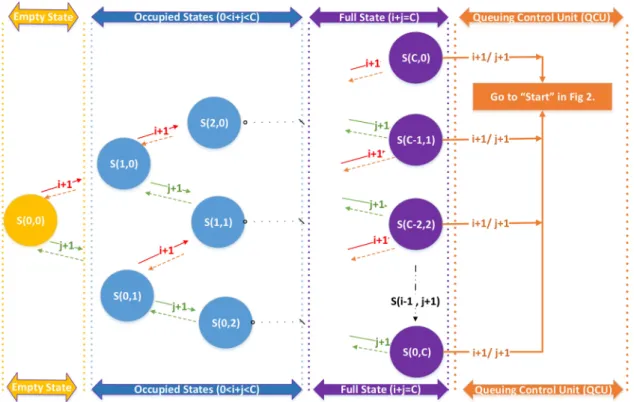
In normal situations, the CANAL architecture works similar to any legacy eNodeB in LTE-A/LTE-M networks as initial state (INI). An initial bandwidth-limited (BL0) dedicated for LTE-M traffic from the total bandwidth by reserving RBM2M for M2M
devices. Meanwhile, the remaining resources are reserved for H2H devices denoted by RBH2H and connected to a LTE-A network.
In the case of an emergency EMG(1), a huge number of M2M connected devices (CD) saturate the initial LTE-M bandwidth (BL0) by their storm briefly. When the CD data rate reaches a certain initial threshold Th(0) the RAC increases the bandwidth from BL0 to BL1 = 2 × BL0 to allow more CD accessing the
Table 1 Description of notations used in CANAL architecture
Notation Description
CANAL coexistence analyser and network architecture for LTE RBH2H maximum resource blocks reserved for LTE-A
RBM2M maximum resource blocks reserved for LTE-M
λH1 average arrival rate for H2H high priority
λH2 average arrival rate for H2H low priority
λL1 average arrival rate for M2M low priority
λL2 average arrival rate for M2M high priority
QCU queuing control unit
HP high priority
LP low priority
HP-Q high priority queue LP-Q low priority queue RAC resource allocation control unit
μH1 completed H2H high priority service rate
μH2 completed H2H low priority service rate
μL1 completed M2M low priority service rate
μL2 completed M2M high priority service rate
n H2H low priority queue size
o H2H high priority queue size
p M2M low priority queue size
network. Similarly, if the CD data rate reaches the next threshold Th(1) again caused by an additional M2M storm, the CANAL architecture adapts gradually BL1 till it reaches: BL(M) = (M + 1) × BL0.
Finally, if the CD data rate exceeds the last threshold Th(M) an overload problem occurs. Once the number of M2M connections starts dwindling, the RAC keeps receding the LTE-M bandwidth iteratively until reaching the initial phase at the end of the disastrous events, consequently, resumes operating similar to any legacy e-NodeB. Following this methodology, the CANAL architecture has the adaptability to lend progressively a temporary bandwidth up to BL(M) = (M + 1) × BL(0) of the total H2H bandwidth to M2M devices tentative use. By implementing this proposed solution for the limited bandwidth saturation in LTE-M networks, an adaptive reallocation of the bandwidth leads for an acceptable resolution for any presumable M2M storm.
Based on our previous work in [17], we found out that by leasing some folds of LTE-M classic bandwidth, we can achieve a significant gain in the M2M traffic with the same ratio.
4 CTMC analytical methodology
Our CTMC analytical methodology consists of four steps:
• First, we use CTMC as a stochastic method to describe the sequence of possible events M2M or H2H built on different states and various priorities.
• Second, we generate the equilibrium equations which rule the probability of transitioning from one state to another.
• Third, we turn these probabilities and states into a linear system and by solving it we can calculate each state probability under certain conditions.
• Fourth, using the aforementioned probabilities, we propose some metrics to characterise the performance of the network, with the aim to evaluate M2M and H2H traffics.
4.1 Representing the system as a set of states
In our system states, two variables (i,j) are considered to denote the number of two ongoing services one is high-priority traffic and the other is low-priority traffic, respectively. The system moves from
Fig. 2 H2H/M2M HP and LP queuing
Fig. 3 RAC phases for CANAL architecture, where CD: connected
devices, Th: threshold, INI: initial state, EMG: emergency state, BL: bandwidth limited, m: current state number, M: maximum state number
one state to another if an event occurs (increase/decrease of i or j). The two traffics have two average arrival rates (λ1, λ2) assumed to
follow Poisson distribution and two service rates (μ1, μ2) assumed to follow an exponential distribution. The generic CTMC model is shown in Fig. 4. All notations used in the analytical methodology are summarised in Table 2.
The numbers of states (st) based on the number of resources C should satisfy the following constraints:
0 ⩽ i, j ⩽ C (1) 0 ⩽ i + j ⩽ C (2) where i represents the number of ongoing services for high-priority traffic and j represents the number of ongoing services for low-priority traffic.
Based on (1) and (2), st can be derived as follows:
st=
∑
0 ⩽ i + j ⩽ C1 =∑
i = 0 C∑
j = 0 C − i 1 =∑
i = 0 C (C − i + 1) =∑
i = 0 C (C + 1) −∑
i = 0 C i = (C + 1)2−∑
i = 1 C i = (C + 1)2− C(C + 1) 2 = (C + 1)(C + 2)2 (3)where 1 represents an indicator function defined on a set X that indicates membership of an element in a subset A of X, having the value 1 for all elements of A and the value 0 for all elements of X not in A. A numerical example can be found in [18].
4.2 Generating the equilibrium equations
In the following, we assume that the observation time intervals are so small that at one time interval only one event (i + 1, i − 1, j + 1, j − 1) may occur. In this case, the system falls into one of the following three cases:
• Case 1: ‘empty state’, where i = j = 0, includes one state S(0, 0)
and has the following equilibrium relationship:
(λ1+ λ2)π(0, 0)= μ1π(1, 0)+ μ2π(0, 1) (4)
where π(i,j) is the probability to be in the state S(i, j).
• Case 2: ‘occupied state’, where 0 < i + j < c, includes ((c − 1)(c + 2))/2 states and has the following equilibrium equation:
Fig. 4 Generic CTMC model, where i: number of ongoing services for HP requests, j: number of ongoing services for LP requests, c: maximum number of
resource blocks, S(i, j): a certain state denoted by i and j
Table 2 Description of notations used in the analytical
methodology
Notation Description
i number of ongoing services for HP traffic
j number of ongoing services for LP traffic
λ1 average arrival rate for HP traffic
λ2 average arrival rate for LP traffic
μ1 completed service rate for HP traffic
μ2 completed service rate for LP traffic
c number of resource blocks used in the network
st numbers of states
π(i,j) the probability to be in the state S(i, j)
A the coefficient matrix in a linear system Π the steady-state probability vector SCRHP SCR for HP traffic
SCRLP SCR for LP traffic
Ru resource utilisation
E(i) the expected value of ongoing services for HP traffic
(λ1+ λ2+ iμ1+ jμ2)π(i,j)= λ1π(i− 1,j)+ λ2π(i,j− 1)
+(i + 1)μ1π(i+ 1,j)
+(j + 1)μ2π(i,j+ 1)
(5) • Case 3: ‘full state’, where i + j = c, includes (c + 1) states and
has the following equilibrium equation:
(iμ1+ jμ2)π(i,j)= λ1π(i− 1,j)+ λ2π(i,j− 1) (6)
The above three equations can be summarised by the following generic equation:
(αλ1+ αλ2+ iβμ1+ jβμ2)π(i,j)
= βλ1π(i− 1,j)+ βλ2π(i,j− 1)
+(i + 1)αμ1π(i+ 1,j)+ (j + 1)αμ2π(i,j+ 1)
(7)
where α = 0 indicates the ‘full state’ (otherwise α = 1) and β = 0 represents the ‘empty state’ (otherwise β = 1).
4.3 Linear system solution
To recall, in our system states, (i,j) denotes the number of ongoing services, i.e. H2H and M2M. The system moves from one state to another, when a service is achieved or a new request arrives (by increasing or decreasing i or j) with a steady-state probability π(i,j):
∑
i = 0 c∑
j = 0 c − i π(i,j)= 1 (8) 0 ≤ π(i,j)≤ 1 (9)The general equation in (7) can be written in linear form:
AΠ = 0 (10)
where the square matrix A represents the coefficients in the linear system, and Π represents the steady-state probability vector:
Π = π(0, 0) π(0, 1) ⋮ π(c, 0) (11)
By replacing the first row of A by the coefficients of (8), we obtain the following modified system:
BΠ = 1 0 ⋮ 0 (12)
Equation (7) can be solved while considering the numbers of states
st as dimension for the steady-state probability vector Π and
(st) × (st) as dimensions for the square matrix B. Knowing that st
could be calculated using (3). B is a full rank (st) × (st) matrix and
linear system of (12) can be solved easily.
4.4 Performance and metrics
We use two performance metrics to validate our model:
i. SCR: It gives the number of completed requests per time
interval and it is based on the service rate μ and the number of
ongoing requests for a certain traffic (e.g. SCRHP and SCRLP
which represent the SCR for HP/LP traffics [11]): SCR =
∑
ij iμπ(i,j) (13)
As we consider the service rate (μ) as constant in our
model, (13) can be written as SCR = μ
∑
i i
∑
j π(i,j) (14)As the sum of conjoint probability leads to the marginal probability, the previous equations can be re-written as follows:
SCR = μ
∑
i iπ(i)
= μE(i) (15) where E(i) represents the expected value of an ongoing service denoted by (i).
ii. Resource utilisation (Ru): This metric gives the probability of the system to be busy serving the arrivals in terms of the number of utilised RBs in each state:
Ru=
∑
ij i + j c π(i,j) = ∑ijiπ(i,j)+ ∑ijjπ(i,j) c = E(i) + E(j)c (16)5 Simulations and result discussions
In this section, we present our developed simulation model which can generate both H2H and M2M traffics with full flexibility to add queuing or priority for any traffic in order to study the mutual impact for H2H and M2M traffics.
5.1 M/M/1 simulations
An M/M/1 queue made by having a single server, where arrivals are determined by a Poisson process and job service times have an exponential distribution.
The proposed architecture is based on Matlab libraries presented in [19]. Many enhancements are made in order to match our CANAL architecture presented in Section 3:
• The architecture consists of a single-queue and single-server system with a double-traffic source. In order to omit the role of the queuing for the moment, we consider an infinite storage capacity (in this case the queue sizes n = o = p = q = 0 for the
different traffics, see Table 1).
• The architecture follows a CTMC with transition rate matrix similar to the one in Section 4.
• Arrivals occur at rate λ according to a Poisson process and move
the process from state (i) to (i + 1) and/or (j) to (j + 1).
• Service times have an exponential distribution with rate parameter μ in the M/M/1 queue, where 1/μ is the mean service
time.
• A single server serves H2H and M2M traffics one at a time by allowing one event only (either i or j) in the smallest time interval.
• The queue could be configured to work according to a FIFO (first input first output), LIFO (last input first output) or by priority discipline, with a flexible buffer size.
• When the service is completed, the served request leaves the system and the number of ongoing services in the system reduces by one (i) to (i − 1) and/or (j) to (j − 1).
• The architecture makes it easy to compare empirical results with the corresponding theoretical results.
Our methodology to reach our final simulation model is to build the simplest model with one traffic first, then we develop the basic H2H and M2M traffic models in which we can fix a starting experimental point with some highlighted flaws. In the end, by
working on the drawbacks of the basic model, many enhancements could be suggested as result of adding priority and queuing strategies and compare it with the basic model.
5.2 Single traffic simulations and results
As a first step, we start by experimenting the behavior of a single traffic system with the aim to prove the accuracy of the proposed CTMC model. Additionally, a comparison for both analytical and simulation results are conducted in order to validate the accuracy of the system by calculating the mean absolute error (MAE): MAE = (1/n)∑tn= 1 xc(t)− xs(t) and the root mean squared error
(RMSE): RMSE = (1/n)∑tn= 1(xc(t)− xs(t))2.
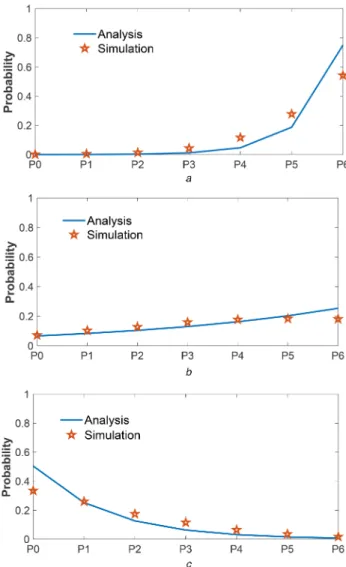
The analytical and simulation results for the probability to be in a given state π(i) and with a number of resource blocks c = 6 RBs
are shown in Fig. 5, which shows that the accuracy of the proposed system falls into the an error limit with a MAEmax= 0.0592. Also, a slight mismatch between the analysis results and simulation results could be spotted especially in the full state P6 (where the arrival average peaks to the maximum system capacity 6). This mismatch is unavoidable because in our simulator, we added two random generators for two arrivals (i and j) following a Poisson distribution. In some cases, (i + j) exceeds the maximum number of available resources c. These cases should be removed in order to respect the constraint: (i + j ⩽ c) which affects our random
variables supposed following the Poisson distribution. So, we solve this issue by introducing a saturation function in our simulations. Consequently, an acceptable approximation is considered for these cases (where i + j > c), similar to occurrences of (i + j = c),
knowing that in our example (c = 6). In this case, the probability to
be in the full state is more likely to happen with a noticed difference comparing to the analysis results. This non-linear behavior can explain the small mismatch.
The results obtained with (c = 6) drive us to do more
exploration by increasing c to 25 RBs. The simulated results are shown in Fig. 6 in which we end up with MAEmax= 0.0177. In
Fig. 6a, we can realise a minor mismatch at the end of the curves. This mismatch is due to removing the unwanted values which do not respect the following constraint: i + j ⩽ C (as explained in Fig. 5). Similarly, in Fig. 6c, a minor mismatch at the beginning of the curves due to removing the unwanted values which do not respect the constraint: 0 ⩽ i + j. In Fig. 6b, the probability peaks when the number of resources reaches (C = 24) because of the high-arrival rate (λ1= 20) accompanied with a low-completion rate (μ1= 5) and only a limited number of resources (Cmax= 25) which
results a fast network saturation.
To sum up, all previous exploration experiments are able to achieve a good accuracy with the aforementioned MAE and RMS, which might be considered as a valid starting point to take up our simulation model by upgrading the single traffic simulation to a basic simulation for H2H and M2M traffics.
5.3 Basic simulations and results
In order to study the mutual impact of H2H and M2M traffics in dense area or emergency scenarios, we conduct several simulations based on the proposed architecture in [19], with the following parameters:
• We assume to have one LTE-A network using a bandwidth of 5 MHz (c = 25) in order to stress H2H and M2M traffics to the maximum.
• Each traffic has an average arrival rate (λ1, λ2) with a service rate
(μ1, μ2).
• H2H and M2M traffics have the same priority.
• A FIFO queue type is used with an infinite capacity size. • Simulation duration = 1000 s.
5.3.1 Dense area scenario: In urban and dense areas, a huge
number of M2M and H2H devices may exchange their payloads exponentially. Consequently, we consider a fixed arrival rate of
H2H requests (λ1= 5) and incremental arrival rate of M2M requests 2 < λ2⩽ 20, while μ1= 0.5 and μ2= 1. From the results
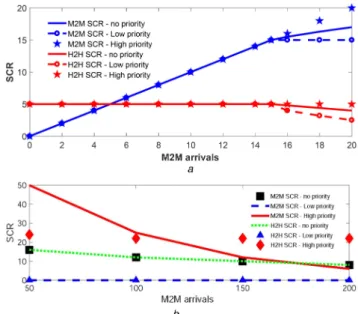
shown in Fig. 7a and by calculating the percentage of served requests comparing to the total arrivals, we can conclude the following:
• When λ2⩽ 15: The system is able to serve all M2M (in red) and H2H (in blue) requests, because H2H arrivals, with λ1= 5 and a service rate μ1= 0.5, occupy an average of 5 resources from the 25 total resources for 2 consecutive time intervals, which means on the second time interval it occupies 10 resources (5 previous arrivals and 5 new arrivals). Consequently, it remains around 15 resources per time interval for M2M arrivals with a maximum
λ2= 15 and a service rate μ2= 1.
• When 15 < λ2⩽ 20: A degradation on both M2M and H2H SCR
can be realised, because in our assumption they have similar priority and the total number of requests are much more than the available resources c = 25. At the peak (λ2= 20), only 4K of 5K total H2H requests are served (80%) and 17K of 20K total M2M requests are served (85%). As an average of 4 from the 25 total resources will be occupied by H2H traffic for 2 consecutive time intervals (actually 4 previous arrivals and 4 new arrivals), and the remaining 17 resources will be used by M2M traffic. • The high utilisation of the system (Ru= 100%) requires a
queuing strategy to fulfill the excessive requests and to minimise the number of forced terminated services, as suggested in Section 3.1.
Fig. 5 π(i) result comparison for c = 6, where π(i): the probability to be in a
given state S(i, j), c: the maximum number of resource blocks, λ1: the
average arrival rate, μ1: completed service rate (a) λ1= 4; μ1= 1, (b) λ1= 5; μ1= 4, (c) λ1= 2; μ1= 4
5.3.2 Emergency scenario: In emergency cases, a M2M
signalling storm is definitely expected as a result of connected devices, which leads inevitably to a M2M congestion. This congestion caused by the simultaneous synchronisation affects both H2H and M2M devices. In this scenario, we consider the following system parameters: λ1= 50, 50 ⩽ λ2⩽ 200, μ1= 0.5 and μ2= 1.
From the results shown in Fig. 7b, when λ2= 50 a degradation on both M2M and H2H SCR can be realised, because they have similar priority and the total number of requests are much more than the available resources c = 25. Only 8K of 50K total H2H
requests are served (16%) and 8 K of 50 K total M2M requests are served (16%), because an average of 8 from the 25 total resources will be occupied by H2H traffic for 2 consecutive time intervals, and the remaining 8 resources will be used by M2M traffic each time interval.
By increasing λ2= 100, 150, 200, we end up with the following results as shown in Table 3.
5.4 M/M/1 results
In Section 5.3, two different scenarios (dense area and emergency) are conducted to measure the H2H and M2M mutual impact but without neither considering a prioritise system nor applying queuing strategy to ensure the QoS of different traffics. Now, it is time to consider two scenarios with similar parameters using a prioritise system as follows.
5.4.1 Prioritise dense area scenario: In this simulation, we
emphasis similar case to the one considered in Section 5.3.1; While assigning a higher priority for one traffic, we study the trade-off between cost or gain on H2H and M2M traffics.
From results shown in Fig. 7a, we realise that the system is able to serve all M2M and H2H requests as long as λ2⩽ 15. After this point, the system maintains the higher priority traffic towards a degradation on the lower priority traffic.
5.4.2 Prioritise emergency scenario: Similar to the case in
Section 5.3.2 but with different M2M and H2H priorities, the results shown in Fig. 7b spot that the system maintains the higher priority traffic with a total elimination of the lower priority traffic.
To sum up, the simulation results show that using a prioritise LTE-A system for both M2M and H2H traffics could handle more requests in dense area cases by maintaining the higher priority traffic without any degradation while reducing the completion rate of the lower priority traffic. Meanwhile, in emergency cases, the higher priority traffic takes precedence over the lower priority traffic with an improvement on its completion rate while totally eliminating the low priority traffic; in such cases, the non-priority traffic strategy has a competitive advantage because it keeps H2H and M2M traffics working at the same time.
6 Conclusion and perspectives
In this paper, we address the saturation problem caused by the expected huge number of M2M devices which leads to remarkable impacts on both M2M and H2H traffics. We have proposed an enhanced architecture designed for LTE-A/LTE-M networks in order to fulfill H2H/M2M traffic coexistence supported with various priority strategies to satisfy the QoS for each traffic. A queuing strategy is enforced by a QCU, which rule four queues allocated for different traffic types. A CTMC model is proposed as a stochastic process tool to characterise the H2H/M2M coexistence based on analytical equations. Our simulation results matched with the CTMC analytical model which corroborates the proposed model. Moreover, they show that using a prioritise LTE-A system for both M2M and H2H traffics is more convenient in dense area scenarios; while in emergency cases, it is more appropriate to use a non-prioritise traffic strategy to keep both H2H and M2M traffics working properly at the same time.
In this work, a homogeneous number of resources has been considered for all applications; in our future work, the authors aim to study the heterogeneity in different applications which reflects the actual behavior of various IoT applications.
Fig. 6 π(i) result comparison for c = 25, where π(i): the probability to be in
a given state S(i, j), c: the maximum number of resource blocks, λ1: the
average arrival rate, μ1: completed service rate (a) λ1= 15; μ1= 12, (b) λ1= 20; μ1= 5, (c) λ1= 23; μ1= 25
Fig. 7 SCR for H2H (SCRH2H) vs. SCR for M2M (SCRM2M)
(a) Dense area cases, (b) Emergency cases
Table 3 Emergency scenario results
λ2 SCRH2H/M2M % CompletedH2H CompletedM2M
100 12 6K 12K
150 10 5K 15K
200 8 4K 16K
7 References
[1] Shi, J., Liu, C., Hong, X., et al.: ‘Coexistence of delay-sensitive MTC/HTC traffic in large scale networks’, Sci. China Inform. Sci., 2017, 60, (10), pp. 1– 15
[2] Mansour, A., Mesleh, R., Abaza, M.: ‘New challenges in wireless and free space optical communications’, Opt. Lasers Eng., 2017, 89, pp. 95–108 [3] Gudkova, I., Samouylov, K., Buturlin, I., et al.: ‘Analyzing impacts of
coexistence between M2M and H2H communication on 3GPP LTE system’. Int. Conf. Wired/Wireless Internet Communications, Paris, France, May 2014, pp. 162–174
[4] 3GPP. Technical Specifications and Technical Reports for a UTRAN-based 3GPP system, Release 8. Available at http://www.3gpp.org/specifications/ releases/72-release-8, accessed 20 December 2017
[5] 3GPP. Technical Specifications and Technical Reports for a UTRAN-based 3GPP system, Release 15. Available at http://www.3gpp.org/release-15, accessed 20 December 2017
[6] Ratasuk, R., Mangalvedhe, N., Xiong, Z., et al.: ‘Enhancements of narrowband IoT in 3GPP Rel-14 and Rel-15’. IEEE Conf. Standards for Communications and Networking (CSCN), Helsinki, Finland, September, 2017, pp. 60–65
[7] Biral, A., Centenaro, M., Zanella, A., et al.: ‘The challenges of M2M massive access in wireless cellular networks’, Digit. Commun. Netw., 2015, 1, (1), pp. 1–19
[8] Lévesque, M., Aurzada, F., Maier, M., et al.: ‘Coexistence analysis of H2H and M2M traffic in FiWi smart grid communications infrastructures based on multi-tier business models’, IEEE Trans. Commun., 2014, 62, (11), pp. 3931– 3942
[9] Alqahtani, S.A.: ‘Analysis and modelling of power consumption-aware priority-based scheduling for M2M data aggregation over long-term-evolution networks’, IET Commun., 2017, 11, (2), pp. 177–184
[10] Hamdoun, S., Rachedi, A., Ghamri-Doudane, Y.: ‘A flexible M2M radio resource sharing scheme in LTE networks within an H2H/M2M coexistence
scenario’. IEEE Int. Conf. Communications (ICC), Kuala Lumpur, Malaysia, May 2016, pp. 1–7
[11] Alqahtani, S.: ‘Performance analysis of cognitive-based radio resource allocation in multi-channel LTE-A networks with M2M/H2H coexistence’,
IET Commun., 2017, 11, (5), pp. 655–663
[12] Alqahtani, S.A.: ‘Cognitive-based resource allocation scheme in LTE-A networks with M2M/H2H coexistence’. Wireless Telecommunications Symp. (WTS), New York City, USA, 2017, pp. 1–7
[13] Misic, J., Misic, V., Khan, N.: ‘Sharing It MyWay: efficient M2M access in LTE/LTE-A networks’, IEEE Trans. Veh. Technol., 2017, 66, pp. 696–709 [14] El Fawal, A.H., Mansour, A., Le Roy, F., et al.: ‘RACH overload congestion
mechanism for M2M communication in LTE-A: issues and approaches’. IEEE Int. Symp. Networks, Computers and Communications (ISNCC), Marrakech, Morocco, May 2017, pp. 1–6
[15] Elattar, H., Alaa, Y., Digham, F., et al.: ‘LTE dynamic scheduling scheme for massive M2M and H2H communication’. 8th IEEE Annual Ubiquitous Computing, Electronics & Mobile Communication Conf. (UEMCON), New York City, USA, October 2017, pp. 122–126
[16] Laner, M., Svoboda, P., Nikaein, N., et al.: ‘Traffic models for machine type communications’. Proc. Tenth Int. Symp. Wireless Communication Systems (ISWCS), Ilmenau, Germany, August, 2013, pp. 1–5
[17] El Fawal, A.H., Mansour, A., Najem, M., et al.: ‘Adaptive LTE-M eNodeB for emergency scenarios’. 8th Int. Conf. Information and Communication Technologies Convergence ICTC, Jeju Island, Korea, October 2017 [18] El Fawal, A.H., Mansour, A., Najem, M., et al.: ‘CTMC modeling for
M2M/H2H coexistence in a NB-IoT adaptive eNodeB’. 11th IEEE Int. Conf. Internet of Things (iThings 2018), Halifax, Canada, July 2018 accepted
[19] Mathworks website, M/M/1 Queuing System. Available at https://
www.mathworks.com/help/simevents/examples/m-m-1-queuing-system.html, accessed 19 December 2017
J. Eng.
This is an open access article published by the IET under the Creative Commons Attribution License