HAL Id: inserm-00136451
https://www.hal.inserm.fr/inserm-00136451
Submitted on 16 May 2007
HAL is a multi-disciplinary open access
archive for the deposit and dissemination of sci-entific research documents, whether they are pub-lished or not. The documents may come from teaching and research institutions in France or abroad, or from public or private research centers.
L’archive ouverte pluridisciplinaire HAL, est destinée au dépôt et à la diffusion de documents scientifiques de niveau recherche, publiés ou non, émanant des établissements d’enseignement et de recherche français ou étrangers, des laboratoires publics ou privés.
SPECT data to perfusion pattern modeling: evidence of
functional networks in healthy subjects and temporal
lobe epilepsy patients.
Christophe Grova, Pierre Jannin, Irène Buvat, Habib Benali, Jean-Yves
Bansard, Arnaud Biraben, Bernard Gibaud
To cite this version:
Christophe Grova, Pierre Jannin, Irène Buvat, Habib Benali, Jean-Yves Bansard, et al.. From anatomic standardization analysis of perfusion SPECT data to perfusion pattern modeling: evidence of functional networks in healthy subjects and temporal lobe epilepsy patients.: From anatomic stan-dardization analysis of perfusion SPECT data to perfusion pattern modeling: evidence of functional networks in healthy subjects and temporal lobe epilepsy patients. Academic Radiology, Elsevier, 2005, 12 (5), pp.554-65. �10.1016/j.acra.2004.08.014�. �inserm-00136451�
From anatomic standardization analysis of perfusion
SPECT data to perfusion pattern modelling
Christophe Grova‡†k, Pierre Jannin‡, Irène Buvat#, Habib Benali#, Jean-Yves Bansard§, Arnaud Biraben‡ and Bernard Gibaud‡
‡ Laboratoire IDM, Faculté de Médecine, Université de Rennes 1, France † Montreal Neurological Institute, McGill University, Montreal, Canada
# INSERM U494, CHU Pitié Salpêtrière, Paris, France § INSERM U642, Université de Rennes 1, France
k To whom correspondence should be addressed: Christophe Grova
e-mail: christophe.grova@mail.mcgill.ca
Address: Montreal Neurological Institute, McGill University, 3801 University Street, Montreal, Quebec, Canada, H3A 2B4 EEG department, Room 028
Phone: 1 (514) 398 2184, fax: 1 (514) 398 8106
HAL author manuscript inserm-00136451, version 1
Abstract.
Rationale and Objectives. In the general context of perfusion pattern modelling from SPECT data, the purpose of this study was to characterize inter-individual functional variability and functional connectivity between anatomical structures in a set of SPECT data acquired from a homogeneous population of subjects.
Materials and methods. From Volume of Interest (VOI)-perfusion measurements performed on anatomically standardized SPECT data, we proposed to use correspondence analysis (CA) and hierarchical clustering (HC) to explore the structure of statistical dependencies among these measurements. The method was applied to study the perfusion pattern in two populations of subjects, namely SPECT data from 27 healthy subjects and ictal SPECT data from 10 mesial temporal lobe epilepsy (MTLE) patients.
Results. For healthy subjects, anatomical structures showing statistically dependent perfusion patterns were classified into four groups, namely temporo-mesial structures, internal structures, posterior structures and remaining cortex. For MTLE patients, they were classified as temporo-mesial structures, surrounding temporal structures, internal structures and remaining cortex. Anatomical structures of each group showed similar perfusion behavior so that they may be functionally connected and may belong to the same network. Our main result was that the temporal pole and the lenticular nucleus seemed to be highly relevant to characterize ictal perfusion in MTLE patients. This exploratory analysis suggested that a network involving temporal structures, lenticular nucleus, brainstem and cerebellum seems to be involved during MTLE seizures.
Conclusion. CA followed by HC is a promising approach to explore brain perfusion pattern from SPECT VOI measurements.
Key Words. Functionnal variability; SPECT; correspondence analysis; hierarchical clustering; mesio-temporal lobe epilepsy
1. Introduction
Single photon emission computed tomography (SPECT) using99mTc-HMPAO or99m
Tc-ECD as a radiotracer is the most widely applied technique to study cerebral blood flow [1]. Ictal SPECT is a high sensitive technique for imaging extreme perfusion changes occurring during an epileptic seizure [2]. It provides valuable information for the presurgical investigation of epilepsy. A perfusion pattern is defined as a typical spatial organization of brain perfusion among a homogeneous set of SPECT data. Perfusion patterns may be used to characterize subtypes of a pathology, for instance in temporal lobe epilepsy [3, 4]. Characterizing brain perfusion inter-individual functional variability in SPECT is a key issue to better understand the physiology and physio-pathology, to study functional connectivity, to support diagnosis and to derive a model for perfusion pattern. Volume of Interest (VOI)-based anatomic standardization analysis has been widely used to study normal perfusion patterns in SPECT [5, 6, 7]. Such methods rely on an a priori spatial model of brain anatomy described by VOIs definition. VOI-based analysis assumes that the perfusion values of interest are homogeneous within each VOI. The main perfusion models reported in the literature reflected mainly inter-individual average perfusion characteristics (see [6] for a study of 89 healthy subjects). In [8],
we proposed a spatial model of brain anatomy, i.e. VOIs, dedicated to the analysis of ictal SPECT data for mesial temporal lobe epilepsy (MTLE) patients. Such anatomical model was used to create an average model for normal perfusion within healthy subjects and an average model for ictal perfusion in MTLE patients.
Analyzing inter-individual functional variability of brain perfusion among a set
SPECT data set is needed for perfusion pattern modelling. Principal component
analysis of SPECT data sets has already been proposed to study functional variability within a population of healthy subjects [7, 9] or within a population of temporal lobe epilepsy patients [10]. Those methods aim at identifying anatomical structures where perfusion is covarying between subjects of a same homogeneous group. Discriminant analysis has been used for non-supervised classification between normal and pathological SPECT data [11]. Characterization of a perfusion pattern may also be achieved by studying “dependencies” between anatomical structures (e.g., correlation, statistical dependencies, functional connectivity). This aspect is of particular interest in the context of presurgical investigation of epilepsy, especially because the notion of epileptogenic network seems helpful to better understand epilepsy [12, 13]. Concerning ictal SPECT in temporal lobe epilepsy, evidence of underlying functional networks, involving the thalamus, the basal ganglia and the cerebellum, was already suggested [10, 14, 15].
The purpose of this study is to propose a new method to characterize inter-individual functional variability and statistical dependencies between anatomical structures from SPECT data. We propose to combine correspondence analysis (CA) and hierarchical clustering (HC) [16] to explore perfusion patterns observed using SPECT data sets acquired from a homogeneous population of subjects. By combining both approaches, we were able to extract the most meaningful information from the data using CA, and then to identify groups of anatomical structures showing similar perfusion behavior using HC. This multivariate analysis was performed on VOI measurements obtained after anatomic standardization as proposed in Grova et al. [8]. Perfusion patterns were studied from normal SPECT data of 27 healthy subjects and from ictal SPECT data of 10 MTLE patients.
2. Material and Methods
2.1. Anatomic standardization analysis
2.1.1. Spatial model of brain anatomy: VOIs selection was deduced from the
anthropomorphic model of the head proposed by Zubal et al. [17]. This model was established from a T1-weighted high-resolution 3D MRI of a healthy subject from which VOIs were hand drawn and labeled. To generate a spatial model of brain anatomy appropriate to study perfusion patterns seen in temporal lobe epilepsy [3], Zubal phantom temporal and frontal VOIs were re-segmented into their mesial, lateral and polar components. In order to study perfusion inter-hemispheric asymmetries, all
VOIs were re-labelled as belonging to the right or the left hemisphere. 52 lateralized brain VOIs were thus generated from Zubal phantom.
2.1.2. Population of subjects, data acquisition and preprocessing: Two populations of
subjects exhibiting characteristic perfusion patterns were considered. SPECT scans of 27 healthy subjects (12 men and 15 women, aged 20 to 56 years) were used to study normal perfusion. These data were kindly provided by Dr. Barnden from the Queen Elizabeth Hospital (Woodville, Australia). Ictal SPECT from 10 MTLE patients (six men and four women, aged 19 to 43 years) from the Rennes University Hospital (Rennes, France) were selected to derive a model of ictal perfusion. Patients selection was based on clinical data showing usual temporal ictal semiology (cf. epigastric sensation, dreamy state, automatism), absence of secondary generalization in their history, unilateral involvement of the temporal lobe on Electro-EncephaloGraphy (EEG) and on the result of the surgery. Ictal SPECT data thus exhibited a typical ictal perfusion pattern for MTLE, as described in [3]. After clinical investigations including SPECT acquisitions, all MTLE patients underwent curative surgery and are now seizure free (Engel class Ia [18]). Pathological hemisphere was then clearly identified for each patient.
For the 27 healthy subjects, SPECT images were acquired with a three-head gamma camera equipped with ultra high-resolution parallel collimators (IRIX, Philips MS) after
injection of 500 MBq of 99mTc-HMPAO (120 projections over 360◦, 128 × 128 matrix,
pixel size = 3.59 mm). For the 10 MTLE patients, the ictal SPECT images were acquired with a two-head DST-XL camera (GEMS) equipped with fan beam or parallel
ultra high-resolution collimators (64 projections over 360◦, 128 × 128 matrix, pixel size
= 4.51 mm). 740 MBq of99mTc-HMPAO was injected 52 ± 15.3 s (S.D.) after the onset
of the seizure, relying on EEG measurements (seizure duration being 92 ± 23.3 s). All SPECT data were reconstructed using filtered backprojection with a ramp filter (Nyquist frequency cutoff). The reconstructed data were post-filtered with an 8 mm full width at half maximum (F W HM ) 3D Gaussian filter. The spatial resolution was F W HM = 12.2 mm for all reconstructed images. Scatter correction was only performed for the healthy subjects using the Jaszczak method [19], by subtracting
the projections corresponding to a simultaneous acquired Compton window. No
simultaneous acquisition in a Compton window was available for retrospective ictal SPECT data. Assuming uniform attenuation in the head, first order Chang attenuation
correction [20] was performed, with the attenuation coefficient µ = 0.15 cm−1 for scatter
corrected data and µ = 0.12 cm−1 for uncorrected data [19].
2.1.3. Spatial normalization: To perform SPECT measurements in the VOIs of the
spatial model (see §2.1.1), the spatial normalization method described by Friston et al. [21] and implemented in the Statistical Parametric Mapping (SPM99 ¶) software was used. SPECT data and VOIs of the spatial model were both spatially normalized to a
¶ SPM software: http://www.fil.ion.ucl.ac.uk/spm/
mean anatomical reference volume, represented by the T1 template provided by SPM, as follows:
• A non-linear geometric transformation was estimated to match the 3D T1-weighted MRI of the Zubal phantom, and thus the VOIs, on the T1 SPM template.
• For the 27 healthy subjects, SPECT images were spatially normalized to the SPECT template provided by SPM using an affine geometric transformation, as recommended by Acton and Friston [22] ; the SPECT SPM template is by construction in the same referential as the T1 SPM template.
• For the 10 MTLE patients, a two-step approach was used to achieve spatial normalization of ictal SPECT data, which exhibited large hyperperfused areas. First, an inter-modality / intra-patient rigid registration was performed between each patient’s ictal SPECT and MRI data, by maximization of mutual information [23]. Each subject’s 3D T1-weighted MRI was then spatially normalized to the T1 SPM template, using a non-linear geometric transformation.
All these linear or non-linear geometric transformations allowed resampling of the SPECT data and the VOIs in the unique mean anatomical reference, i.e., the T1 SPM template, using trilinear interpolation. Spatial normalization was visually checked by a neurosurgeon, by superimposing each SPECT, MRI and VOIs resampled in this mean anatomical reference volume (see Figure 1). No significant deformation errors were visually detected.
2.1.4. Perfusion measurements and intensity normalization: For each VOI j and each
SPECT data set i, a perfusion measurement consisted in the estimation of the mean
SPECT intensity xij within the VOI. To remove the confounding effect of global
inter-acquisition changes in SPECT, each measurement was normalized in intensity so that the mean voxel count throughout the brain was about 50 counts/voxel.
2.2. Perfusion pattern modelling
Whereas average perfusion models deduced from those VOIs measurements were proposed in [8], the purpose of this study was to provide a more detailed analysis of the underlying distribution of those perfusion measurements. Functional variability was explored by analyzing the structure of statistical dependencies between perfusion measurements. Considering the VOIs and the SPECT data sets as two qualitative variables, we applied correspondence analysis (CA) followed by hierarchical clustering (HC) to study the statistical dependencies between those variables [16].
2.3. Correspondence analysis (CA) and ascending hierarchical clustering (HC)
2.3.1. Generation of the contingency table: CA relies on the analysis of a contingency
table N, where each element nij describes the number of observed individuals partitioned
among the modalities of two qualitative variables. In our study, the two qualitative
variables were the anatomical entities, i.e., the VOIs, and the SPECT data sets. More precisely, to emphasize inter-hemispheric asymmetries during the analysis, we considered measurements from both hemispheres as two realizations of the same
qualitative variable. The variable V OInonlat thus described the name of the
non-lateralized VOIs of our spatial model, whereas the variable SubjectHemcharacterized the
“name” of the measured hemisphere of each subject. We distinguished left versus right hemispheres for healthy subjects, and ipsilateral versus contralateral hemispheres with
respect to the epileptogenic focus for the MTLE patients. The variable SubjectHem
was described by m1 = 2 × 27 = 54 modalities for healthy subjects (respectively
m1 = 2 × 10 = 20 modalities for MTLE patients). V OInonlat was described by
m2 = 52/2 = 26 anatomical entities. A contingency table N was generated by assigning
the corresponding measurement xi0j0 (cf. sections 2.1.4) to each pair of SubjectHem and
V OInonlat modalities.
2.3.2. Basics of CA: From a contingency table N described by m1 rows and
m2 columns, CA exhibits the relationships between distribution profiles, namely relationships between row profiles or between column profiles. A row profile i is defined
by nij/ni. for j ∈< 1, m2 >, where ni. is the ithrow sum. It represents the percentage of
perfusion value stored in each V OInonlat for a particular SubjectHem. A row profile may
also be considered as an individual (i.e., a modality of SubjectHem) described by m2
variables (i.e., modalities of V OInonlat). Similarly, a column profile j defined by nij/n.j
for i ∈< 1, m1 >, n.j being the jth column sum, is the percentage of perfusion value
stored in each SubjectHem for a particular V OInonlat.
CA provides a multivariate analysis of the distribution shapes of those profiles independent from the intensity of the perfusion values. Similarities between profiles are
taken into account by using a χ2 metric. The χ2-distance between two row profiles i
and i0 is defined by:
d(i, i0)2 =Xm2 j=1 1 n.j µn ij ni. − ni0j ni0. ¶2 (1)
The χ2-distance between two column profiles is defined similarly. CA may then be
interpreted as a principal component analysis (PCA) of those row profiles (or column
profiles), using the χ2-distance as a metric. The χ2 distance is a well-known similarity
measure of statistical dependence between qualitative variables. Such metric makes it possible to compare the shapes of distribution profiles, providing an analysis of the
underlying structure of statistical dependencies among modalities of V OInonlat and
SubjectHem.
A threshold on the decreasing eigenvalues resulting from CA is applied to select the sub-space containing the most meaningful information. Variables, i.e., column profiles
V OInonlat, and individuals, i.e., row profiles SubjectHem, were then represented by their
projections on the first principal components.
2.4. Interpretation of the results of CA using HC
Within the subspace selected by CA associated with the Euclidian distance, we applied ascending hierarchical clustering (HC) on CA principal components to extract groups
of variables V OInonlat or individuals SubjectHem considered as neighbors. Using the
Ward criterion to aggregate similar clusters at each level of HC [16], we obtained a classification tree of neighbor “points”, i.e., variables or individuals. “Cutting” the tree then provided a classification of those points. Points belonging to the same cluster were then considered as statistically dependent. On the other hand, points located in different clusters were considered closer to independence.
To help interpretation, the center of mass of each cluster of anatomical structures
V OInonlat was projected on the two first principal components. The square cosine of
the angle between each center of mass and its projection on each principal component was assessed to evaluate the quality of the representation. All statistical analysis were
performed using R software+.
3. Results
3.1. Analysis of perfusion measurements within healthy subjects
Projection of the variables on the first two principal components is shown on Figure 2 (a). The first two principal components corresponded to 34.3% of global inertia. For HC, we selected the first 5 principal components accounting for 67.5% of global inertia. By cutting the classification tree presented on Figure 2(b), HC allowed us to distinguish four groups of anatomical structures :
• Internal structures: thalamus (contribution of 30.1% to the second principal component), caudate nucleus (contribution of 16.8% to the second principal component), basal ganglia (contribution of 12.5% to the second principal component) and lenticular nucleus.
• Temporo-mesial structures: amygdala (contribution of 49.7% to the first principal component and of 12.4% to the second), hippocampus and temporal-pole.
• Posterior structures: inside the cerebral cortex (occipital, occipital-lateral and occipital-mesial) and outside the cerebral cortex (cerebellum and brainstem). • Remaining cortex
In each case, we indicated the structures presenting the highest contributions to the inertia projected on the first two principal components. This analysis showed that the structure of dependencies between anatomical structures for normal perfusion was complex to characterize and clearly required more than two principal components. Projections on the first two principal components presented on Figure 2(a) may thus be misleading. For all the clusters except the posterior structures one, the center of
+ R software: http://www.r-project.org/.
mass of the cluster was accurately represented on the first two principal components, showing high square cosines (see Table 1). The cluster posterior structures was better
represented on the 3rd and the 4th principal components, and its projection close to
the cluster remaining cortex on the first two principal components (cf. Figure 2 (a)) is misleading. Those four groups of statistically dependent anatomical structures seemed highly relevant to characterize the normal perfusion pattern. On the other hand, the
analysis of the individuals SubjectHem was not really informative on this population
(results not shown).
3.2. Analysis of ictal perfusion measurements within MTLE patients
The first two principal components were considered sufficient to extract the main information (69.2 % of global inertia) from the analysis of ictal SPECT of 10 MTLE patients. Figure 3 (a) shows the projection of the variables on those first two principal axes. Similarly to healthy subjects analysis, HC within the selected sub-space yielded four groups of statistically dependent anatomical structures presented on Figures 3 (a) and (b):
• Temporo-mesial structures: temporal-pole (contribution of 21.3% to the first principal component), amygdala (contribution of 15.8% to the first principal component) and hippocampus.
• Surrounding temporal structures: temporal-mesial, temporal-lateral, temporal, orbito-frontal, insula and lenticular nucleus, including also some posterior structures outside the cerebral cortex such as cerebellum and brainstem.
• Internal structures: thalamus (contribution of 38.0% to the second principal component), caudate nucleus (contribution of 21.7% to the second principal component) and basal ganglia.
• Remaining cortex
The centers of mass of all those clusters were accurately represented on the first two
principal components, showing high square cosines (Table 1). The first principal
component represented mainly the temporo-mesial versus remaining cortex clusters, whereas the second principal component represented mainly the surrounding temporal versus internal structures clusters. When compared to the analysis of healthy subjects, we observed a similar distinction between temporo-mesial structures, internal structures and remaining cortex. Some differences between normal and ictal perfusion patterns
were nevertheless observed. The lenticular nucleus VOI belonging to the group
of internal structures for healthy subjects analysis, was assigned to the group of surrounding temporal structures, i.e., close to the pathological area. Although the temporal-pole VOI was classified within the temporo-mesial cluster for both analysis, it has an higher influence on the ictal perfusion pattern, showing higher contribution to the first principal component (21.1%). The anatomical structures temporal-pole and lenticular-nucleus seemed thus very relevant to describe the ictal perfusion pattern
seen during MTLE seizures. Note that the cerebellum and the brainstem were also associated to the surrounding temporal cluster, whereas occipital areas were now classified within the remaining cortex group. The dual representation showing the projection of individuals on the first two principal components, presented on Figure 4 (a), highlights a relevant discrimination between ipsilateral and contralateral hemispheres. 4. Discussion
We proposed to combine correspondence analysis (CA) and ascending hierarchical clustering (HC) to explore statistical dependencies among perfusion measurements performed using VOIs applied on anatomically standardized SPECT data. The method was used to study normal perfusion measured within 27 healthy subjects and ictal perfusion as seen in 10 MTLE patients. For both groups, we found relevant structures of statistical dependencies between perfusion measurements, suggesting that CA associated with HC is a promising approach to characterize functional variability among SPECT data sets acquired from a homogeneous population. By using CA, our approach differed from previously reported studies using principal component analysis (PCA) [7, 9, 10]. CA theoretically extracts more general links between variables than PCA because it explores statistical dependencies between the shapes of perfusion measurement profiles
using the χ2 metric, whereas principal component analysis assumes that distributions
of perfusion measurements are Gaussian and explores correlations between the intensity of the perfusion values. Moreover, whereas CA or PCA aim at extracting the most meaningful information from the data and get rid of the noise, our main contribution was to use HC to assist the interpretation of the results of CA and to find some features describing the perfusion pattern. HC performed on the sub-space selected by CA allowed us to identify groups of anatomical structures “statistically dependent”, i.e. showing similar perfusion behavior among the population. HC was particularly needed when the structure of statistical dependencies was complex and more than two principal components were required for its characterization such as for the normal perfusion pattern (cf. 5 principal components were required).
Even if groups of statistically dependent anatomical structures were clearly exhibited from the analysis of both healthy subjects and MTLE patients, our results should be interpreted with caution, especially because of the limited number of SPECT data studied. Indeed, the proposed analysis may be spoiled by quantification errors caused by the spatial normalization step or by the perfusion measurement step. Those errors may thus artificially generate statistical dependencies between some perfusion measurements. As spatial resolution greatly affects the spatial range of statistical dependency between neighboring regions, we only considered reconstructed images with similar spatial resolution (i.e., F W HM = 12.2mm). The differences in dependencies seen between the two groups are therefore unlikely to be due to differences in spatial resolution. Moreover, as CA and HC performed on healthy subjects before and after scatter correction lead to similar results (results not shown), scatter can be assumed not
to affect the structure of statistical dependencies between regions.
Partial volume effect (PVE) due to SPECT limited spatial resolution is the main source of absolute quantification errors within small structures in SPECT (see for instance [24]). It may explain some statistical dependencies between small neighboring VOIs. However, as CA analyzes measurement profiles, it should be less sensitive to absolute quantification errors. We thus assume that main dependencies between distant anatomical structures were preserved, even though data were not corrected for PVE. Our results are notably in agreement with previous studies reporting functional variability within healthy subjects [9, 7] or underlying networks in MTLE patients [14, 15, 10], where no PVE correction was performed as well. Even if VOI-based or voxel-based methods to correct for PVE have been proposed and validated on PET [25] and SPECT data [24, 26], achieving accurate PVE in any application context is still a difficult task. For instance, VOI-based PVE correction methods [25] should be evaluated on perfusion SPECT data, when using a large number of VOIs as in the present study. We plan to further investigate this issue before applying CA and HC on PVE corrected data.
VOI-based perfusion measurements may also be biased by some errors arising from the spatial normalization step. However, the spatial normalization method we used to compensate for inter-individual anatomical variability [21] was proved to be very accurate when applied to T1-weighted anatomical MRI, especially to preserve sulco-gyral morphology [27]. Because SPECT hypoperfusion areas were proved to decrease accuracy of non-linear spatial normalization [22, 28], we assume that similar effects should happen with ictal SPECT showing large hyperperfused areas. We thus proposed a two-step approach [8] to spatially normalize ictal SPECT data, using first an ictal SPECT/MRI rigid registration that we validated in [29], followed by a non linear spatial normalization of the T1-weighted MRI. Because of the spatial normalization step and the low spatial resolution of the SPECT images, we assumed in the present study that the anatomical inter-individual variability had a negligible impact on the analysis of functional variability. However, we plan to investigate atlas-based segmentation methods as proposed by Collins et al. [30] in order to define VOIs directly on the MRI of each subject. Accurate VOI segmentation on each subjects’MRI will notably be particularly needed to correct for PVE.
Our results in the 27 healthy subjects agreed with other studies exploring SPECT functional variability among a population of healthy subjects [6, 7, 9]. Five principal components were needed to characterize the structure of statistical dependencies between VOIs. This complexity of the structure of normal perfusion is in agreement with previous observations, which highlighted the significant effect of various parameters
(e.g., age, gender, laterality) on the perfusion values [6, 7]. HC allowed us to
select four groups of structures considered as relevant to describe normal perfusion patterns, namely internal structures, temporo-mesial structures, posterior structures and remaining cortex. The perfusion among the posterior structures cluster, constituted by regions located both in (i.e., occipital cortex) and outside (i.e., brainstem and cerebellum) the cerebral cortex, was thus found relatively independent from the rest
of the brain. This functional independence reminds us an anatomical distinction as these posterior structures are supplied by the posterior circulation (vertebrobasilar system), whereas the other brain regions belong to the carotidean territory. Similar clusters of correlated anatomical structures have already been reported by Pagani et al. [7], by applying PCA on VOI-based perfusion measurements from 50 healthy subjects. However, 12 principal components were considered in [7] to explain 81% of the variance, while in our data a similar percentage of global inertia could be explained by using 8 principal components. Differences between these two study results may be partly explained by different acquisition and post-processing protocols and by the choice of the population of healthy subjects. Special attention must be paid regarding the selection of the population of healthy subjects when studying normal perfusion in SPECT [6].
Ictal SPECT selected for this study were known to exhibit a characteristic ictal perfusion pattern as seen in MTLE patients [3]. Due to extreme perfusion changes caused by epileptic seizure, CA and HC show, as expected, a clear discrimination
between hemispheres ipsilateral and contralateral to the epileptogenic focus. The
structure of statistical dependencies among ictal perfusion measurements was completely described by only the first two principal components, being therefore more easily described by our analysis than the normal perfusion pattern. The overall structure of statistical dependencies was concordant between ictal and normal perfusion measurements, as similar clusters were identified using HC. However, there was some difference, as we identified no posterior structures group but rather a surrounding temporal structures group including some temporal structures as well as orbito-frontal, insula, lenticular nucleus, cerebellum and brainstem structures. When compared to the normal perfusion pattern, the VOIs temporal-pole and lenticular nucleus were found highly relevant to characterize this ictal perfusion pattern. Using PCA on VOI measurements on ictal SPECT, Blumenfeld et al [10] found some correlations between similar anatomical structures in temporal lobe epilepsy patients and proposed a model of the underlying network. Using HC, we propose a quantitative method to extract such a network from the results of most significant dependencies selected by CA or PCA.
Other SPECT studies showed the implication of basal ganglia or cerebellum in ictal perfusion of MTLE patients [10, 14, 15, 31]. Those results suggest the existence of an underlying network involving temporal structures, internal structures, brainstem and the cerebellum during a seizure assessed by ictal SPECT. Evidence of such networks were also found in other functional studies. In interictal FDG Positron Emission Tomography (PET) of patients with temporal lobe epilepsy, four hypometabolism patterns were found and confirmed by electrophysiological results (surface or depth recordings) [4]. Basal ganglia, as well as the insula, were involved in those patterns, suggesting that the interictal hypometabolism may be related to the ictal discharge generation and some spreading pathways. PET hypometabolism in basal ganglia, including lenticular nucleus, was also associated to the generation of dystonic postures occurring during a temporal seizure [32]. Dystonia was in the other hand associated with ictal SPECT hyperperfusion in the same structures [31]. Finally, a good agreement between metabolic
patterns in FDG PET and ictal perfusion patterns in SPECT in temporal lobe epilepsy was reported in [33], emphasizing the key role of the temporal-pole. In structural image study and Electroencephalograpy (EEG), the role of the temporal pole in MTLE is an interesting open question (cf. a special issue of Epileptic disorders [34]). MRI findings of more diffuse temporal lobe atrophy including the temporal poles [35], as well as depth EEG abnormalities arising from these regions [36], suggest that the temporal pole is clearly involved in MTLE seizures.
The existence of anatomical pathways involving temporal lobes and subcortical structures are well known, and epileptic seizures may involve widespread network interactions between cortical and subcortical structures [10, 37]. Although it may be more difficult to electrophysiologically implicate the cerebellum with seizures, there is no doubt regarding its pathological involvement in epilepsy. Whether it is secondarily affected by the seizures themselves, by the antiepileptic drug use or by the underlying epileptogenicity, it remains unclear. According to our results, CA and HC seem thus a promising approach to explore the statistical dependencies between temporal, internal and posterior structures in larger groups of patients. We plan to use CA and HC to further investigate such perfusion patterns on both ictal and interictal SPECT data. Our methodology could also be applied to the analysis of other imaging modalities such as FDG PET.
5. Conclusion
We have proposed a method to study the spatial statistical dependencies seen in SPECT brain perfusion data sets acquired from a homogeneous population of subjects. The method combines anatomic standardization analysis with correspondence analysis and ascending hierarchical clustering to explore relationships between perfusion profiles. We applied the method to normal SPECT images acquired from healthy subjects and to ictal SPECT images acquired from MTLE patients. Our results gave evidence of structured perfusion patterns involving four groups of anatomical regions, namely temporal structures, internal structures, posterior structures and remaining cortex. Moreover, the temporal pole and the lenticular nucleus seemed to be highly relevant to characterize ictal perfusion in MTLE patients. The understanding of such spatial statistical dependency will certainly provide information regarding the underlying epileptogenic network.
Acknowledgments
This work was partly supported by a grant from the "Conseil Régional de Bretagne". We also would like to thank Dr. Leighton Barnden (Woodville, Australia) for providing normal SPECT data, and Dr. Eliane Kobayashi (Montreal Neurological Institute, Canada) for fruitful discussion concerning the interpretation of the results in the context of temporal lobe epilepsy.
References
[1] J. Patterson and D.J. Wyper. SPECT Imaging of the Brain : Basics of SPECT, chapter 1, pages 1–42. Kluwer Academic Publishers, Dordrecht / Boston / London, R. Duncan edition, 1997. [2] M.D. Devous, R.A. Thisted, G.F. Morgan, R.F. Leroy, and C.C. Rowe. SPECT brain imaging in
epilepsy: A meta-analysis. Journal of Nuclear Medicine, 39(2):285–293, 1998.
[3] S.S. Ho, S.F. Berkovic, W.J. McKay, R.M. Kalnins, and P.F. Bladin. Temporal lobe epilepsy subtypes: Differential patterns of cerebral perfusion on ictal SPECT. Epilepsia, 37(8):788–795, 1996.
[4] F. Chassoux, F. Semah, V. Bouilleret, E. Landre, B. Devaux, B. Turak, F. Nataf, and F.X. Roux. Metabolic changes and electro-clinical patterns in mesiotemporal lobe epilepsy: A correlative study. Brain, 127(1):1–11, 2004.
[5] N.J. Lobaugh, C.B. Caldwell, S.E. Black, F.S. Leibovitch, and S.H. Swartz. Three brain SPECT region-of-interest templates in elderly people: Normative values, hemispheric asymmetries, and a comparison of single- and multihead cameras. Journal of Nuclear Medicine, 41(1):45–56, 2000. [6] K. Van Laere, J. Versijpt, K. Audenauert, M. Koole, I. Goethals, E. Achten, and R. Dierckx. 99mTc-ECD brain perfusion SPET: Variability, asymmetry and effect of age and gender in healthy adults. European Journal of Nuclear Medicine, 28(7):873–887, 2001.
[7] M. Pagani, D. Salmaso, C. Jonsson, R. Hatherly, H. Jacobsson, S.A. Larsson, and A. Wägner. Regional cerebral blood flow assessment by principal component analysis and 99mTc-HMPAO SPET in healthy subjects at rest: Normal distribution and effect of age and gender. European
Journal of Nuclear Medicine, 29(1):67–75, 2002.
[8] C. Grova, P. Jannin, A. Biraben, I. Buvat, H. Benali, A.M. Bernard, J.M. Scarabin, and B. Gibaud. A methodology for generating normal and pathological brain perfusion SPECT images for evaluation of MRI/SPECT fusion methods: Application in epilepsy. Physics in Medicine and
Biology, 48:4023–4043, 2003.
[9] A.S. Houston, P.M. Kemp, and M.A. Macleod. A method for assessing the significance of abnormalities in HMPAO brain SPECT images. Journal of Nuclear Medicine, 35(2):239–244, 1994.
[10] H. Blumenfeld, K.A. McNally, S.D. Vanderhill, A. LeBron Paige, R. Chung, K. Davis, A.D. Norden, R. Stokking, C. Studholme, E.J. Novotny Jr, I.G. Zubal, and S.S. Spencer. Positive and negative network correlations in temporal lobe epilepsy. Cerebral Cortex, 14:892–902, 2004.
[11] J. Stoeckel, G. Malandain, O. Migneco, P.M. Koulibaly, P. Robert, N. Ayache, and J. Darcourt. Classification of SPECT images of normal subjects versus image of Alzheimer’s disease patients. In Lecture Notes in Computer Science (MICCAI 2001, Utrecht), volume 2208, pages 666–674, Berlin, Heidelberg, 2001. Springer-Verlag.
[12] P. Chauvel, J.P. Vignal, A. Biraben, J.M. Badier, and J.M. Scarabin. Multimethodological Assessment of the Epileptic Forms, chapter Stereoencephalography, pages 80–108. Springer
Verlag, New York, Pawlik G., Stefan H. edition, 1996.
[13] S.S. Spencer. Neural networks in human epilepsy : Evidence of and implications for treatment.
Epilepsia, 43(3):219–227, 2002.
[14] W.C. Shin, S.B. Hong, W.S. Tae, D.W. Seo, and S.E. Kim. Ictal hyperperfusion of cerebellum and basal ganglia in temporal lobe epilepsy: SPECT subtraction with MRI coregistration. Journal
of Nuclear Medicine, 42:853–858, 2001.
[15] J. Sojkova, P.J. Lewis, A.H. Siegel, A.M. Siegel, D.W. Roberts, V.M. Thadani, and P.D. Williamson. Does asymmetric basal ganglia or thalamic activation aid in seizure foci lateralization on ictal SPECT studies ? Journal of Nuclear Medicine, 44:1379–1386, 2003. [16] L. Lebart, A. Morineau, and K. M. Warwick. Multivariate Descriptive Statistical Analysis. Wiley
Series in probability and mathematical statistics, New York, 1984.
[17] I.G. Zubal, C.R. Harrell, E.O. Smith, Z. Rattner, G.R. Gindi, and P.B. Hoffer. Computerized three-dimensional segmented human anatomy. Medical Physics, 21(2):299–302, 1994.
[18] J. Engel. Surgical Treatment of the Epilepsies, volume 1. Raven Press, New York, 1987.
[19] R.J. Jaszczak, C.E. Floyd, and R.E. Coleman. Scatter compensations techniques for SPECT.
IEEE Trans. on Nuclear Science, 32:786–793, 1985.
[20] L-T. Chang. A method for attenuation correction in radionucleide computed tomography. IEEE
Transactions on Nuclear Science, NS-25(1):638–643, 1978.
[21] K.J. Friston, J. Ashburner, J.B. Poline, C.D. Frith, J.D. Heather, and R.S.J. Frackowiak. Spatial registration and normalization of images. Human Brain Mapping, 2:165–189, 1995.
[22] P.D. Acton and K.J. Friston. Statistical parametric mapping in functional neuroimaging: Beyond PET and fMRI activation studies. European Journal of Nuclear Medicine, 25(7):663–667, 1998. [23] F. Maes, A. Collignon, D. Vandermeulen, G. Marchal, and P. Suetens. Multimodality image registration by maximization of mutual information. IEEE Transactions on Medical Imaging, 16(2):187–198, 1997.
[24] M. Soret, P.M. Koulibaly, J. Darcourt, Hapdey S., and I. Buvat. Quantitative accuracy of dopaminergic neurotransmission imaging with 123i SPECT. Journal of Nuclear Medicine,
44(7):1184–1193, 2003.
[25] V. Frouin, C. Comtat, A. Reilhac, and M-C. Grégoire. Correction of partial-volume effect for PET striatal imaging: Fast implementation and study of robustness. Journal of Nuclear Medicine, 43(12):1715–1726, 2002.
[26] H. Matsuda, T. Ohnishi, T. Asada, Z. Li, H. Kanetaka, E. Imabayashi, F. Tanaka, and S. Nakano. Correction for partial-volume effects on brain perfusion SPECT in healthy men. Journal of
Nuclear Medicine, 44(8):1243–1252, 2003.
[27] P. Hellier, J. Ashburner, I. Corouge, C. Barillot, and K.J. Friston. Inter-subject registration of functional and anatomical data using SPM. In Lecture Notes in Computer Science (MICCAI
2002, Tokyo), pages 590–597, Berlin, Heidelberg, 2002. Springer-Verlag.
[28] E.A. Stamatakis, J.T.L. Wilson, and D.J. Wyper. Spatial normalization of lesioned HMPAO-SPECT images. NeuroImage, 14(4):844–852, 2001.
[29] C. Grova, P. Jannin, I. Buvat, H. Benali, and B. Gibaud. Evaluation of registration of ictal SPECT/MRI data using statistical similarity methods. In Lecture Notes in Computer Science
: MICCAI 2004 Saint Malo, volume 3216, pages 687–695. Springer, 2004.
[30] D. L. Collins, A. P. Zijdenbos, W. F. Baaré, and A. C. Evans. ANIMAL+ INSECT: Improved cortical structure segmentation. In Proceedings of IPMI’99, pages 210–223, 1999.
[31] M.R. Newton, S.F. Berkovic, M.C. Austin, D.C. Reutens, W.J. McKay, and P.F. Bladin. Dystonia, clinical lateralization, and regional blood flow changes in temporal lobe seizures. Neurology, 42:371–377, 1992.
[32] S. Dupont, F. Semah, M. Baulac, and Y. Samson. The underlying pathophysiology of ictal dystonia in temporal lobe epilepsy : An FDG-PET study. Neurology, 51(5):1289–1292, 1998.
[33] V. Bouilleret, M.P. Valenti, E. Hirsch, F. Semah, and I.J. Namer. Correlation between PET and SISCOM in temporal lobe epilepsy. Journal of Nuclear Medicine, 43(8):991–998, 2002.
[34] P. Ryvlin, P. Kahane, A. Arzimanoglou, and F. Andermann (Editors). Epileptic Disorders :
Temporal Pole and Mesiotemporal Epilepsy, volume 4 (Suppl. 1). John Libbey Eurotext, 2002.
[35] S. Coste, P. Ryvlin, M. Hermier, K. Ostrowsky, P. Adeleine, J.C. Froment, and F. Mauguière. Temporopolar changes in temporal lobe epilepsy: A quantitative MRI-based study. Neurology, 59(6):855–861, 2002.
[36] F. Bartolomei, F. Wendling, J-P. Vignal, S. Kochen, J-J. Bellanger, J-M. Badier, R. Le Bouquin-Jeannes, and P. Chauvel. Seizures of temporal lobe epilepsy: Identification of subtypes by coherence analysis using stereo-electro-encephalography. Clinical Neurophysiology, 110:1741– 1754, 1999.
[37] A.D. Norden and H. Blumenfeld. The role of subcortical structures in human epilepsy. Epilepsy
Behaviour, 3(3):219–231, 2002.
(a)
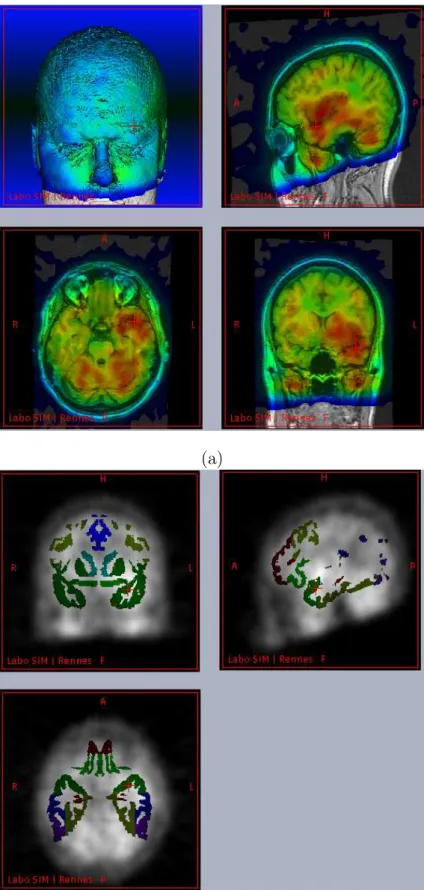
(b)
Figure 1. Multimodal data fusion for SPECT anatomic standardization analysis: (a) ictal SPECT of an epileptic patient superimposed on its MRI, both being spatially normalized to the SPM T1 template, (b) Frontal, temporal and some internal VOIs of the spatial model superimposed on the spatially normalized ictal SPECT of the same patient.
T able 1. Square cosines of the angle b et w een the cen ter of mass of eac h cluster of V O Inonl at and its pro jection on the selected principal comp onen ts. Principal comp onen ts on whic h those clusters w ere b etter represen ted (i.e., smallest angles or highest square cosines) are presen ted in b old fon t. HC performe d on he althy subje cts Before PVE correction After PVE correction Cluster name Principal comp onen t Cluster name Principal comp onen t 1 st 2 nd 3 r d 4 th 5 th 1 st 2 nd 3 r d 4 th [In ternal structures ] 0.18 0.76 0.02 0.01 0.00 [Caudate n ucleus ] 0.66 0.22 0.09 0.00 [T emp oro-mesial ] 0.41 0.30 0.10 0.07 0.06 [Occipital lateral ] 0.43 0.53 0.00 0.01 [P osterior ] 0.02 0.14 0.45 0.24 0.02 [Thalam us ] 0.07 0.00 0.56 0.19 [Remaining cortex ] 0.63 0.02 0.02 0.10 0.00 [T emp oral p ole ] 0.03 0.19 0.01 0.52 [Insula ] 0.29 0.05 0.30 0.11 [Remaining cortex ] 0.01 0.33 0.02 0.00 HC performe d on MTLE patients Before PVE correction After PVE correction Cluster name Principal comp onen t Cluster name Principal comp onen t 1 st 2 nd 3 r d 4 th 5 th 1 st 2 nd 3 r d 4 th [In ternal structures ] 0.11 0.87 [In ternal structures ] 0.31 0.62 0.05 [T emp oro-mesial ] 0.92 0.04 [T emp oral ] 0.50 0.43 0.01 [Surrounding temp oral ] 0.14 0.69 [Surrounding temp oral ] 0.0 0.10 0.55 [Remaining cortex ] 0.98 0.00 [Remaining cortex ] 0.93 0.04 0.02
−0.06 −0.04 −0.02 0.00 0.02 −0.04 −0.02 0.00 0.02 0.04 −0.06 −0.04 −0.02 0.00 0.02 −0.04 −0.02 0.00 0.02 0.04 AMYG HIPP TPOL −0.06 −0.04 −0.02 0.00 0.02 −0.04 −0.02 0.00 0.02 0.04 −0.06 −0.04 −0.02 0.00 0.02 −0.04 −0.02 0.00 0.02 0.04 CER OCC OCCL OCCM PONS −0.06 −0.04 −0.02 0.00 0.02 −0.04 −0.02 0.00 0.02 0.04 −0.06 −0.04 −0.02 0.00 0.02 −0.04 −0.02 0.00 0.02 0.04 CORT F FL FM FO FP INS WM PAR TL TM TPOSTT −0.06 −0.04 −0.02 0.00 0.02 −0.04 −0.02 0.00 0.02 0.04 −0.06 −0.04 −0.02 0.00 0.02 −0.04 −0.02 0.00 0.02 0.04 NCAU BG NLEN THAL −0.06 −0.04 −0.02 0.00 0.02 −0.04 −0.02 0.00 0.02 0.04 [Internal] [Remaining cortex] [Posterior] [Temporo−mesial]
(a) Projection on the first two principal components, HC using 5 components FM FL F FP TM WM TPOST INS CORT PAR FO TL T
OCCL OCC OCCM CER PONS AMYG HIPP TPOL NCAU THAL
BG NLEN 0.00 0.05 0.10 0.15 Cluster Dendrogram Height
Remaining cortex Posterior Temporo−mesial Internal
(b) Classification tree, HC using 5 components
Figure 2. Analysis of SPECT data from 27 healthy subjects: (a) projection of the variables (V OInonlat) on the first two principal components, (b) classification tree obtained by HC after CA using 5 components. Several clusters of anatomical structures were extracted from HC and are indicated on the dendrograms (b), namely:
temporo-mesial structures (red ‘◦’), internal structures (blue ‘×’), posterior structures
(green ‘4’) and remaining cortex (black ‘+’). The center of mass of each cluster (see ‘
∗
’) was projected on the first two principal components, and the corresponding name of the cluster is shown using the same color code and italic font. Note that better discrimination between the posterior structures and the remaining cortex clusters in (a) was actually observed on the 3rd principal component. Anatomical structures abbreviations: CORT: cortex, WM: white matter, AMYG: amygdala, HIPP: hippocampus, NCAU: caudate nucleus, BG: basal ganglia, NLEN: lenticular nucleus, THAL: thalamus, INS: insula, T: temporal, TPOL: temporal pole, TM: temporal mesial, TL: temporal lateral, TPOST: temporal posterior, F: frontal, FP: frontal pole, FO: orbito frontal, FM: frontal mesial, FL: frontal lateral, OCC: occipital, OCCM: occipital mesial, OCCL: occipital lateral, PAR: parietal, CER: cerebellum, PONS: brainstem.−0.10 −0.05 0.00 0.05 −0.04 −0.02 0.00 0.02 0.04 0.06 0.08 −0.10 −0.05 0.00 0.05 −0.04 −0.02 0.00 0.02 0.04 0.06 0.08 AMYG HIPP TPOL −0.10 −0.05 0.00 0.05 −0.04 −0.02 0.00 0.02 0.04 0.06 0.08 −0.10 −0.05 0.00 0.05 −0.04 −0.02 0.00 0.02 0.04 0.06 0.08 CER FO INS NLEN TL TM T PONS −0.10 −0.05 0.00 0.05 −0.04 −0.02 0.00 0.02 0.04 0.06 0.08 −0.10 −0.05 0.00 0.05 −0.04 −0.02 0.00 0.02 0.04 0.06 0.08 CORT F FL FM FP WM OCC OCCL OCCMPAR TPOST −0.10 −0.05 0.00 0.05 −0.04 −0.02 0.00 0.02 0.04 0.06 0.08 −0.10 −0.05 0.00 0.05 −0.04 −0.02 0.00 0.02 0.04 0.06 0.08 NCAU BG THAL −0.10 −0.05 0.00 0.05 −0.04 −0.02 0.00 0.02 0.04 0.06 0.08
[Temporo−mesial] [Surrounding temporal]
[Remaining cortex] [Internal]
(a) Projection on the first two principal components, HC using 2 components
OCCL TPOST OCC OCCM PAR CORT
F
WM FL FM FP BG
NCAU THAL HIPP AMYG TPOL
TL FO INS NLEN TM T CER PONS 0.0 0.1 0.2 0.3 0.4 Cluster Dendrogram Height
Remaining cortex Internal Temporo−mesial Surrounding temporal
(a) Classification tree, HC using 2 components
Figure 3. Analysis of ictal SPECT data from 10 MTLE patients: (a) projection of the variables (V OInonlat) on the first two principal components, (b) classification tree obtained by HC after CA using 2 components. Several clusters of anatomical structures were extracted from HC and are indicated on the dendrograms (b), namely: temporo-mesial structures (red ‘◦’), surrounding temporal structures (green ‘4’), internal structures (blue ‘×’) and remaining cortex (black ‘+’). The center of mass of each cluster (see ‘
∗
’) was projected on the first two principal components, and the corresponding name of the cluster is shown using the same color code and italic font. Note that the temporal-pole VOI is highly relevant to characterize thetemporo-mesial cluster, whereas the perfusion of the lenticular nucleus, the brainstem
and the cerebellum is associated to the surrounding temporal cluster. Anatomical structures abbreviations: CORT: cortex, WM: white matter, AMYG: amygdala, HIPP: hippocampus, NCAU: caudate nucleus, BG: basal ganglia, NLEN: lenticular nucleus, THAL: thalamus, INS: insula, T: temporal, TPOL: temporal pole, TM: temporal mesial, TL: temporal lateral, TPOST: temporal posterior, F: frontal, FP: frontal pole, FO: orbito frontal, FM: frontal mesial, FL: frontal lateral, OCC: occipital, OCCM: occipital mesial, OCCL: occipital lateral, PAR: parietal, CER: cerebellum, PONS: brainstem.
−0.08 −0.06 −0.04 −0.02 0.00 0.02 0.04 0.06 −0.06 −0.04 −0.02 0.00 0.02 0.04 0.06 Gue_I Leva_I Arn_I Gra_I Lecl_I Bli_I Leb_I Leca_I Aug_I Leve_I −0.08 −0.06 −0.04 −0.02 0.00 0.02 0.04 0.06 −0.06 −0.04 −0.02 0.00 0.02 0.04 0.06 Gue_C Leva_C Arn_C Gra_C Lecl_C Bli_C Leb_C Leca_C Aug_C Leve_C
Figure 4. Projection of the individual (SubjectHem) on the first two principal components for CA performed on ictal data of 10 MTLE patients. ###_I (in red) and ###_C (in black) state for respectively the hemispheres Ipsilateral and Contralateral to the epileptogenic focus for the corresponding patient ###. Note that a clear discrimination between ipsilateral and contralateral hemispheres was observed.