HAL Id: hal-02075046
https://hal.archives-ouvertes.fr/hal-02075046
Submitted on 18 Apr 2019HAL is a multi-disciplinary open access archive for the deposit and dissemination of sci-entific research documents, whether they are pub-lished or not. The documents may come from teaching and research institutions in France or abroad, or from public or private research centers.
L’archive ouverte pluridisciplinaire HAL, est destinée au dépôt et à la diffusion de documents scientifiques de niveau recherche, publiés ou non, émanant des établissements d’enseignement et de recherche français ou étrangers, des laboratoires publics ou privés.
Dynamic modeling of nylon mooring lines for a floating
wind turbine
Hong-Duc Pham, Patrice Cartraud, Franck Schoefs, Thomas Soulard,
Christian Berhault
To cite this version:
Hong-Duc Pham, Patrice Cartraud, Franck Schoefs, Thomas Soulard, Christian Berhault. Dynamic modeling of nylon mooring lines for a floating wind turbine. Applied Ocean Research, Elsevier, 2019, 87, pp.1-8. �10.1016/j.apor.2019.03.013�. �hal-02075046�
1
Dynamic Modeling of Nylon Mooring Lines for a Floating Wind Turbine
Hong-Duc Phama, c*, Patrice Cartrauda, Franck Schoefsa, Thomas Soulardb, Christian Berhaultb
a Institut de Recherches en Génie Civil et Mécanique- UMR CNRS 6183, Ecole Centrale de
Nantes et Université de Nantes, Nantes, France.
b Laboratoire de recherche en Hydrodynamique, Énergétique et Environnement
Atmosphérique- UMR CNRS 6598, Ecole Centrale de Nantes, Nantes, France.
c Department of Offshore Engineering, National University of Civil Engineering, Hanoi,
Vietnam.
ABSTRACT
As current attention of the offshore industry is drawn by developing pilot farms of Floating Wind Turbines (FWTs) in shallow-water between 50m and 100m, the application of nylon as a mooring component can provide a more cost-effective design. Indeed, nylon is a preferred candidate over polyester for FWT mooring mainly because of its lower stiffness and a corresponding capacity of reducing maximum tensions in the mooring system. However, the nonlinear behaviors of nylon ropes (e.g. load-elongation properties, fatigue characteristics, etc.) complicate the design and modeling of such structures. Although previous studies on the mechanical properties and modeling of polyester may be very good references, those can not be applied directly for nylon both on testing and modeling methods. In this study, first, an empirical expression to determine the dynamic stiffness of a nylon rope is drawn from the testing data in the literature. Secondly, a practical modeling procedure is suggested by the authors in order to cope with the numerical mooring analysis for a semi-submersible type FWT taking into account the dynamic axial stiffness of nylon ropes. Both the experimental and numerical results show that the tension amplitude has an important impact on the dynamic stiffness of nylon ropes and, as a consequence, the tension responses of mooring lines. This effect can be captured by the present modeling procedure. Finally, time domain mooring analysis for both Ultimate Limit State (ULS) and Fatigue Limit State (FLS) is performed to illustrate the advantages and conservativeness of the present approach for nylon mooring modeling.
Key words: Floating Wind Turbine; Numerical Modeling; Dynamic Stiffness; Nylon; Polyester; Mooring Line.
1 Introduction
For shallow-water offshore floating structures such as semi-submersibles, FPSOs, etc., the mooring lines are usually constituted of long, large diameter chain lines to provide a necessary catenary offset. For deep-water applications, hybrid mooring lines composed of chain, wire and fiber ropes (e.g. polyester, HMPE, aramid, etc.) are often used in order to reduce the weight of the mooring lines and the mooring cost. For FWTs in shallow water, the use of low modulus ropes such as polyester, nylon can provide a more compliant and cost-effective design [1] (e.g.
2
the unit length cost of nylon is about half that of chain with the same breaking strength). Obviously, longer mooring footprints would be required for polyester in order to reduce extreme tension responses. It is also interesting to note that due to the higher stiffness of polyester, the tension responses in fatigue condition are also more critical than for nylon. Consequently, that might result in a critically low fatigue life not only for polyester itself but also (more importantly) for the chain sections in the mooring lines.
Unlike rigid material, synthetic material such as polyester, nylon, etc., exhibit highly nonlinear and time-dependent load-elongation characteristics. Such behaviors should be determined by relevant tests before the design and application of those fiber rope components. The tests should exhibit not only the nonlinear behaviors of ropes as hysteretic materials but also the dynamic loading conditions that ropes undergo during operation (e.g. tension magnitude, the frequency of loading, loading history, etc.).
Testing and modeling methods for polyester have been studied by the offshore industry since the early 80’s. The outcomes of several Joint Industry Projects (JIP) have been integrated into offshore standards such as API-RP-2SM [2], DNVGL-RP-E305 [3], ABS [4], BV-NI432-DTO-R01E [5]. Although the above-mentioned methods are very good examples, those can not be applied directly on nylon.
In this study, an empirical expression of dynamic stiffness is drawn from the nylon rope testing data on the Whitehill’s wire-lay nylon rope [6]. A practical mooring analysis procedure is suggested by the authors in order to account for the dynamic stiffness of nylon ropes on the mooring line modeling of a semi-submersible type FWT. The procedure is inspired from the original methodology recommended by DNVGL RP-E305 where we try to improve the DNV’s procedure in order to capture the tension amplitude effect on dynamic mooring analysis of nylon mooring ropes.
The numerical simulation is performed using Orcaflex [7] in which two mooring systems that compose of chain-nylon-chain and chain-polyester-chain are compared. The empirical expression proposed by François et al. [8] and the fiber rope mooring analysis procedure recommended by DNVGL-RP-E305 [3] are applied for polyester. The empirical dynamic stiffness model and the mooring analysis procedure presented herein are applied for the modeling of nylon ropes.
2 An empirical formula for determining the dynamic stiffness of nylon ropes
Offshore standards and researchers have given recommendations for rope testing procedures and empirical expressions of dynamic stiffness for synthetic ropes. Generally, the dynamic stiffness of fiber ropes depends strongly on the mean tension, moderately on the tension amplitude and mildly on the frequency of loading [9], [10]. Practically, the loading frequency
3
and tension amplitude impacts are negligible for polyester [8]. Nylon, although seems to have closely similar behaviors as polyester, its responses are found to be more nonlinear than the latter [11]. Liu et al. [12] also studied the main factors influencing the dynamic stiffness of synthetic fiber ropes under cyclic loading. According to their conclusions, the mean tension is the main factor that influences significantly the dynamic stiffness, also the effects of strain amplitude and loading cycles can not be ignored. Huang et al. [13] highlighted the importance of understanding the change-in-length properties including creep, hysteresis, recovery, stiffness evolution of synthetic ropes.
The DNVGL-RP-E305 [3], Falkenberg et al. [14], [15] introduce the concept of the Syrope model with the following definitions, which are illustrated in Fig. 1.
- The original curve: the tension-stretch curve obtained during the very first and quick loading of the new ropes.
- The original working curve: the lower-bound original curve for very slow loading so that visco-elastic stretch can be obtained without delay.
- Working curves: Tension-stretch curves accounting for the historical maximum tension that the rope has been through.
- Instant-elastic (dynamic) stiffness: A stable stiffness (after stabilization of working strain) in response to very fast changes in tension under cyclic loading. The dynamic stiffness results from instant-elastic strain only. Normally, it will take only 10 to 20 cycles for polyester ropes before the dynamic stiffness become practically constant [14].
4
Falkenberg et al. [14], [15] recommend selecting a pertinent working curve for static mooring analysis to determine the floating structure excursions (i.e. the excursions at the equilibrium position due to mean environmental loads). This working curve should account for the historical maximum tension that the rope has been through. DNVGL-RP-E305 [3] requires using a correct dynamic stiffness model to calculate the designed tension responses. An earlier research by Bitting [9] reported an important factor of 3 to 4 times between the dynamic and quasi-static stiffness of nylon ropes. This, again, highlights the importance of using different stiffness models for structure excursions and tension response analysis.
Vecchio [10] and Fernandes et al. [16] proposed an empirical expression of dynamic stiffness for polyester ropes as
0
E
= α + Lm - La - δlog(T )
ρ (1)
where E
ρ : Specific modulus (N/tex); Lm: Mean load (% of MBL);
La: Load amplitude (% of MBL); T0: Period of loading;
α, , , δ: Empirical coefficients.
A non-dimensional axial stiffness of ropes can be expressed as
Kr = (La.l) / (∆l.MBL) (2) MBL: Minimum Breaking Load La: Tension amplitude (% of MBL)
l: Initial Length of the rope ∆l: Stretch
François et al. [8] proposed empirical expressions of quasi-static and dynamic stiffness for typical polyester ropes depending on the mean tension in the lines (as mentioned above the impacts of tension amplitudes and frequency of loading are considered negligible). These have been integrated into BV-NI432-DTO-R01E [5] as
Quasi-static stiffness: Krs = 13 to 15
Dynamic stiffness: Krd = 18.5 + 0.33.Lm (3)
for normally stiff polyester ropes.
5
Fig. 2. Dynamic stiffness of the wire-lay nylon rope depending on the mean tension, Lm [6].
Fig. 3. Dynamic stiffness of the wire-lay nylon rope depending on the tension amplitude, La [6].
Based on recent dynamic stiffness tests on a wire-lay 3-strand nylon rope from Huntley [6], it is found that the dynamic stiffness of the nylon rope depends strongly on both the applied mean tension and the tension amplitude. This is illustrated in Fig. 2 and Fig. 3.
An expression of dynamic stiffness for nylon can be proposed as,
Krd = a.Lm – b.La + c (4) where a, b, c are determined from a multiple linear regression on the nylon dynamic stiffness testing data reported by Huntley [6]. These values (with 95% of upper-confidence limits) are presented in Table 1.
Table 1. Empirical coefficients for determining the dynamic stiffness of the nylon rope.
a b c
6
3. Analytic catenary equations
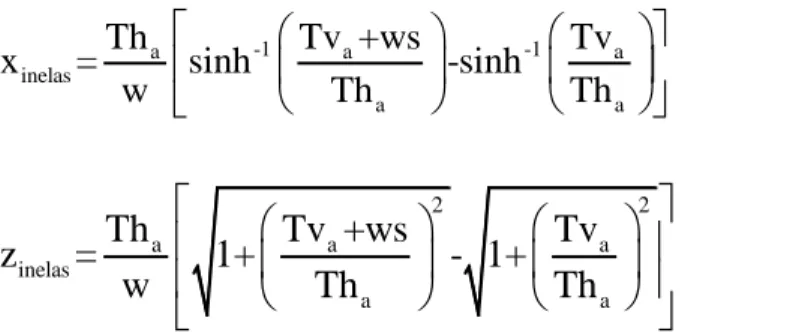
For an inextensible, flexible line without bending stiffness, the catenary shape (Fig. 4) is well known as the static equilibrium configuration of such an element. The Orcaflex finite element model of a line is illustrated in Fig. 5.
The catenary equation for inelastic lines (i.e. those are considered axially un-stretched) can be expressed as, [17] -1 -1 a a a inelas a a Th Tv +ws Tv x = sinh -sinh w Th Th (5) 2 2 a a a inelas a a
Th
Tv +ws
Tv
z
=
1+
- 1+
w
Th
Th
(6)where s is the length from the end A, w is the weight per unit length, Tha and Tva are the
horizontal and vertical tension components at the end A, respectably.
Fig. 4. The catenary shape of mooring lines. Fig. 5. Finite element model for a line. For synthetic materials with large axial elongation, it is then crucial to consider such an elastic behavior. Therefore, the catenary equations are modified as, [17]
-1 -1 a a a a a elas inelas a a Th Th Tv +ws Tv Th x =x + = sinh -sinh + K w Th Th K (7) 2 2 2 2
1
1
2
2
a a a a a elas inelas a aTv s
ws
Th
Tv
ws
Tv
Tv s
ws
z
z
K
K
w
Th
Th
K
K
(8)7
where K is the axial stiffness of the elastic line component.
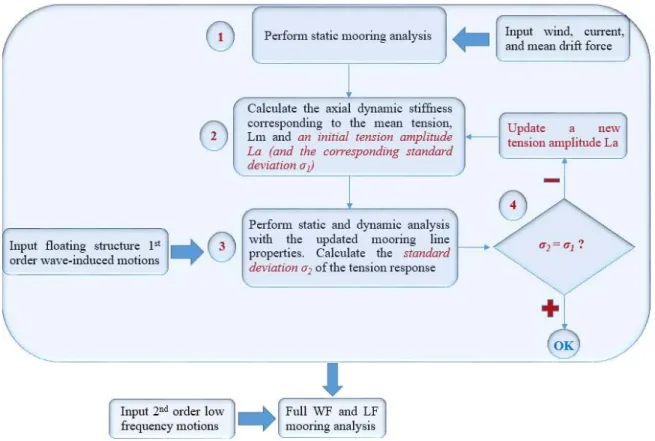
4. A practical modeling procedure for nylon mooring analysis
A mooring analysis procedure considering the dynamic stiffness of polyester ropes was proposed by Kim et al. [18] for a SPAR. Since tensions in the mooring lines of a SPAR are often dominated by slow drift motions, this procedure can not be applied for semi-submersible type floating structures where first-order wave motions are the dominating ones, Arnal et al. [19]. Also, Kim’s procedure has its limitation relating the convergent principle since the high-frequency tension component in mooring lines does not result from the motion of the SPAR but more likely from the resonance vibration of the polyester rope. Tahar et al. [20] extended the traditional elastic rod theory to allow large elongation and nonlinear stress-strain relationships for the modeling of polyester mooring lines. The empirical expression for determining the axial stiffness of polyester proposed by Bosman [21] was adopted considering a non-constant stiffness depending on the applied mean load. A similar attempt was made by Lin et al. [22] for the modeling of polyester mooring for a SPAR-type floating wind turbine. The mooring tension responses were validated against the Orcaflex software.
The recent standard DNVGL-RP-E305 [3] and Falkenberg et al. [14], [15] recommend a very practical procedure for fiber rope mooring analysis including the following steps.
- Step 1: Perform the mooring static analysis using the appropriate nonlinear working curves for each mooring line considering the mean environmental loads (i.e. if the mean tension in any of the lines is higher than the preceding highest working tension then the working curve for these lines needs to be updated).
- Step 2: Determine the mean tensions, Lm, at the top of the synthetic lines and update the model with an axial stiffness depending on the mean tension, Lm (the empirical expression as Eq. (3) can, therefore, be applied without difficulty). A stress-free length of the lines corresponds to this stiffness and the mass per unit length of the line are also updated.
- Step 3: Perform static and dynamic analysis with the updated mooring line properties.
Since this procedure ignores the tension amplitude effect, it can not be applied for the dynamic modeling of nylon ropes. Based on that, a modified procedure is suggested by the authors for the numerical mooring analysis of a semi-submersible type floating wind turbine considering the dynamic axial stiffness of nylon ropes. The present procedure composed of the following steps that were basically proposed by DNVGL-RP-E305 [3], Falkenberg et al. [14], [15], but
8
some modifications are added (highlighted in red color in Fig. 6.) in order to take into account the impact of the tension amplitude on the dynamic stiffness of nylon.
- Step 1: Same as above.
- Step 2: Determine the mean tension, Lm, at the top of each synthetic line and update the model with an axial stiffness (determined by the Eq. (4)) depending on the mean tension, Lm, and an initial tension amplitude, La (with the corresponding standard deviation, 1
2
La
), chosen optionally. A stress-free length of the lines corresponds to this stiffness and the mass per unit length of the line are also updated.- Step 3: Perform static and dynamic analysis with the updated mooring line properties. Calculate the standard deviation σ2 of the tension response.
- Step 4: Check if the convergent criterion σ2= σ1 is satisfied with a certain tolerance.
If not, go back to step 2 and input a new tension amplitude, La, and continue the procedure iteratively up to convergence.
Fig. 6. Mooring analysis procedure taking into account the impact of tension amplitudes on the dynamic stiffness of nylon ropes.
9
The idea is to find a convergent dynamic stiffness for each sea state based on the empirical expression in Eq. (4) for the specific mean tension and the convergent tension amplitude determined for each sea state. As can be seen in Fig. 6, the present procedure works as an iterative process in order to determine a convergent dynamic stiffness of the nylon rope for the sea state by comparing the standard deviation of the input tension amplitude with the standard deviation of the tension response. The compromise is implied, however, by comparing the standard deviation of a deterministic loading process (i.e. with a constant tension amplitude of variation) with the standard deviation of a random tension response process due to the floating structure wave-frequency motions. In fact, it can be seen that the dynamic stiffness tests are performed for regular loading where the tension amplitude is related to its standard deviation asLa1 2 . However, due to the fact that the incoming waves are normally irregular processes, the tension responses must have the same characteristics. For that reason, we have to accept a compromise by choosingLa2 2as tension amplitude of the irregular tension response in order to apply the present empirical dynamic stiffness model for irregular sea states. First, for a harmonic signal, the amplitude is equal toLa1 2. Secondly, an irregular process can be described by the sum of a very large number of sinusoidal processes (with different amplitudes and phases). Therefore, in our opinion, it seems acceptable to assume a tension amplitude,La2 2, to represent the variation of the tension response for each
specific irregular sea state. However, validation with field measurements on nylon mooring lines seems necessary to check the appropriateness of this assumption. Although ones might also argue that the convergence check in the present procedure (Fig. 6) should be made for both wave frequency and low frequency motions, we believe that it would be difficult and computationally expensive considering them at the same time by using coupled time domain simulations. Moreover, since low frequency motions are small compared to the wave frequency responses for semi-submersible type FWTs (or at least for existing concepts) which is the subject of this study, it seems, therefore, acceptable not to consider low frequency motions in the convergence check. However, the converged dynamic stiffness once determined will be updated in the model in order to calculate the mooring responses considering the coupled wave and low frequency motions.
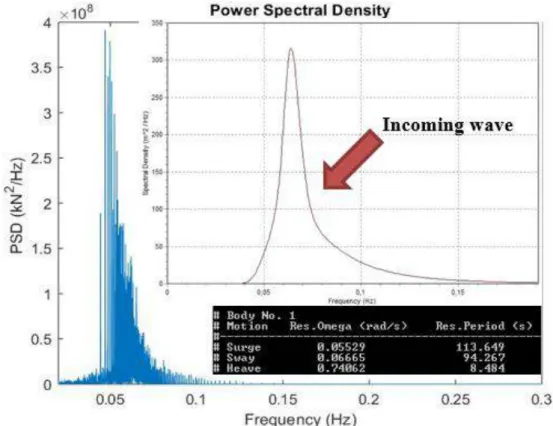
The Power Spectral Density (PSD) of the tension response in a mooring line is presented in the Fig. 7 showing clear dominance of wave frequency responses.
10
Fig. 7. Power spectral density of the incoming wave and the tension response.
5 Dynamic modeling of fiber mooring ropes
The primary objective of this section is to assess the impact of the nylon rope dynamic stiffness on the dynamic behaviors of mooring lines in real sea conditions by applying the suggested nylon mooring analysis procedure described in Fig. 6 and the empirical expression of nylon rope dynamic stiffness in Eq. (4). Dynamic mooring analysis is performed for both ULS and FLS cases in order to investigate the impact of the present nylon dynamic stiffness model on both strength and fatigue design of mooring lines.
A chain-polyester-chain mooring system and a chain-nylon-chain system are also compared to study the impact of the different stiffness cases corresponding to the two synthetic materials on the design motions and tension responses of the system.
5.1. Floating structure and mooring line properties
The mooring configuration studied in this paper is derived from the 2 MW FWT which is installed at the SEM-REV test site since 2017 as part of the FP7-EU FLOATGEN project. The French Atlantic test site SEM-REV is located 20 km off the coast of Le Croisic in Loire Atlantique, Berhault et al. [23]. The mean water depth of the site is taken as 36 m in this study. The considered FWT has a total mass of about 5000 t and a draft of approximately 7 m. The floater is considered in this study as a square ring with a 36 m width, a height of 10 m, and a 21 m wide moonpool. The wind turbine’s nacelle is located 60 m above the free surface. The
11
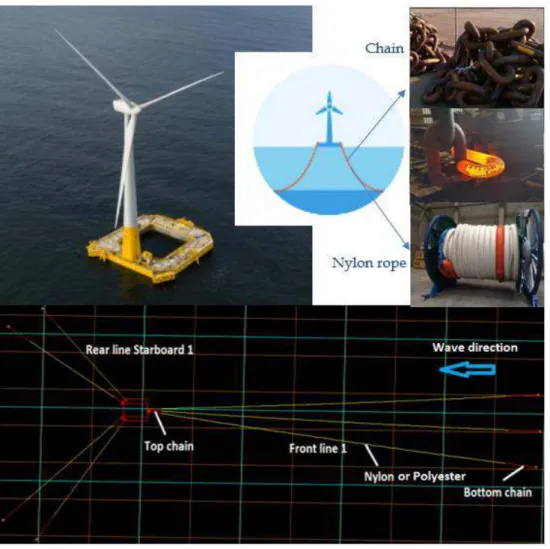
floating structure model is illustrated in Fig. 8. The layout of the mooring system connected to a semi-submersible type FWT is illustrated in Fig. 9 in which a line composed of an upper part and a touchdown part made of chain, a middle part made of nylon. A similar floating structure and mooring configuration have been published by Spraul et al. [24] based on the publically available information from IDEOL and the Ecole Centrale de Nantes. However, ones should be aware that the floater and mooring characteristics used in this study were selected only for the study purpose and are not representative of the IDEOL’s real floating structure and the FLOATGEN mooring system.
Fig. 8. Left- The FLOATGEN FWT [25]; Right- The floating structure modeled by HydroStar [26].
12
Fig. 9. The layout of the floating structure and its hybrid mooring lines.
The mooring line properties are presented in Table 2 in which the same minimum breaking strength is chosen for all the mooring components.
Table 2. Mooring line properties. Materials/Properties Diameter (m) Axial stiffness EA_dynamic (kN) Minimum Breaking Strength (kN)
Nylon 0.216 Determined by the Eq. (4)
and the procedure Fig. 6 10.000E3 Polyester 0.188 Determined by the Eq. (3)
and the DNVGL's procedure 10.000E3
Chain/R4S 0.095 1.10E6 9.987E3
5.2. Dynamic mooring analysis
For simplification, wind and current loads are approximated as a steady contribution included in the mean tension. The mooring lines dynamic analysis is performed using OrcaFlex with a simulation duration set to 3 hours. The hydrodynamic database is calculated using HydroSTAR. The wave-frequency and low-frequency floating-body motions are then computed within OrcaFlex using a coupled analysis with the mooring system. Although no dynamic wind forces are considered, the wind turbine assembly has an influence on the mass and inertia of the
13
system. Quadratic viscous damping on the structure is also included in order to achieve realistic vertical motions.
Table 3. Extreme and moderate sea states at the SEMREV sea test site.
Sea state Spectra type Hs (m) Tp (s) Gamma
Extreme -100 year return period Jonswap 10 15.7 3.3
Moderate - Fatigue Jonswap 2.61 13.8 3.3
The extreme and moderate sea states at the SEMREV sea test site (as presented in Table 3) are used in the calculation.
5.2.1. Dynamic modeling of nylon mooring ropes
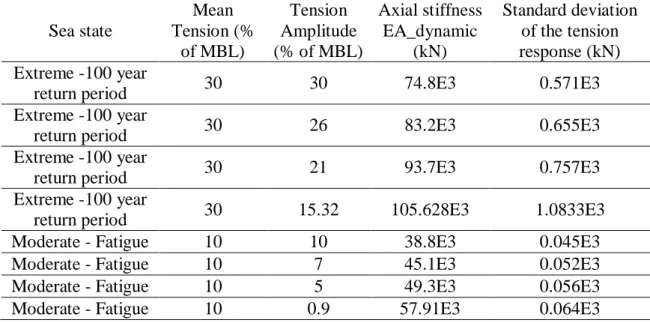
The fiber rope mooring analysis procedure presented in Fig. 6 is applied to determine the dynamic tensions in mooring lines based on the convergent dynamic stiffness determined for each specific sea state. The procedure starts with a tension amplitude, La, that is equal to the mean tension, Lm, (the lowest realistic stiffness case in our experience) then converges very quickly after a few iterations. For instance, the dynamic stiffness case, 30 % +- 15.32 % of MBL, determined for the ULS case represents the mean tension, Lm, at 30 % of MBL and the convergent tension amplitude, La, equals to 15.32 % of MBL, determined by the procedure. The corresponding convergent dynamic stiffness of 10 % +- 0.9 % of MBL is found for the FLS case. The results presented in Table 4 show the important impact of the tension amplitude on the dynamic stiffness of nylon and the resulting dynamic tension responses in the mooring lines. The corresponding platform motion statistics are presented in Table 5.
Table 4. Different dynamic stiffness cases of the nylon rope and the resulting standard deviation of the tension response.
Sea state Mean Tension (% of MBL) Tension Amplitude (% of MBL) Axial stiffness EA_dynamic (kN) Standard deviation of the tension response (kN) Extreme -100 year
return period 30 30 74.8E3 0.571E3
Extreme -100 year
return period 30 26 83.2E3 0.655E3
Extreme -100 year
return period 30 21 93.7E3 0.757E3
Extreme -100 year
return period 30 15.32 105.628E3 1.0833E3
Moderate - Fatigue 10 10 38.8E3 0.045E3
Moderate - Fatigue 10 7 45.1E3 0.052E3
Moderate - Fatigue 10 5 49.3E3 0.056E3
14
Table 5. Different dynamic stiffness cases of the nylon rope and the resulting platform motions.
Stiffness case / Motions
30 +- 30 % MBL 30 +- 26 % MBL
Mean STD Min Max Mean STD Min Max
Surge (m) -0.58 5.84 -25.4 13.8 -0.62 6.2 -25.7 14.56 Sway (m) -0.01 0.02 -0.08 0.06 -0.01 0.02 -0.1 0.09 Heave (m) 0.02 2.53 -9.93 8.34 0.03 2.53 -9.93 8.31 Roll (deg) 0 0.01 -0.02 0.02 0 0.01 -0.02 0.02 Pitch (deg) -0.51 2.58 -8.89 7.14 -0.51 2.57 -8.87 7.13 Yaw (deg) 0.06 0.01 0.02 0.09 0.06 0.01 0.02 0.09 30 +- 21 % MBL 30 +- 15.32 % MBL
Mean STD Min Max Mean STD Min Max
Surge (m) -0.69 6.54 -27.5 15 -0.81 6.98 -30.30 15.40 Sway (m) -0.01 0.02 -0.12 0.11 -0.01 0.02 -0.16 0.16 Heave (m) 0.03 2.53 -9.94 8.27 0.04 2.54 -9.96 8.23 Roll (deg) 0 0.01 -0.02 0.02 0.00 0.01 -0.02 0.03 Pitch (deg) -0.52 2.55 -8.85 7.01 -0.53 2.51 -8.81 6.68 Yaw (deg) 0.06 0.01 0.01 0.1 0.06 0.01 0.01 0.11
Fig. 10. Dynamic tension of a mooring line in ULS condition applied the present fiber rope mooring analysis procedure in Fig. 6.
Fig. 11. Dynamic tension of a mooring line in FLS condition applied the present fiber rope mooring analysis procedure in Fig. 6.
9.00E+02 2.90E+03 4.90E+03 6.90E+03 1900 1920 1940 1960 1980 2000 E ff ev ti v e T en si o n ( k N ) Time (s)
Effective Tension at Fairlead - Front Line 1
30% +- 30% of MBL 30% +- 26% of MBL 30% +- 21% of MBL 30% +- 15.32% of MBL 8.00E+05 9.00E+05 1.00E+06 1.10E+06 1.20E+06 1900 1920 1940 1960 1980 2000 E ff ec ti v e T ensi o n ( N ) Time (s)
Effective Tension at Fairlead - Front line 1
10% +- 10% of MBL 10% +- 7% of MBL 10% +- 5% of MBL 10% +- 0.9% of MBL
15
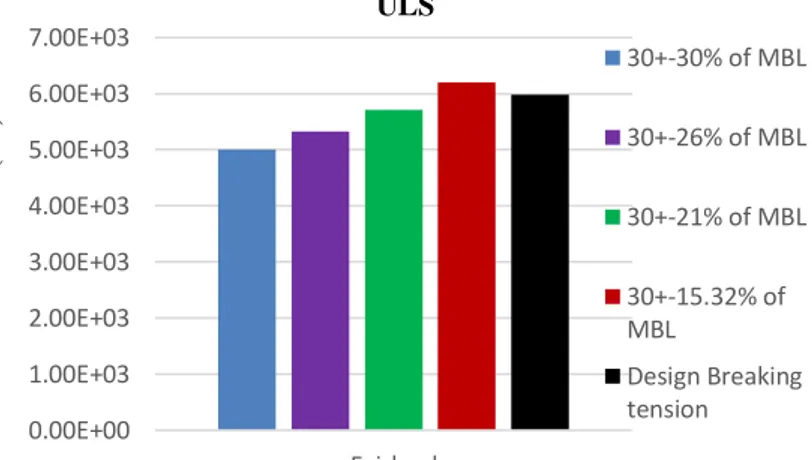
Fig. 10 and Fig. 11 show the tension time histories at the fairlead point of the front line 1 comparing different cases of stiffness (i.e. with the same mean tension but different tension amplitudes). It is noted that at the same mean tension, with a lower tension amplitude, the rope is stiffer, and that results in more severe tension responses in the line (both in peak and trough values). This confirms the important impact of the tension amplitude on the dynamic stiffness of nylon ropes and the resulting dynamic tension in both strength and fatigue conditions. The maximum design tension of the mooring component is chosen as
MBL Tmax_design=
SF (9)
where MBL - The Minimum Breaking Load of the mooring component.
SF – The minimum safety factor of the mooring components taken as 1.67 according to API RP 2SK [27].
Fig. 12. Comparison of maximum tensions for different cases of stiffness with the design breaking tension (i.e. which considers the safety factor of 1.67 according to API RP 2SK [27]). It can be seen in Fig. 12 that if the tension amplitude is not correctly considered while determining the rope stiffness, the maximum tension in the mooring lines can be underestimated. Indeed, the line is still considered correctly designed for the three stiffness cases (30 % +- 30 % of MBL, 30 % +- 26% of MBL, 30 % +- 21 % of MBL) whereas it has already failed if the convergent dynamic stiffness (i.e. determined following the procedure in Fig. 6), 30 % +- 15.32 % of MBL is considered.
As there is currently limited publically available research on the fatigue behavior of nylon ropes, the fatigue analysis will be performed hereafter for only the chain section at the fairlead point. This, however, shows the importance of the present dynamic stiffness model on the global fatigue responses of the mooring lines.
0.00E+00 1.00E+03 2.00E+03 3.00E+03 4.00E+03 5.00E+03 6.00E+03 7.00E+03 Fairlead M axi m u m T en si o n ( k N ) ULS 30+-30% of MBL 30+-26% of MBL 30+-21% of MBL 30+-15.32% of MBL Design Breaking tension
16
The T-N fatigue curve approach according to API RP 2SK [27] is applied as
-m
N=K.R
(10)where N - the number of cycle to failure under a tension range R K = 1000, m = 3 for studlink chain [27]
The fatigue damage accumulation is calculated following the Palmgren-Miner’s rule,
1 1 1 1 n n m i i i D R N Ri K
(11)where Ri - the tension range at tension cycle number i.
Fig. 13. Expected fatigue lives for different stiffness cases (the fatigue life in each case is
already consider a safety factor of 3 according to API RP 2SK [27]).
The time domain fatigue analysis is performed by Orcaflex. Fig. 13 compares the fatigue life of the front line 1 at the fairlead point for different cases of stiffness. It shows that the convergent dynamic stiffness model gives a more conservative fatigue life estimate. For instance, the fatigue life considering the dynamic stiffness equivalent to the case 10 +- 10% of MBL is about 89 years whereas it is only about 22 years for the convergent dynamic stiffness case, i.e. 10% +- 0.9% of MBL.
5.2.2. Comparison of chain-nylon-chain and chain-polyester-chain mooring systems Two mooring systems composing of chain-nylon-chain and chain-polyester-chain are compared to study the impact of the different cases of stiffness for the two synthetic materials on mooring line responses. The same MBL (as presented in Table 2) and the same mean tensions in each sea state are chosen for the two mooring systems in order to investigate the required fiber rope lengths and the resulting tension responses. The un-stretched lengths of polyester and nylon ropes are chosen according to the mean tension for each sea state. For this,
0 20 40 60 80 100 Fairlead F at igu e li fe ( y ear s) FLS 10+-10% of MBL 10+-8% of MBL 10+-5% of MBL 10+-0.9% of MBL
17
the quasi-static stiffness (as in Eq. (3)) and the static modulus reported Varney et al. [28] are used for polyester and nylon respectively.
The line characteristics and motion statistics of the floating structure are presented in Tables 6 and 7. It can be seen that at the same mean tension significantly higher stiffness is found for polyester. Consequently, that results in not only longer required un-stretched lengths of the lines but also restricted levels of motions corresponding with more severe dynamic tension responses.
Table 6. Mooring line properties
Materials/Properties Mean Tension
Axial Stiffness EA_dynamic (kN) Un-stretched length (m) Nylon 30 % of MBL 105.628E3 681.195 Polyester 30 % of MBL 284E3 722.530 Nylon 10 % of MBL 57.91E3 713.896 Polyester 10 % of MBL 218E3 732.362
Table 7. Motion statistics Stiffness cases / Motions Surge (m) Sway (m) Heave (m) Roll (deg) Pitch (deg) Yaw (deg) Mean -0.81 -0.01 0.04 0.00 -0.53 0.06 Nylon STD 6.98 0.02 2.54 0.01 2.51 0.01 30% of MBL Min -30.30 -0.16 -9.96 -0.02 -8.81 0.01 Max 15.40 0.16 8.23 0.03 6.68 0.11 Mean -1.35 0.00 -0.40 0.00 -0.56 0.06 Polyester STD 6.98 1.11 2.55 0.18 2.16 0.47 30% of MBL Min -27.80 -5.83 -9.31 -1.06 -6.95 -3.39 Max 16.31 4.82 7.17 1.18 6.54 2.35 Mean -0.04 0.00 -0.01 0.00 0.00 0.00 Nylon STD 0.98 0.00 0.77 0.00 1.43 0.00 10% of MBL Min -4.03 -0.01 -2.50 -0.01 -4.09 0.00 Max 2.65 0.01 2.30 0.01 4.13 0.00 Mean -0.30 0.00 -0.08 0.00 -0.14 0.06 Polyester STD 2.07 0.01 0.72 0.00 1.37 0.02 10% of MBL Min -6.23 -0.04 -2.24 -0.01 -3.55 0.01 Max 4.84 0.03 1.87 0.01 3.18 0.13
The tension responses in both ULS and FLS conditions are also compared in Fig. 14 and Fig. 15. The significant increases in tension extremes (i.e. peak and trough) is found in the
chain-18
polyester-chain mooring system. This confirms the advantage of nylon for reducing the extreme tension responses in mooring lines, which is favorable for both extreme and fatigue designs.
Fig. 14. Tension responses, ULS
Fig. 15. Tension responses, FLS
6. Conclusions and discussion
This study focuses on the dynamic modeling of nylon ropes in mooring line design for a semi-submersible type FWT. An empirical expression of dynamic stiffness for nylon is drawn from the experimental data in the literature. This confirms that the testing and modeling methods for polyester can not be applied directly to nylon. Specifically, unlike polyester, the tension amplitude effect is important and should not be ignored for nylon ropes. A practical mooring analysis procedure is then suggested by the authors (by modifying the fiber rope mooring analysis procedure recommended by DNVGL [3]) in order to cope with this modeling issue. The numerical results show the advantages and conservativeness of the present nonlinear dynamic stiffness model for nylon mooring modeling in both ULS and FLS cases. However, comparison with field measurements on real nylon mooring lines or dynamic stiffness tests under irregular loading are necessary in order to validate and improve our model. Furthermore,
0.00E+00 2.00E+03 4.00E+03 6.00E+03 8.00E+03 1.00E+04 1600.0 1650.0 1700.0 1750.0 1800.0 E ff ec ti v e T ens io n (k N ) Time (s) ULS Nylon Polyester 0.00E+00 5.00E+02 1.00E+03 1.50E+03 2.00E+03 2.50E+03 3.00E+03 1600.0 1650.0 1700.0 1750.0 1800.0 E ff ec ti v e T en si o n ( k N ) Time (s) FLS Nylon Polyester
19
the coupled aero-hydrodynamic analysis could be of great importance for the modeling of FWT responses but is not considered in this research.
Two mooring systems that compose of chain-nylon-chain and chain-polyester-chain are compared. The results show the advantage of nylon on reducing the required mooring line lengths and tension responses. These are favorable for both strength and fatigue design of the system.
As mentioned above, there has been little research on fatigue characteristics of the recent nylon ropes (i.e. those are integrated with new coating technologies and fatigue-reducing rope construction). Ridge et al. [29] studied a 3-strand nylon subrope manufactured by Bridon by applying accelerating fatigue tests. The fatigue analysis results using the nylon fatigue curve proposed by the same research showed a better fatigue behavior of nylon against the chain. However, whether or not that fatigue testing data can be extrapolated to lower tension levels is still really a concern. For this, a comprehensive study on the critical fatigue damage mechanisms of nylon should be the topic of future work.
Acknowledgment
This work would not have been possible without the funding from the Vietnamese scholarship program 911, the financial support from the MHM EMR project led by France Energies Marines (FEM) for in-service monitoring of mooring systems for marine renewable energy devices and the FP7-EU FLOATGEN project for the full-scale test of the first French FWT - FLOATGEN. The authors would also like to thank Charles SPRAUL (FEM) for his share of knowledge on synthetic materials and performing mooring calculation in Orcaflex.
References
[1] Weller S.D., Johanning L., Davies P., Banfield S.J. Synthetic mooring ropes for marine renewable energy applications, Renew. Energy. 83 (2015) 1268–1278.
[2] American Petroleum Institute. API-RP-2SM. Design, Manufacture, Installation, and Maintenance of Synthetic Fiber Ropes for Offshore Mooring, (2014).
[3] DNVGL. RP-E305. Design, testing and analysis of offshore fibre ropes, (2015).
[4] American Bureau of Shipping. Guidance Notes on the Application of Fiber Rope for Offshore Mooring. (2014).
[5] Bureau Veritas. Guidance Note NI 432 DTO R01E, Certification of Fibre Ropes for Deepwater Offshore Services. (2007).
[6] Huntley M.B. Fatigue and Modulus Characteristics of Wire-Lay Nylon Rope. MTS/IEEE Oceans Conference Proceedings. Monterey, CA, USA. (2016).
20
[7] Orcina. User Manual Online at
http://www.orcina.com/SoftwareProducts/OrcaFlex/Documentation, (2012).
[8] François M., Davies P. Fibre rope for Deepwater Mooring: A Practical Model for The Analysis of Polyester Mooring Systems. Proc. of Rio O&G conf. Rio de Janeiro, Brazil, (2000). [9] Bitting K.R. The dynamic behavior of nylon and polyester line. Coast Guard Research and Development Center, USCG-D-39-80, Apr. (1980).
[10] Del Vecchio C.J.M. Light Weight Material for Deepwater Mooring. PhD thesis. University of Reading, UK. (1992).
[11] François M., Davies P., Grosjean F., Legerstee F. Modelling fibre rope load–elongation properties – polyester and other fibres. OTC 20846. Houston, USA. 2010.
[12] Liu H., Huang W., Lian Y., Li L. An experimental investigation on nonlinear behaviors of synthetic fiber ropes for deepwater moorings under cyclic loading, Appl. Ocean Res. 45 (2014) 22–32.
[13] Huang W., Liu H., Lian Y., Li L. Modeling nonlinear creep and recovery behaviors of synthetic fiber ropes for deepwater moorings, Appl. Ocean Res. 39 (2013) 113–120.
[14] Falkenberg E., Ahiem V., Yang L., DNVGL. Best Practice for Analysis of Polyester Rope Mooring Systems. Offshore Technology Conference. OTC-27761-MS, Houston, Texas, USA, 1–4 May (2017).
[15] Falkenberg E., Yang L., Ahiem V. The Syrope Method for Stiffness Testing Of Polyester Ropes. Proceedings of the ASME 2018 37th International Conference on Ocean, Offshore and Arctic Engineering. (2018) 3782–3787.
[16] Fernandes A.C., Del Vecchio C.J.M, Castro G.A.V. Mechanical properties of polyester mooring cables. International Journal of Offshore and Polar Engineering. (1999). 9:208–213. [17] Orcina. Comparison of Orcaflex with theoretical results.
https://www.orcina.com/SoftwareProducts/OrcaFlex/Validation/99-105%20Theoretical%20results.pdf. 24 sept 2007. (accessed 29 October 2018)
[18] Kim M., Ding Yu., Zhang Jun. Dynamic simulation of Polyester Mooring Lines. Deepwater Mooring Systems Concepts, Design, Analysis, and Material. Houston, Texas, 101-114, 2003.
[19] Arnal V., Soulard T., Berhault C. Etude De Sensibilite Aux Chargements Hydrodynamiques Et Aerodynamique Pour Les Eoliennes Offshores Flottantes, Dans Des Conditions Extremes. 15eme journée d’hydrodynamique, 22-24 novembre 2016, Brest, France. [20] Tahar A., Kim M.H. Coupled-dynamic analysis of floating structures with polyester mooring lines, Ocean Eng. 35 (2008) 1676–1685.
[21] Bosman R.L.M., Hooker J. The Elastic Modulus Characteristics of Polyester Mooring Ropes. OTC 10779 (1999) 2–6.
[22] Lin Z., Sayer P. An enhanced stiffness model for elastic lines and its application to the analysis of a moored floating offshore wind turbine. Ocean Eng. 109 (2015) 444–453.
21
[23] Berhault C., Le Crom I., Le Bihan G., Rousset J.M. SEM-REV, de 2007 à 2016, du projet au site opérationnel: retour d’expérience. 14èmes Journées Nationales Génie Côtier – Génie Civil, Toulon, 2016.
[24] Spraul C., Pham H.D, Arnal V., Reynaud M. Effect of Marine Growth on Floating Wind Turbines Mooring Lines Responses. In AFM 2017 23ème Congrès Français de Mécanique, 28 Aug – 1 Sept, 2017.
[25] Ecole Centrale de Nantes. Floatgen, la première éolienne en mer en France. https://www.ec-nantes.fr/actualites/floatgen-la-premiere-eolienne-en-mer-en-france-170471.kjsp (accessed 29 October 2018)
[26] Bureau Veritas. HydroStar for expert user manual. June 2016.
[27] American Petroleum Institute. API-RP-2SK. Design and Analysis of Stationkeeping Systems for Floating Structures. 2005.
[28] Varney A., Taylor R., Seelig W. Evaluation of Wire-Lay Mooring Lines in a Wave Energy Device Field Trial. MTS/IEEE Oceans 2013 Conference Proceedings, 2013.
[29] Ridge I.M.L., Banfield S.J., Mackay J. Nylon fibre rope moorings for wave energy converters, MTS/IEEE Seattle, Ocean. (2010) 0–9.

![Fig. 2. Dynamic stiffness of the wire-lay nylon rope depending on the mean tension, Lm [6]](https://thumb-eu.123doks.com/thumbv2/123doknet/11340480.284077/6.892.277.601.109.381/fig-dynamic-stiffness-wire-nylon-rope-depending-tension.webp)
![Fig. 8. Left- The FLOATGEN FWT [25]; Right- The floating structure modeled by HydroStar [26]](https://thumb-eu.123doks.com/thumbv2/123doknet/11340480.284077/12.892.108.784.330.661/fig-left-floatgen-right-floating-structure-modeled-hydrostar.webp)