HAL Id: hal-01196819
https://hal.inria.fr/hal-01196819
Submitted on 12 Sep 2019
HAL is a multi-disciplinary open access archive for the deposit and dissemination of sci-entific research documents, whether they are pub-lished or not. The documents may come from teaching and research institutions in France or abroad, or from public or private research centers.
L’archive ouverte pluridisciplinaire HAL, est destinée au dépôt et à la diffusion de documents scientifiques de niveau recherche, publiés ou non, émanant des établissements d’enseignement et de recherche français ou étrangers, des laboratoires publics ou privés.
Alberto E. Garcia, Jaime Galán-Jiménez, Laurent Lefèvre, Hermann de Meer,
Thierry Monteil, Paolo Monti, et al.
To cite this version:
Alfonso Gazo Cervero, Michele Chincoli, Lars Dittmann, Andreas Fischer, Alberto E. Garcia, et al.. Green Wired Networks. Large-Scale Distributed Systems and Energy Efficiency, Wiley, pp.41-80, 2015, 9781118864630. �10.1002/9781118981122.ch3�. �hal-01196819�
Green Wired Networks
Chapter Contributors: Alfonso Gazo Cervero, Michele Chincoli, Lars Dittmann, Andreas Fischer, Alberto E. Garcia, Jaime Galán-Jiménez, Laurent Lefevre, Hermann de Meer, Thierry Monteil, Paolo Monti, Anne-Cecile Orgerie, Louis-Francois Pau, Chris Phillips, Sergio Ricciardi, Remi Sharrock, Patricia Stolf, Tuan Trinh, Luca ValcarenghiAfter highlighting the significant energy consumption of existing wired communication networks, this chapter considers various means of operating such networks more efficiently. The chapter examines the components that make up wired communications network and their differing characteristics between the access and core, as well as patterns of traffic behaviour. Once this is done, the chapter focuses on static (network planning) and dynamic (traffic engineering) schemes that can be used to reduce the energy consumption of networks. The chapter also pays attention to a number of challenges / open research questions that need to be resolved prior to the implementation of such schemes. These include issues with migration and resilience. Finally a summary reviews the key themes that have been covered.
We use the term “wired” to represent any network where the communication channel between nodes is confined to a specific conduit rather than relying on free-space radiation of the signal. This includes systems based on metal conductors as well as glass fibre, with and without in-line amplification. Conversely we reserve the term “wireless” communication for systems involving radio access. Improving the efficiency of these latter systems is addressed in Chapter 4. The aim is to make wired networks operate in an energy-efficient way since energy expenditure has become a major concern with the continued development of the Internet [c1]. It also has considerable impact on the environment [c2]. In the last few years, energy consumption issues have received much attention from the government, general public and telecommunication operators [c3][c4]. Firstly, with the sustained growth of the customer population and greater use of high-bandwidth services such as streaming video, Internet Service Providers (ISPs) and telecom companies have needed to increase network capacity and expand their reach to support these demands. Associated with the use of more powerful and power-hungry network equipment, the operational expenditure, particularly in terms of the cost of electricity, is a significant factor particularly due to the increasing energy prices [c5]. Increasing energy usage is also an environmental problem particularly due to the release of carbon dioxide (CO2) into the atmosphere. It is also a political one, especially as politicians come to terms with the consequences of the anticipated environmental changes.
The power consumption of Information and Communication Technologies (ICT) includes the power consumption of servers, network infrastructure and end-user devices. It accounts for about 2% of the world’s power consumption rising to 10% for developed countries like the UK [c6]. It is anticipated that this will increase notably over the next few years. For example, non-domestic energy consumption is expected to grow by a further 40% by 2020 [c7]. Although it seems a small fraction of overall power consumption, the absolute value of 900 Billion kWh/year, is equal to the power consumption of Central and South America together [c2].
Within the field of telecommunications research, energy management can be divided into two segments: wireless networks and wired (fixed) networks. Since the operation of (mobile or unattended) user equipment in many wireless networks is limited by battery power, considerable effort has been devoted to devising new energy management schemes for this sector. For example, many energy-efficient schemes have been proposed for wireless ad hoc sensor networks [c8][c9]. There is also much ongoing research into energy saving within cellular network infrastructure, including the use of low energy (and limited functionality) base stations, coding & multiplexing, and exploiting residential wired access points [c10]. Conversely, it is generally assumed that wired networks, including fixed user equipment, have access to abundant power, implying there is no need to save energy. Consequently, wired networks energy consumption is inefficient and, moreover, there is considerable room for improvement [c11]. Furthermore, technological advances, particularly in respect to Dense-Wave Division Multiplexing (DWDM), mean that the bandwidth of physical devices is no longer a restriction on the capacity of the Internet; instead it is limitations in the achievable energy density [c1].
Commonly the wired network is considered to be composed of several parts: the access network, the metro(politan) network and the carrier (core) network. From the point of view of power consumption, research indicates that in the near future, the core network’s power consumption may become the most significant element of the overall communications network infrastructure [c12]. Therefore a lot of research is now focused on the regional Tier-2 IP core networks employing various DWDM architectures.
The remainder of the chapter commences in Section 3.1 with an assessment of socio-economic mechanisms that can be used to promote more energy-efficient use of the wired network infrastructure. This is followed by a brief review of principle network components and typical wired-network architectures in Sections 3.2 and 3.3, respectively. Section 3.4 then gives consideration to how traffic is evolving both due to the increasing number of users on wired networks and also as a result of additional services being deployed across the Internet. Understanding these changing traffic patterns is essential if networks are to be operated efficiently. Then, we consider a number of energy-saving mechanisms. These are separated into static mechanisms in Section 3.5.1 and dynamic ones in Section 3.5.2. Static mechanisms or network planning [c13][c14], consider the energy consumption while planning and configuring
the network. Dynamic, or traffic engineering methods, make use of a prearranged infrastructure in an energy-efficiency way. These approaches include infrastructure sleeping, rate-adaptation and network virtualization. Infrastructure sleeping lets routers and links be switched off or enter a low power consumption state when network traffic demand is light [c15]; rate-adaptation [c16] adjusts the power consumption according to the required transmission rate of the traffic. Finally, network virtualization [c17], or network machine migration [c18][c19], allows several network component instances to run on the same physical platform when performance requirements permit the saving of energy through consolidation. Despite these various schemes, significant challenges remain. These are considered in Section 3.6. Finally, Section 3.7 provides a brief summary of the key findings and the issues that still need to be addressed.
3.1 Economic Incentives and Green Tariffing
Whereas later sections in Chapter 3 consider design and traffic measures to achieve energy savings in communications networks, the present section deals with economic, regulatory and business related methods. It is estimated that such approaches, if adopted by users, could achieve a very large impact.
3.1.1 Regulatory, Economic and Microeconomic Measures
Various measures are available to influence energy usage. We consider several significant examples.
3.1.1.1 Regulatory Dimensions
Communications carriers are universally subject to operating licenses, specified, awarded and controlled by communications regulators [c20]. Electricity and energy production is also, in some countries, subject to regulations, specified, awarded and controlled by energy regulators [c21]. Policies by both categories of regulators must abide to national and international laws or treaties dealing with climate change [c22]; however, at this stage, no communications regulators are known to have included yet any mandatory requirements with “green” objectives in their license awarding schemes. Energy reduction objectives are therefore “de facto” implemented by communications equipment manufacturers, to help their clients, the operators, achieve operating cost reductions as well as “green objectives” of their own (e.g.: environmental reports to shareholders, regional policies, commitments towards use of specific energy sources). Therefore, in effect, regulatory measures are today driven much more by the communications equipment manufacturers and operators than by national regulators. Industry consortia such as the GSM Association (GSMA) have introduced best practices for energy savings leading later to an International Telecommunication Union (ITU) standard [c23].
This is however bound to change, as some communications regulators plan to introduce mandatory requirements, especially on ISPs and on public wireless base station operators, whereby technology migration set in the licenses, must be linked to a specified power consumption reduction for a given traffic capacity. Likewise, in a number of countries, some communications operators are seeking energy production and distribution licences, to be allowed to own and operate energy production facilities serving not only their own needs, but also third parties. One motivation is to limit the electricity and cooling prices charged to communications operators by power utilities. Another is to capitalize on the preferential amortization rates for selected green energy production facilities. A third motivation is to earn sometimes incentive-led income from selling excess renewable energy to third parties. Finally, some communications operators are in a competitive strategic positioning game with power utilities around smart grid metering and services [c24]. The net effect is that communications operators interact much more with energy regulators, an offer to these a diversification and increased competition amongst market players. 3.1.1.2 Economic Dimensions Traditionally in economic terms, telecommunications was about user-led traffic and service demands, besides manufacturing output (part of the second economic sector) [c25]. The user-led demand as studied in economics did not include content creation, all this being aggregated into utility services, and thus the third sector of the economy (services). Also, in macroeconomics there are no specific metrics for sustainability. As a result the energy consumption driven by communications traffic and services, is still treated as a pure substitution between utility services inside the third sector, and not rendered exogenous. The consequence is that, at a macroeconomic level, there is no incentive or ready means to estimate the cross-effects between communications service value and energy pricing. Another consequence is that the relative returns on investments in communication systems and services, and in energy savings capacity, cannot be assessed. This is bound to evolve, if indeed the knowledge and communications economy will be treated as the fourth sector on its own [c25].
3.1.1.3 Microeconomic and Pricing Measures
The strict definition of rationality is on an individual’s preference: the preference relation is rational if it possesses the properties of completeness and transitivity [c26]. It means the individual is able to compare all the alternatives and the comparisons are consistent. Furthermore, rationality implies that the individual has complete information of all alternatives and knows about the consequences of the choice; the user also has unlimited time and unlimited computational power to pick the most preferred option. In reality, such a perfectly rational user does not exist. Over the past decades, a large mass of empirical data has shown violations of the rationality assumption [c27].
H. Simon [c28] has pointed out that the behaviour of most individuals is partial rational. Much of the time, the individual does not know all the alternatives. Neither does s/he have perfect information regarding the consequences of choosing a particular alternatives both because of limited computational power and because the uncertainty in the external world. The individual’s preferences do not possess the rational prosperities when comparing heterogeneous alternatives. Simon characterized this as “bounded rationality”. Model construction under bounded rationality assumption can take two approaches. First is to retain optimization, but to simplify sufficiently so the optimum is computable. Second is to construct satisfying model that provides decisions good enough, with reasonable computational cost. Neither approach dominates the other [c28].
Following the pioneering work of Simon, Kahneman and Tversky [c29] conducted a series of research on various types of judgement about uncertain events. Their conclusion was that people rely on a limited number of heuristics principles, which reduce the complex tasks of assessing probabilities and predicting values to simpler judgement operations. A recently revisit of this analysis [c30] proposed a formulation in which the reduction of complexity is achieved by an operation of “attribute substitution” whereby a judgment is said to be mediated by a heuristic.
Costs, benefits and incentives linked to the adoption of energy savings in communications networks, represent a typical attribute substitution, and therefore dominantly hinge on microeconomic measures at supplier level as well as at user level. The new framework to be considered here is one where the communications suppliers and users alike, are not just dealing with traffic and services, but are also and at the same time suppliers and users of energy, with trade-offs between their two roles [c31]. Ultimately, as seen above, the communications supplier may also be an energy supplier, and vice-versa, so that at a fundamental level the microeconomic pricing and revenue are on combined “bundles” of communications and electricity with “attribute substitution”.
By a combination of a large number of users, technology improvements, and operator productivity gains, the pure transport and access tariffs for communications have plummeted to low values, whilst energy costs may soon exceed them. Content-based services will generate certain revenue. Thus the very mix inside the combined “bundles” will change, with energy representing a large component, which only energy savings can reduce.
3.1.2 Pricing Theory in Relation to Green Policies
In this section we now review pricing principles, introduce the concept of energy-and-communications use bundles and then “green” tariffs as incentives. 3.1.2.1 Pricing Principles
The economic theory of pricing has traditionally been derived for physical goods, and from different angles:
1. Either as a static equilibrium between supply and demand, including auctions [c32];
2. Or taking in consideration ranked preferences for individual price formation; 3. Or reflecting price dynamics with endogenous fluctuations due to market
restructuring.
Most conventional telecommunication pricing schemes have been variants of the above, assuming limited capacity in either bandwidth or transmission capacity; these two assumptions have been made largely erroneous with the advent first of fibre optic transmission, next of advanced radio coding/modulation/spectrum usage techniques, and finally of IP based networks [c25]. More recently, operators, while largely regulated according to the above principles, have determined prices by summing marketing, customer care, and financial costs, thus blurring the picture for users as well as for themselves. Customer segmentation approaches now dominate the pricing and revenue strategies for communications services. Likewise, most electricity pricing schemes have also been variants of the above, assuming limited energy production/generation capacity, and/or daily variation patterns of demand [c33].
However, at the dawn of telephony services (circa 1880), there were individual tariffs [c34]! For quite some years, and in some markets, telephony served mainly some high-level civil servants and privileged people (trade, news), and was a symbol of wealth and social rank. Telephone subscribers were not designated by a number, but by their name; picking up the phone would get the operator, who would then ring and connect the desired party by a polite support staff protocol. As a luxury service at that time, the demand for telephony was limited as was network capacity. Individual demands were price insensitive, which resulted in an inelastic demand curve as shown in Figure 3.1. The supply was scarce and inelastic to prices, as there was no choice, nor competitive mechanisms: the average price per call was high and anyway the supply stalled because of limited exchange capacity and human operations. Although prices were fixed individually or bundled into packages with fixed numbers of calls, they were extremely high, which resulted in the exclusion of the majority of population from accessing the services due to unaffordability.
Price per call Average price per call Number of voice calls 0 A B C Figure 3.1: Service demands at the dawn of telephony In Figure 3.1 A, B and C represent individual demands, which are limited and price insensitive. The average telephony demand curve at the introduction of telephony is shown as the bold curve, which is inelastic. All voice calls here are assumed for the same destination/distance. From the beginning, although sets of telephone users and suppliers were restricted, charging patterns began to diverge between flat rates and individual usage-based rates. The number of call attempts, the physical destination, and the call duration were all manually recorded. However, the pricing of the calls was a matter between the telephone company sales person and the customer (who was then not a subscriber); usage, rank, fame, location were all taken into account, and the settlement was accomplished by a bank note or cash.
This historical recollection is very relevant nowadays in relation to green policies due to a number of fundamental reasons. First, the operators and their users that care about energy savings are initially minorities, also called “early adopters”, and the price settlement thus can/should be individualized. Next, as explained in Section 3.1.1, the regulatory vacuum regarding green policy implementations leave space for individual negotiations rather than fixed tariff bundles. One simple reason is that a given user may have a low energy profile and a high communications profile, while another might show the reverse, thus impacting the costs, benefits and incentives at an individual level. Likewise, a communications supplier may have from its infrastructure and service offerings, relatively high energy consumption, but access to low utility supplier prices, while another might show the reverse picture. This leads to the concept of “individual tariffs” for a communications and energy consumer [c34].
An “individual tariff” as summarized in Table 3.1 means that each individual sets a tariff for himself/herself for a specific set of communications and energy services provided by a supplier or a community, whether this service is user-defined or community-defined. Even if that individual belongs, say to an enterprise, the members of the enterprise may have different individual tariffs, simply because their service (contributions and receipts) are different. Even, different users of an identical
service (e.g. voice) may value and price it differently as they decide individually to choose another supplier, or belong to different communities. Furthermore, a supplier or community need not own part or the entire transmission infrastructure, sourced competitively from infrastructure owners, especially as this is encouraged by regulators under the “virtual operator” concept. Indeed, this definition omits service provisioning duration, as the duration of the service will be just one attribute in the multi-attribute service demand; e.g. sporadic uses are possible, just as are long term ones, but the difference with today is that service duration becomes user-defined. ! Consider one Buyer (B) and N Sellers (S(i), i=1,..,N). The Buyer signals his maximum price p and contract duration T ! Buyer signals his service mix and attributes Mix= (A(j),q(j),j=1,..,M) where “A” denotes a service and “q” the quantity or QoS ! One or several Sellers respond ! There is an individual tariff, whenever B and one Seller S(*) agree by contract on the provisioning by S(*) to B of the service Mix for duration T at price equal or lower to p ! This contract may be different from the contract for the same service mix for other buyers or sellers respectively. Table 3.1: Individual Communications and Energy Bundle Tariff Mechanism
3.1.2.2 Mass Customized Communication and Energy-use Bundles
A pertinent question is “how do early adopters evolve over time?” Twenty years from now combined advanced communication technologies and smart grid technologies will probably enable people to stay connected anytime, anywhere with access and energy network alternatives. Users will seamlessly roam between networks using yet unknown new services, and behave as joint producers and consumers of communications and energy. 100% penetration of access devices over the entire population in most countries will render work more flexible, and individualization of labour, will produce a highly segmented social structure [c35].
The total demand will be large, as people can personalize their communications and energy services according to their needs. Furthermore, community proliferation may multiply the effect. However, due to the highly segmented structure, most traditional flat rate tariffs will either not be transparent and appealing enough to users, or if they are made too diverse, users will “churn” (change suppliers) implying high switching costs. These effects will allow flat rates for all to be replaced by mass customized individual tariffs, provided each user and community has suitable management and monitoring tools for both communications and energy use, allowing in real-time (as well as over contract durations) to quantify equilibrium break-even tariffs [c36]. This results in price insensitive individual demands. Although for each specific service, the preference from each user will be different, the average demand across many users again leads to an inelastic price demand
curve as illustrated in Figure 3.2. Consequently, we appear to repeat history (see Figure 3.1). However, on closer inspection the new demand curve is more to the right in terms of the “number of service requests” and much lower in terms of price. Price of a specific service “S” Average price per service request of “S” Service requests A B C Figure 3.2: Service Demand for a Mass-customized Individual Service Bundle “S”
In Figure 3.2, the mass-customized individual service bundle “S” comprises communications and energy. A, B and C represent individual A’s service profile: (S, A1, A2, etc.), individual B’s service profile: (S, B1, B2, etc.) and individual C’s service profile: (S, C1, C2, etc.). The average demand for service “S” is shown by the bold curve. Note there is a “service proliferation effect” driving the curve slope.
Already today technical means exist to achieve individual tariffs, and the infrastructure industry together with the billing platform industries, have shown that complexity and costs involved in individual user multi-service and multiple access demand monitoring and control are surmountable. In the future, traffic and service aggregation, and filtering coupled with service creation platforms will allow this to be more capable and cheaper both for communications and smart-grid energy services. Although technical details of the eventual implementation are not standardized yet, we can identify possible architectural elements of such a solution using standards [c36], as follows:
! The linking of user communications and energy service profiles to the adaptation functionality in the billing/rating system, would be carried out at user authentication time in the AAA server; ! In access networks, via the energy grid meters, routers could recognize and tag special packets, and process them according to a given code; within this tag may reside a label representing the individual tariff and which would be tied to the access node at which such tariffs are applied; ! The flow label in the IPv6 protocol used to carry QoS features, could encode individual tariff information for this packet. This approach offers the advantage that the packet to which this individual tariff code applies does not have to originate in some service node, but only in those who have the decoding key to this field.
! Using the SIP protocol, a P-Charging-Vector header is defined to convey charging related information. The information inside the vector can be prepared and retrieved by multiple network entities during the establishment of a dialogue or standalone transaction. In this way, charging related processing can be session-based.
3.1.2.3 Green Tariffs as Incentives
We define here a “green tariff” [c31], as the contractual price paid by a subscriber to an operator for a set of bundled communications and energy services at a given quality of service for a specified duration; this price must reflect both parties’ best efforts to reduce CO2 emissions, and pass onto the subscriber a share of the energy and emissions savings from the network. The operator can easily offer “green tariffs” by having a green tariff subscriber base segment, which, against committing to contract for such bundles, allows the operator to earmark a specified percentage of their energy consumption at a network level to technologies with fewer emissions and possibly to the use of renewable energy supplies.
Furthermore, if such green tariffs are made individual (see Section 3.1.2), they provide an incentive for users to specify and adopt a communications and energy service demand profile leading to less waste or unutilized capacity. As this incentive has monetary consequences, there is a strong likelihood that individualized green tariffs would become very important. Their deployment however rests on achieving equilibrium (called a sustainable individual green tariff) between users requesting individual green tariffs, and the operators’ economic sustainability, as they have to make new investments in communications technology and/or renewable power sources they control. Using a real operator model, it has been shown [c36], that by applying recursive Stackelberg equilibrium computations to multi-attribute individual tariff contracts covering individualized services, the communications operator could still achieve economic sustainability. This is on a mass-customized basis, and applies even for complex services and extreme cases. In addition, the analysis shows that operator profits are not eroded for generic communications services; however, for value-added communications services, the situation is less clear as investment is also required in content, storage and competence.
3.1.3 COST Action Results
Research carried out during the COST Action IC0804 focussed on the green tariffs and individual communications-and-energy bundles, including wireless access [c37][c38]. The operator was assumed to have an energy production and distribution license with alternative renewable energy sources (wind, solar), where excess supply got sold. The main result is to confirm the possible tariff reduction to the user, while maintaining operator’s profit margin; the difference between the individual green tariff and the public tariff (for the same service bundle), which is an indicator of the net incentive to the user, is in the order 10-20 % [c25]. Other results on specific
aspects of the same issue are reported in [c37], [c38]. Nevertheless, the overriding issue is the right-sizing of the mutual dependence, and possible combination, of communications operators, electric power utilities, and their customers. Despite now proven advantages in terms of energy savings from individualized end user pricing [c39], through the co-creation of value with customers, there remain regulatory challenges [c40-c42].
3.2 Network Components
This section draws upon existing publications and research findings to assess the current and near-future expected energy characteristics of key wired networking components. It also considers how this profile might change as the Internet continues to develop over the next few years based on the various services it supports. 3.2.1 Router A router is a device that selectively forwards packets between computer networks. Routers operate at the Network Layer (Layer-3) of the OSI model. In relation to data, they inspect the headers of data packets they receive on their ingress ports and selectively route them through to a suitable egress port with reference to a routing table.
Router architecture has developed for several generations: from bus-based router architectures with a single processor, through bus-based router architectures with multiple processors and switch-based router architectures with multiple processors, to switch-based router architectures with fully distributed processors [c43][c44]. However, a router remains primarily composed of line-cards, switch fabric, a management system and a Router Processor, often located within the same Line-Card Chassis (LCC) [c45].
The line-card is responsible for processing and forwarding packets using its local processing subsystem and buffer spaces for processing the packets arriving along the ingress interfaces (or ports) and awaiting transmission at the egress interfaces. The switch fabric provides the sufficient bandwidth for transferring packets among different line-cards. It receives data from the ingress line-card interfaces and switches to appropriate egress one(s). The Router Processor is responsible for maintaining the overall forwarding table and distributing different parts of the table to different line-cards. The management system includes functionality for cooling, power control and alarm handling.
A more powerful router is a multiple-shelf device, which has a similar functional structure to the single shelf router. The principle difference is that it has several LCCs and that are connected with one or more Fabric-Card Chassis (FCC) elements [c46]. For example, the Cisco CRS-1 multi-shelf routing system typically has 72 LCCs
connected via 8 FCCs [c47]. There are both fabric switches on the FCC and LCC. Generally, the fabric switch employs three-stage switching devices, known as Switch Fabric Elements (SFEs). They are all identical and their operation and behaviour are determined by their location. In a single shelf router, the SFEs are all in the same fabric switch. In the multi-self routing system, the difference is that the switch fabric on the FCC only supports stage-2 switching functionality whilst the switch fabric on the LCC is responsible for stage-1 and 3 switch functionalities.
The data-plane, also called the forwarding plane, is the part of router architecture that is responsible for deciding how to handle the ingress packets by looking up the routing table and then sending them to the appropriate the egress interfaces. On the other hand, the control-plane is used for routing related control functions, such as generating the network map, the way to treat packets according to the different service classifications and discarding certain packets. In general, the data-plane runs on the line-cards and the control-plane operates on the CPU and main memory. Another important part of the framework is the dynamic interface binding function, which allows different interface resources to be allocated the according to requirements.
Energy efficient networking means that we aim to transport the same amount of traffic (in bits) with lower energy consumption (in Joules) than is currently the case. From the aspect of power consumption, both the node and line equipment should be considered. However, in practice, the consumption of the line equipment is typically omitted [c48]. Wave Division Multiplex (WDM) links account for between 1.2% and 5.8% of the Internet’s power consumption, varying with the average access rate [c1]. Therefore, the power consumption of the router tends to receive most attention.
The energy consumption of a router is made up of two parts: static and dynamic energy. Static energy is consumed by the Line-Card Chassis (LCC) and dynamic energy is consumed by the line-cards and is related to the traffic load. For example, in [c49], the power consumption of two standard router platforms has been tested with different combinations of line-cards and LCCs. The experimental results show that the LCC consumes more than half of the maximum observed power consumption for any combination. From this experiment, we can conclude that switching off the whole router can save more energy than only switching off the line-cards since the consumption of the base system is the major contributor to the overall energy consumption.
As monitoring and performing “green” experiments on a wide network is generally unfeasible, some simulation frameworks such as ECofen have been proposed [c50]. Such frameworks allow the simulation of large-scale networks and the impact in terms of energy consumption and quality of service from on/off or slowdown (Adaptive Link Rate, Low Power Idle) power saving schemes. Nevertheless, hardware experiments have been made on a French regional platform called GridMip
composed of 3 backbone routers, 3 border routers and 150 nodes. The platform is illustrated in Figure 3.3. Figure 3.3: GridMip Evaluation Platform The aim of the experiments was to evaluate precisely what is the consumption of the network equipment during the boot process and how long it takes. This is particularly relevant when considering approaches that aim to switch off routers in order to save energy during “light” operational conditions as it is necessary to take into account penalty when switching the routers back on again. With a PLOGG wattmeter the power consumption of a Cisco 7600 Border Router (R2) composed of 3 modules was measured during the boot process as shown in Figure 3.4. This router consumes 785 watts. It takes 400 seconds to switch on a router. From the figure it is clear to see that the energy consumption is neither constant nor linear during the boot process. Instead we observe appreciable steps in the energy consumption. This has implications for the accurate modelling of dynamic energy saving network systems. It also shows that using typical contemporary equipment there is an appreciable delay before a router can again become operational once it is powered down.
Figure 3.4: Power Consumption of a Cisco 7600 Border Router during the Boot Process
A further experiment examined the power consumption of a router module. For this, a 4 x 10Gbps module belonging to router R2 was turned off. It was then turned back on 20s later. When a module is off it consumes 195 watts less. When the module is switched on, there are two phases during the boot process: one from 40s to 80s which consumes 100 watts more and a second phase which consumes 100 Watts more again as shown in Figure 3.5.
Figure 3.5: Cisco 7600 Border Router 4 x 10Gbps Interface Module: Powering Down and Up after 20sec
We notice that the powering down of a module is achieved in one step almost immediately. One might also assume that powering up the module would also take one step. However, a module recovers in two phases, with the core module initialising ahead of switching on the ports. The powering on process lasts almost 50s.
Finally the power consumption associated with connected Ethernet ports was examined as shown in Figure 3.6. For this experiment, 18 computers were plugged into the Ethernet module of the router. The right axis represents the number of unplugged interfaces (called Nb Itf in the graph). The main objective of this experiment was to observe the energy consumption with as the number of connected (plugged) Ethernet ports was altered.
Figure 3.6: Cisco 7600 Border Router Power: Physically Plugging Ethernet Ports
We see from this experiment that the mean power consumption of a port is 0.94 Watts and is approximately linear with the number of connected ports.
Experiments such as these are a necessary precursor to the creation of accurate mathematical models such as work exploring energy-performance trade-off in the context of network and data-centre optimization [c51].
3.2.2 Network Interface Card
The role of a Network Interface Card has already been introduced in the preceding section where it was referred to as a line-card, forming part of the router architecture. However, this functionality actually exists within any device attached to a network. In a “local area” access network it is more common to use the term Network Interface Card (NIC).
In wired networks, research like [c52][c53] show that energy consumption of network devices such as NICs / line cards can be lower if operating rates are reduced. This is due to the fact that devices operating at a lower frequency can reduce their energy consumption by mechanisms such as Dynamic Voltage Scaling (DVS) [c54][c55]. By lowering the clock rate of synchronous logic, operation can be maintained at a lower power supply voltage. However, this lowers the switching performance of devices and so must coincide with situations when the processing load is lighter. The authors of [c52] try to find a decision area for which hardware-based technique (Sleeping or Rate Adaptation) can capitalize on operational conditions. To this end, they study the trade-off between links rates and their energy consumption. A uniform (linear energy function) and an exponential (10 Gbps, 1 Gbps, 100 Mbps, 10 Mbps) distribution of rates are used. The latter approach is considered as hardware
technologies for these rates already exist (Ethernet technology). We can extract from their results that the uniform distribution of rates is the most suitable one to achieve a greater reduction of links operations rates and, consequently, a reduction of energy consumption. Moreover, they state that both Sleeping and Rate Adaptation are two effective techniques depending on the energetic profile of networking equipment and network utilization.
One step further, in [c56] it is presented a study based on [c52] in which they compare energy savings in wired networks after applying Sleeping and Rate Adaptation techniques. In this case, they draw some conclusions according to network devices individual baseline consumption, i.e. based only in the amount of energy consumed by a component regardless of its operation rate. For the case in which the baseline consumption of network components is relatively high, it is interesting to keep as few active links as possible (Sleeping). On the other hand, if the baseline consumption of network devices is low, Rate Adaptation technique is more suitable. In the latter case, authors rely on results from [c52]. Thus, they assume and use a uniform distribution of rates for their experiments as well.
Otherwise, authors in [c57] perform several experiments to measure energy consumption of two different Cisco routers: GSR 12008 and 7507. Both of them include their base systems (chassis plus router processor) and line cards. However, we can extract from the results obtained in this case that the energy function described by line cards consumption takes discrete values and assume its adaptation to a logarithmic distribution of rates.
Rodgers, in turn, uses an Intel 82579 Gigabit Ethernet PHY and obtains energy consumption values for 100 Mbps and 1 Gbps links [c53]. In this case, several measurements are performed for each of the three different energy levels at which links can be configured: Active, Idle and LPI (Low Power Idle from IEEE 802.3az standard). We can extract from these results the value of links consumption when there is no traffic flowing through them (LPI energy level) as a function of their consumption when they are active. Thus, it can be assumed that the energy consumption of a link with a LPI energy level or Sleeping takes values between 5-10% out of its consumption if it is configured with an active energy level. Furthermore, some heuristics are commonly examined, as in [c58], with the aim of achieving significant energy savings in the network by progressively switching off both nodes and links after the prior aggregation of traffic flows. Other works indeed solve the problem using Integer Problem Formulation (ILP) by considering that only links [c59] or both links and nodes [c60] can be switched off.
3.2.3 (Reconfigurable) Optical Add-Drop Multiplexer
The ROADM is a known as an “any to any” component, which means that it provides a flexible way of adding, dropping or switching any wavelength to any node [c61].
When multiple wavelengths arrive at an input interface of an ROADM, one or more wavelengths can be dropped by pre-selection and in the output interface; one or more pre-selected wavelengths are added. What is more, any wavelength can bypass the electronic processing function and pass through the ROADM unhindered to specific ports. Since these signals remain in the optical domain, there is little latency. Furthermore, due to its “any to any” feature, ROADM technology allows DWDM-based networks to be technology agnostic and thus more flexible [c62].
Little work has focused on energy saving within ROADMs, perhaps because they traditionally consume less power than routers. However, a recent example given in [c63] looks at using ROADMS more efficiently.
3.2.4 Digital Subscriber Line Access Multiplexer
A digital subscriber line access multiplexer (DSLAM) is a network device, often located in the telephone exchanges of the telecommunications operators. It connects multiple customer digital subscriber line (DSL) interfaces to a high-speed digital communications channel using multiplexing techniques. The DSLAM equipment collects the data from its many modem ports and aggregates their voice and data traffic into one complex composite "signal" via multiplexing. The aggregated traffic is then directed to a Service Provider backbone switch (Broadband Remote Access Server (BRAS) at up to 10 Gbit/s data rates. Depending on its device architecture and setup, a DSLAM aggregates the DSL lines over its Asynchronous Transfer Mode (ATM), frame relay, and/or Internet Protocol network (i.e., an IP-DSLAM using PTM-TC [Packet Transfer Mode - Transmission Convergence]) protocol(s) stack. The DSLAM acts like a switch since its functionality is at Layer 2 of the OSI model. Therefore it cannot re-route traffic between multiple IP networks, only between BRAS devices and end-user connection points. From the BRAS the DSLAM traffic is then routed across the ISP network to the Internet. DSL equipment can be a significant source of energy consumption for wired network operators. One possible approach to decreasing the overall energy consumption is to replace large centralized DSLAMs located at the exchanges with smaller remote units closer to customers. This not only reduces energy consumption but also increases the reach of the access network [c64].
3.3 Architectures
This section focuses on the architecture of communication networks and the corresponding relationship with energy usage. However, a key dilemma when examining networks, and particularly the Internet, end-to-end is who pays for the electricity and the potential savings exist.
At the periphery of the Internet sit the end users, be they residential customers or businesses. In both instances the Customer Premises Equipment (CPE) is typically powered by an electrical source provided by the end users, for which they pay. Conversely the access networks are typically operated by Internet Service Providers using their own equipment. These networks in turn are connected to carrier networks, maintained by other tier-2 and tier-1 operators that primarily convey the information over large geographical distances using high performance (and power “hungry”) equipment. The Internet is thus a federation of networks with a plethora of providers and consumers. Interestingly given the hierarchical “pyramidal” structure of the Internet, the number of networking devices at each tier increases by one or more orders of magnitude as we descend from the tier-1 operators at the tip of the pyramid. This means that the greatest potential energy saving by volume exists at the CPE, where small percentage reductions in energy consumption can amount to substantial savings at a national level due to the vast number of devices involved. Paradoxically this arrangement leads to two issues when it comes to saving energy. Firstly, the amount of energy saved at a particular CPE may be regarded by the owner / end-user as marginal. Secondly, as the electricity to power these devices is paid for by the end-users there is less incentive to motivate the access and carrier network operators to change their behaviour. Despite this, we argue that embracing energy saving mechanisms detailed in Section 3.5 can still impact on operational expenditure to a degree worthy of consideration. 3.3.1 Access Networks
An access network is that part of a telecommunications network which connects subscribers to their immediate service provider. Traditionally, access networks consist largely of pairs of copper wires, each traveling in a direct path typically between a Digital Subscriber Line Access Multiplexer (DSLAM) and the customer. The DSLAM connects multiple customer digital subscriber line (DSL) interfaces to a high-speed digital communications channel in the exchange, which provides an access point to the rest of the Internet. Recently, access networks have evolved to include more optical fibre primarily due to its high bandwidth, low loss and noise immunity characteristics. Optical fibre already makes up the majority of core networks and has started to “roll out” closer to the customer, until a full transition to fibre is achieved, in order to deliver value added services over Fibre to the Home (FTTH). One group of optical fibre technologies are Passive Optical Networks (PONs), whereby point-to-multipoint fiber links multiple homes to a common Optical Line Terminal (OLT) at the service provider's exchange, using unpowered optical splitters to create a tree-like structure. Indeed Energy Efficient Ethernet Passive Optical Networks (EPONs) are now being deployed, providing cost efficiency and high data rate for the last mile access [c65]. A typical
EPON is a Point-to-Multipoint (PMP) network with a tree-based topology, where an OLT connects multiple Optical Network Units (ONUs) via optical links. The OLT plays a role of distributor, arbitrator and aggregator of traffic. In the upstream direction (from ONUs to the OLT), multiple ONUs share a single link and traffic may collide. The OLT distributes the fibre capacity using an upstream bandwidth arbitration mechanism to avoid collisions. In the downstream direction (from the OLT to ONUs), data frames are broadcasted to all ONUs. ONUs filter and accept data that are addressed to them. However, ONUs have to constantly listen and examine downstream traffic, which results in wasting significant energy in the ONU.
3.3.2 Carrier Networks
Generally, the underlying transport technology (Layer 1) of the current Internet uses Synchronous Optical NETworking (SONET) or Synchronous Digital Hierarchy (SDH); both architectures transport voice and data in containers in an efficient time-division multiplexed manner over optical fibre. SONET/ SDH provide advanced support services such as line monitoring to provide signals for protection switching and so forth. SONET/ SDH also allow Time division Multiplexing (TDM) circuits to be multiplexed from low-speed to high speed into different sized containers. However, with increasing requirements for service flexibility and reliability and the demand for lower expenditure, Internet Service Providers (ISPs) are not satisfied with this “traditional” architecture and are looking for more efficient ways to handle the growing volume of IP traffic. One promising architecture for the Next Generation Network (NGN) is IP over DWDM since it eliminates the legacy SDH transport layer and so saves equipment costs and reduces energy consumption.
An IP over DWDM network is composed of two layers: the IP-layer and an optical layer. This can be abstracted as a structure whereby a node is composed by a set of network equipment, e.g. a router and an optical transport switch, typically in the form of a Reconfiguration Optical Add-Drop Multiplexer (ROADM), that are then inter-connected by an Optical Line System (OLS), which includes optical fibre and amplifiers. In this model, the wavelength continuity constraint is often considered, whereby when an optical connection passes through the optical transport switch, it is required to be on the same wavelength channel from the ingress to the egress. The channel remains in the optical domain and Optical-Electrical-Optical (OEO) conversion is avoided. The node in an IP over DWDM architecture is composed of a router and an ROADM, which connected to similar devices via a transmission line system. The router is responsible for storing and forwarding packets and the ROADM is used to remotely switch the traffic allowing for adding, dropping or bypassing the router at the wavelength level without OEO conversion. An example is the Cisco IPoDWDM solution where network nodes are composed of a Cisco CRS-1 multi-self routing system and an ROADM [c66]. The original transponders have been combined into the
routing system. The ROADM only manages add, drop and bypass in the optical domain.
3.3.3 Grid Overlay Networks
Grid computing via overlay networks enables a federation of computer resources from multiple administrative domains to coordinate to achieve a common goal. Grids are a form of distributed computing whereby a “super virtual computer” is composed of many networked loosely coupled computers acting together to perform large tasks. For certain applications, “distributed” or “grid” computing, can be seen as a special type of parallel computing that relies on complete computers (with onboard CPUs, storage, power supplies, network interfaces, etc.) connected to a network (private, public or the Internet) by a conventional network interface, such as Ethernet.
An analysis of the usage of an experimental grid has been conducted over a one-year period. Based on this analysis, [c67] propose a resource reservation infrastructure that takes into account the energy usage. The infrastructure is validated on a large-scale experimental “Grid5000” platform and the gains in terms of energy are presented.
3.4 Traffic Considerations
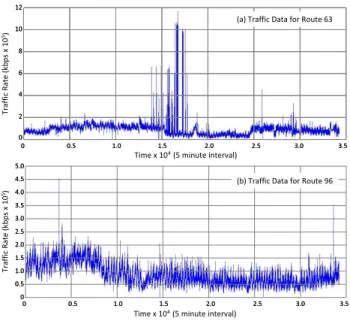
There is little published data concerning the traffic characteristics of commercial networks as it is regarded as sensitive. However, some published datasets exist for the Abilene and Géant networks [c68][c69]. Figure 3.7 provides just two examples of traffic flow between specific source-destination pairs in the case of the Abilene network. The traffic was sampled every 5 minutes for 24 weeks, omitting weekends. As seen from the figure, traffic varies considerably over time. It is this variation that permits network resources to be switched off when they are not needed.
Time x 104 (5 minute interval) Tr aff ic Rate (k bp s x 10 5) Time x 104 (5 minute interval) Tr aff ic Rate (k bp s x 10 5) (b) Traffic Data for Route 96 (a) Traffic Data for Route 63 0 0.5 1.0 1.5 2.0 2.5 3.0 3.5 0 0.5 1.0 1.5 2.0 2.5 3.0 3.5 0 0.5 1.0 1.5 2.0 2.5 3.0 3.5 0 0.5 1.0 1.5 2.0 2.5 3.0 3.5 0 2 4 6 8 10 12 0 2 4 6 8 10 12 0 0.5 1.0 1.5 2.0 2.5 3.0 3.5 4.0 4.5 5.0 0 0.5 1.0 1.5 2.0 2.5 3.0 3.5 4.0 4.5 5.0 Figure 3.7: Typical Traffic Data over 24 Weeks
The variation in traffic over time allows for opportunities when resources can be placed into a sleeping state. Furthermore, the regularity in the autocorrelation pattern lends weight to the idea that the flow of data between given source-destination pairs is temporally predictable [c70].
In addition to load variations, traffic can also be differentiated in terms of where it is coming from and going to. For example, within the context of IP over DWDM architectures, there are two types of traffic in every network node: router-terminated traffic and optical bypass traffic [c71][c72]. In the former case the traffic is terminated at the router. The router looks up the routing table at IP-layer to decide where to forward the packet. In this scenario, since the packet may be transported in the physical fibre using a different wavelength, the traffic needs an optical to electrical conversion before it processed and forwarded by the router. In fact, the power consumption of optical and electrical transfer in the IP router ports is a major element of the overall power consumption. Therefore, some researchers are considering designing an energy-efficiency network by minimizing IP router ports. For optical bypass traffic, in contrast, the router does not process the traffic. Instead it is transported directly through the intermediate router(s) via pre-set light paths. Since the traffic across the core network is becoming more distributed due to changes in application service deployment, the proportion of bypass traffic is increasing [c73]. For example, it is possible that up to 70% to 80% [c66] traffic passing through an optical node is of the bypass type and does not require termination at the router.
3.5 Energy Saving Mechanisms
Energy saving in wired networks can be generally divided into static and dynamic mechanisms [c4]. Static ones consider network design and configuration in respect to power. The approaches are to design and place network resources in a more
energy-efficiency way. In contrast, dynamic approaches attempt to make better use of the existing network resources by traffic engineering in response to varying traffic load through infrastructure sleeping, rate adaptation and so forth. The following section summarises the state-of-the-art in these two areas. 3.5.1 Static Mechanisms Static mechanisms mean to design and configure the network from the perspective of power consumption. That is to say, to plan power-aware networks. One approach is to configure the combination of chassis and line cards for lowing the overall power consumption. In [c49], the author indicates that the base system (including chassis, switch fabric and router processor) consumes more than half of the whole power consumption of a router by testing two generic router platforms. Therefore, one method to achieve power-aware networking at the design stage is to minimize the chassis number and to maximize the number of line cards per chassis. Another method is planning the network is to reduce the traffic processed by the IP routers. Generally, a packet is transported via 14 routers on average across the networks [c66]. There are two means of transporting packets in the optical layer, lightpath non-bypass and bypass. The non-[c66]. There are two means of transporting packets in the optical layer, lightpath non-bypass lightpath is always terminated at the IP router ports and then transformed into an electrical signal for processing. In contrast the lightpath bypass approach transports packets through intermediate nodes directly without optical-electrical-optical conversion. Reducing the traffic processed by the IP routers means that the use of bypass lightpaths also minimizes O-E-O conversions. [c71] indicates the power consumption of these two different methods, router-terminated and bypass traffic, for packet transportation. In the former case, it consumes about 10nJ/bit. Conversely the traffic processed in the WDM layer, consumes less than 1nJ/bit. Thus, much research has been devoted to exploiting this characteristic.
In [c12], the IP over WDM network achieves energy efficiency by minimizing the number of IP router ports/interfaces since the ports/ interfaces play an important role in the power consumption of networks. It is also the first time that the lightpath bypass approach is taken into consideration for energy saving. The energy-minimized network design uses the lightpath bypass approach to minimize the number of IP router port for reducing the power consumption via O-E-O conversions. In [c13], the paper considers the multi-shelf routing system in an IP over WDM network for saving the energy. Both papers employ Mixed-Integer Linear Programming (MILP) to build a model for minimizing the power consumption.
Another approach is energy-efficient network design. Here the aim is to devise energy-efficient architectures during the network design state. For example, researchers have proposed an energy-aware design to minimize the energy consumption of all the network components in conjunction for an IP-over-WDM network [c13]. Two alternatives were considered: lightpath non-bypass and lightpath bypass. In the former case, IP routers process and forward all the data carried by the
lightpaths, whilst the latter allows IP traffic to directly bypass an intermediate router (which is not the destination node) via a cut-through lightpath. Results showed that lightpath bypass could save significant energy compared with the non-bypass case (between 25% to 45%) due to the reduction of the number of IP routers needed. They also confirm that the total energy consumption of IP routers is much greater than that of the rest of optical network equipment, such as Erbium-Doped Fiber Amplifiers (EDFAs) and transponders, accounting for over 90% of the total network power consumption.
3.5.2 Dynamic Mechanisms
Dynamic mechanisms use traffic-engineering methods to make better use of existing resources instead of designing and configuring a network in respect of the power consumption. They react "quickly" to changing conditions such as variations in traffic load. Methods that belong to this class are rate adaptation, infrastructure sleeping and green routing. We also consider virtualisation.
3.5.2.1 Rate Adaptation
Rate adaptation is a mechanism by which a communications device can adjust its processing rate based on the current workload conditions. Many devices have the capacity to operate at a range of processing rates. When the workload is low, a device operates at the low speed, which consumes less power at the same time. Therefore, when the traffic load is low, lowering the transmission speed of device reduces its power consumption. Rate adaptation is described in [c15] where it is compared with the infrastructure sleeping. The conclusion is that the both approaches are useful depending on the hardware capabilities of device and network utilization. For example, an ISP could use rate adaptation in the daytime and infrastructure sleeping at night to satisfy the different traffic load requirements. Nevertheless, the ability to perform sleeping and rate adaptation are not supported in existing network devices. Even so, these approaches have been incorporated into the future Ethernet protocol standard as: Energy Efficient Ethernet, which was approved in October 2010 [c74]. Thus, we should see these approaches receive broad adoption throughout the Internet over the coming years. A key issue is that current equipment is constrained by technology limitations. Some researchers have explored the trade-off between the amount of energy that could be saved in wired networks and the discrete number of operational rate modes to be implemented in line cards [c75]. Results show that it is not necessary to manufacture line cards that support a large number of different operational rate modes, but that a limited number such as four different operational rate modes would be enough to achieve significant reductions in energy consumption. For example, four energy levels are enough to save significant amounts of energy (around 22%). A greater number of energy levels do not result in large savings when compared to the case when an infinite number of energy levels are assumed.
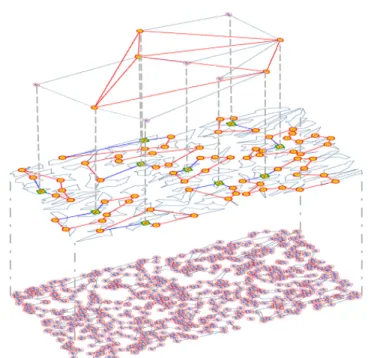
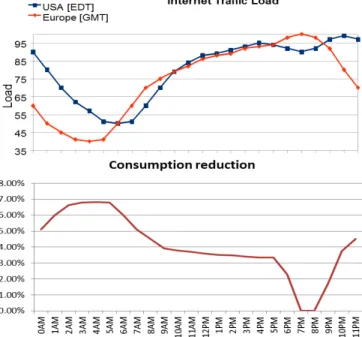
Other researchers have also considered the concept of multi-rate adaptation whereby physical interfaces adapt their rates accordingly with the typical Ethernet values. For example, a 10Gbps card is considered capable of intermediate transmission speeds of 1Gbps, 100Mbps, 10Mbps. Consumption of these intermediate rates are then considered, accordingly [c76]. The use of "adaptive” link rates can then be applied in concert with "energy aware routing" and "multilayer traffic engineering" as described in [c77][c78], respectively. The application of adaptive multi-rate techniques and multilayer traffic engineering in hourly intervals can reduce total consumption into a wired backbone to 7% simply by adapting the capabilities of existing systems to the real needs of traffic. This result is obtained from [c79] using a theoretical scenario formed of a wired backbone network deployed over five cross connection levels (3 aggregation and 2 core) as illustrated in Figure 3.8. It included a physical coverage 40000km2 (equivalent to the size of Switzerland) and a total volume of 6.3 million connected devices, distributed according to the typical characteristics of urban, suburban, and rural areas. Figure 3.8: Example Multilayer Backbone Network The deployed network, based on OTN technology, includes 2000 cabinets with nearly 4000 communications interface cards. Total consumption of 53 MWatts (per hour) was estimated without considering additional cooling systems. The adaptation of the routing and capacity of the links reduces consumption to nearly 2.5 MWatts on average, with peaks of up to 4MWatts. Given the 1:1 ratio in terms of refrigeration equipment energy consumption, a decrease in networking energy consumption would see a similar reduction in the consumption of these ancillary systems. However, as indicated in [c80], a reduction of 1 watt in the system could reduce the
actual overall consumption by 2.42 watts, so the total saving could be as much as 5 % on average, with peaks close to 8% as shown in Figure 3.9. Figure 3.9: Typical Averaged Internet Traffic Load and Consumption Reduction (using EE Techniques) 3.5.2.2 Infrastructure Sleeping
Infrastructure sleeping means that when equipment is idle, it enters a low power consumption state called standby/sleep whilst retaining the information for maintaining its operational state when it again wakes up. An example is the “hibernation” state of personal computers.
Since a router still consumes about 90% of its full-load energy when it is idle [c81], approaches that turn off unneeded devices or permit equipment to enter a coordinated sleep state have more potential for saving energy in a network. Furthermore, due to the well-known daily traffic variations, where load varies in an almost sinusoid manner over the course of each day in response to people’s daily activities, the infrastructure sleeping approach can achieve a significant savings. Consequently, considerable research has been devoted to the infrastructure sleeping principle.
In [c11], two types of sleeping are identified, uncoordinated sleeping and coordinated sleeping. The former lets the equipment enter a sleep state based on local information, e.g. during the inter-arrival time between packet transmissions. The other takes a global perspective and reroutes traffic via some equipment in order to let other devices enter a sleep state. For example, in [c16], the author discusses two mechanisms for sleeping: traditional “wake-on-arrival” and a proposed “buffer-and-burst”. The former one wakes up the sleeping device when the new packet arrives.
Since it takes time for a device to return to the active state, if the packet inter-arrival time is smaller than the transition time, the energy saving is limited. For “buffer-and-burst” sleeping the traffic is shaped into burst-by-burst units and stored in a buffer that is processed when buffer is full. This provides longer sleeping periods while the traffic load is low. The results show that the proposed mechanism can obtain significant energy savings whilst having little impact on the packet loss and delay. A similar approach to buffering or (re)scheduling bursts to improve opportunities to shutdown (sleep)in the context of grids[c82] and networks [c83][c84] have also been considered.
In [c85], L Chiaraviglio et al. modelled a network for maximizing the energy saving by switching off idle nodes and idle links. The problem is NP-hard, so in [c15] several simple heuristic algorithms are employed which sort all the nodes depending on the number of links, the amount of flows they accommodate, or using a random strategy to switch off for saving energy. In the simple network scenario, which includes the core, edge and aggregate networks, it is possible to switch off 30% of links and 50% of nodes. The same author extends their work considering a real-world case in [c60]. The problem for minimizing the number of nodes and links for saving energy given a certain traffic demand has been solved by Integer Linear Programming (ILP) for simple networks. The algorithm switches off devices that consume more power in descending order. The results show that it is possible to reduce energy consumption by more than 23%, i.e. 3GWh/year in a real network scenario. In a further example [c86], the author took the Italian telecommunications network as reference architecture and evaluated the extent of energy saving if green network technologies were adopted, such as power scaling and standby exploitation. It assumed the network equipment, such as routers, home gateways and Digital Subscriber Line Access Multiplexers (DSLAMs) have three power consumption states: the full load, idle and standby after making use of green technologies. The power consumption of full load state and the idle state varies linearly according to the actual traffic load. The power consumption of the standby state is a small fraction of the idle state power. The conclusion of using different green technologies within the reference scenario is that their adoption may save up to 68% power consumed relative to the current approach.
However, these approaches all suffer from the problem that when a router or a link is switched off in a network, they lose the present state of the network and so will trigger routing protocol reconvergence events. The traffic is re-routed along longer paths that may be not acceptable due to congestion, quality of service and the extra delay. Therefore, when making use of the infrastructure sleeping, network connectivity and Quality of Service (QoS) must be considered to guarantee the reliability of the network.
Recently, there has been a new direction in infrastructure sleeping: to switch off the line-card instead of the whole router. Since the disappearance of whole router may trigger reconvergence events and may thus lead to network disruption and