Adaptation-induced plasticity and spike-waveforms in cat visual
cortex
Lyes Bachatene ª, Vishal Bharmauria ª, Jean Rouat b and Stéphane Molotchnikoff ª Address: ªDepartment of Biological Sciences, University of Montreal, QC, Canada
bDepartment of Electrical and Computer Engineering, University of Sherbrooke, QC, Canada
Correspondence to Stéphane Molotchnikoff, Professor, Department of Biological Sciences, University of Montreal, QC, Canada
Tel: +1 514 343 6111 ext: 6616
E-mail: [email protected] Abstract
Orientation-selective neurons shift their preferred orientation after being adapted to a non-preferred orientation. These shifts of the peaks of tuning curves may be in the attractive or repulsive direction in relation to the adapter orientation. In anaesthetized cats we recorded evoked electrical responses from the visual cortex in a conventional fashion. The recorded spikes in cortex may present two typical waveforms: regular spikes or fast spikes. However, there is no evidence whether the shapes of spikes are related to the attractive or repulsive shifts of orientation tuning curves of cells. Our results show that after adaptation the recorded cells with both attractive and repulsive shifts display one or the other shape of spike. However, the magnitude of shifts is systematically higher for regular spikes, which is attributed to putative pyramidal cells, while tuning curves for fast spikes have smaller magnitudes and are evoked by putative interneurons.
Key words: adaptation, neurophysiology, interneuron, pyramidal cells, regular spikes, fast spikes, visual cortex
Introduction
Neurons in the mammalian visual cortex are tuned to respond to visual stimuli such as contour orientation, motion direction, and speed [1-3].In previous studies it has been shown that it is possible to modify the preferred stimulus which optimally excites neurons by applying a non-preferred adaptation stimulus [4, 5] in adult visual cortex. Adaptation studies in recent years have presented a more complex picture where prolonged exposure to a non-preferred orientation has
shown modifications s [4, 6, 7
min) were shown to induce attractive shifts more frequently than repulsive shifts [6, 8, 9], but repeated or prolonged exposure to an adapter is also known to reduce neuronal responsiveness to that same stimulus, especially if it is the neuron's preferred stimulus [10].
Preference for orientation is considered relatively stable in the primary visual cortex (V1) as an emergent property that is established early in life following the so called critical period [11]. Classically, spike waveforms allow dissociating two functional cell-groups into excitatory pyramidal cells and inhibitory interneurons [12, 13]; hence it is worth investigating how these two cell types react to adaptation. To this aim, we dissociated the recorded cells and analyzed their respective orientation tunings before and after adaptation to a non-preferred orientation. This study deciphers whether after adaptation there is a relation between behaviour (attractive or repulsive) of
Author's Post-print, published in NeuroReport Vol. 23 , pp. 88-92 http://dx.doi.org/10.1097/WNR.0b013e32834e7e71
cells and their respective waveforms. The most novel and interesting finding in our results was that the regular-spiking cells always shifted with higher magnitude than fast-spiking cells after adaptation. Furthermore, both types of cells shifted their peaks of orientations in either direction. Methods
Animal preparation and Electrophysiological recordings
Experiments were carried with the approval of Université de Montréal animal care committee following the guidelines of the Canadian Council on Animal Care. Anesthetised and paralyzed cats were prepared for electrophysiological recordings in upper layers of visual cortex (2-3, recording depths 250- in a conventional fashion fully described previously [8, 9, 14]. A brief account is provided below.
Adaptation protocol
After manual receptive field characterization (all receptive fields were within 15o of area centralis), electrically generated 9 oriented drifting gratings were selected and centered on the preferred orientation for the entire experiment. Tuning curves covered 180° (22.5° intervals). Test orientations were presented in monocular fashion in random order. Each oriented stimulus was presented in blocks of 25 trials (4.1 s each) with a random inter-trial interval (1.0-3.0 s) during which no stimulus was presented. Once control orientation tuning curves were characterized, an adapting oriented stimulus was presented continuously for 12 minutes.The adapting stimulus was a drifting grating whose orientation was generally set within 22.5 to 67.5° of the neurons' preferred orientations. No recordings were performed during this adaptation period. Immediately after adaptations, orientation tuning curves were measured starting with the adapting and control preferred orientations, while the remaining orientations were recorded in random order.
Data analysis
Once single cells were sorted out off-line from multi-unit spike trains accumulated during data acquisition (Spike 2, Cambridge Electronic Design), orientation tuning curves were constructed from raw data and fitted with the Gaussian function. This allowed us to determine with precision the preferred orientation of neurons and then measure shifts in orientation preference. The Gaussian function is defined as:
y = b + rmx*exp (-((x-x0) ^2)/2s^2)
where b = baseline, rmx = max firing rate, x = used orientation, x0 = opt. ori, s = sigma. In the present study, over 82% of V1 neurons were well tuned to stimulus orientation. However, it was necessary to ensure that cells in our sample were properly tuned for orientation. In our experiments, 25 consecutive measurements of a neuron's response to the same stimulus yielded 25 slightly different tuning curves. Adaptation-induced shifts were measured as the distance between peak positions of the fitted tuning curves before and after conditioning. To assess the statistical significance of tuning shifts, curve fits were generated separately for each of the 25 trials, and the mean difference was tested by a paired t-test. In all cases, shifts in preferred orientation greater than 5° are statistically significant (paired sample two-tailed t-test, p < 0.01) [9].
Cells were sorted out offline from multi-unit activity of the recording site and were analyzed cell by cell (single unit activity). We measured the degree of shift for each cell. This allowed us to classify the cells on the basis of their behaviour: attractive or repulsive, or with no shift (preferred
orientation remained within 5o of the initial optimal orientation). The spike waveforms were dissociated in the ascending phase of the action potential by measuring the slope (dv/dt) of each spike within an interval of 0.2 ms. This computation allowed us to separate the regular-spiking cells from the fast-spiking cells [15,16].
Polar plots to calculate the bandwidth of each cell were constructed on the basis of its response at all orientations. Chi-square test was done to estimate significance of difference between the bandwidth of fast spikes and regular spikes.
Results
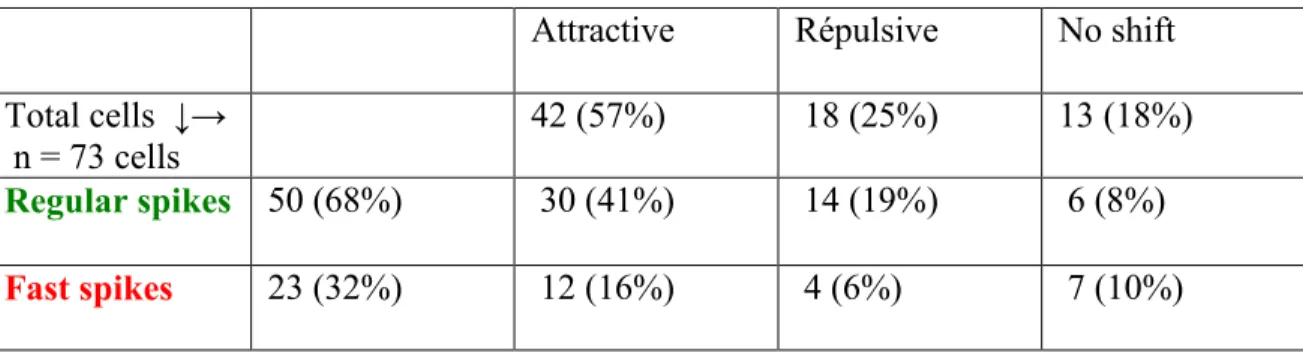
We recorded the multi-unit activity of cells for stimulations at 9 orientations in the primary visual cortex of anaesthetized cats before and after adapting the neurons for a period of 12 minutes. We analyzed the single-unit activity of cells by spike sorting and we sorted out 73 cells (Table 1). Fig 1a shows the distribution of regular and fast spikes according to dv/dt (slope) calculations in a time window of 0.2 ms. Both groups are clearly distinguished. In Fig.1b, waveforms of all 73 cells were overlaid illustrating the difference between spike shapes, wherein red waveforms stand for fast-spiking cells (n=23) while green indicates regular-spiking cells (n=50). Furthermore, we compared the distribution pattern of spikes for the rising phase of waveforms. We found that regular spikes and fast spikes were distinct by their ascending phase, i.e., regular spikes always had a lesser slope than fast spikes (Fig.1a, 1b). Also, after aligning the waveforms of fast spikes and regular spikes at the same origin we observed that regular spikes peak earlier than fast spikes by a phase difference of (almost) 0.1 ms (Fig 1b).
We then classified neurons on the basis of their behaviour (attractive, repulsive, no shift) and shape (regular or fast). Overall results are summarized in Table 1. Fig. 2 illustrates a typical example. In Fig. 2a and 2b, Gaussian tuning curves are plotted for two individual cells for all 25 trials. Waveforms for these cells are illustrated in Fig 2c and 2d. The cell in Fig. 2a shifted by 20o while the cell in Fig. 2b shifted by 15o. Both units shifted in the attractive direction (t-test, P< 0.05), even though they belonged to different groups. Consistent with published data [4, 17], regular-spiking cells had a sharper tuning curve to orientation while fast-spiking cells exhibited a broader tuning curve. Indeed, both types of cells react in attractive or repulsive directions. The polar plot (Fig.2e) exhibiting the bandwidth illustrates the representative difference characterizing both types of cells. Fast-spiking cells responded strongly to more orientations creating broadly tuned bandwidths than regular-spiking cells that responded strongly to a few orientations (roughly optimal) creating narrowly tuned bandwidths (Fig.2e) because discharge rates declined rapidly as the angle of orientation tilted away from the preferred axis [1, 2, 9-11]. Chi-square tests compared the responses at every tested orientation and showed a significant difference between both band widths (P<0.0001, alpha <0.05. n= 8 orientations).
Moreover, as shown in Fig. 3, regular-spiking cells for attractive behaviour shifted within a range of 5 o-85.5 o (average shift 21o) and the fast-spiking cells shifted within a range of 6 o-27 o (average shift 14 o), (Fisher test, P < 0.05). Similarly, regular-spiking cells for repulsive behaviour shifted within a range of 10 o-23o (average shift 15 o) and the fast-spiking cells shifted to 9 o.
Discussion:
The results of our study indicate that both types of functionally identified cells exhibit, following relatively long adaptation (12 min), shifts of their peaks of the orientation tuning curves in both directions, attractive and repulsive. The most interesting result that we found after induced adaptation to a non-preferred orientation is that the regular-spiking cells and the fast-spiking cells shift in a consistent pattern with respect to each other, though to different degrees.
Therefore, directions of shifts are independent of types of waveforms. As expected from previous studies attractive shifts were more frequent [8]. Such common behaviour suggests that neurons reacted collectively irrespective of the cell type. Our conclusion is in line with an earlier investigation showing that in most cases all cells recorded by a single electrode tip shift in the same direction [9]. These observations suggest that adaptation impacts a neuronal network, where a large proportion of cells change their preferred orientation jointly. However, fast-spiking units shift with a smaller magnitude than regular-spiking units. Various studies have indicated that fast-spiking cells are interneurons [18-22] with broader bandwidths of their tuning curves [15, 25]. Their broader orientation tuning is a sign that these neurons are driven by a large spectrum of orientations with approximately equal strength. In that case it is likely that each oriented input is (s) withabout comparable magnitude.Therefore, if one assumes that adaptation affects mostly the testing orientation, the other inputs maintain their excitatory drive producing relatively higher firing rates. The net result is a relatively lesser shift of the peak of the tuning curve.
On the other hand,the regular-spiking cells are pyramidal cells [22-24] with narrower bandwidths [18, 28]exhibiting much sharper tuning curves. Consequently, the range of orientations generating higher firing rate is small, presumably due to a combination of inhibitory inputs [19] sharpening the bandwidths. Thus, optimal responses are produced by a smaller range of oriented input. Therefore, the modified equilibrium between excitation and inhibition induced by adaptation results in larger shifts because imposed orientation potentiate response, while remote orientations contribute less to the tuning curves. Indeed, in line with previous reports [4, 8, 9] responses evoked by flanked orientations did not change significantly.
Based on our findings, we hypothesize that in the primary visual cortex of cat after adaptation the pyramidal cells and interneurons interact and communicate with each other in an organised way to respond to orientation stimuli.
Conclusion:
To our knowledge, this study is the first to show that the regular-spiking cells always shift more than the fast-spiking cells after adaptation to stimuli. We may conclude that in primary visual cortex of the cat, pyramidal cells and interneurons interact with each other in parallel to respond to induced adaptation stimuli. Pyramidal cells set the orientation selectivity and the interneurons regulate this selectivity.
References:
1 Hubel DH, Wiesel TN. Receptive fields of single neurones in the cat's striate cortex. J Physiol. 1959; 148:574 591.
2 Hubel DH, Wiesel TN. Receptive fields and functional architecture of monkey striate cortex. J Physiol. 1968; 195(1):215 243.
3 Movshon JA. The velocity tuning of single units in cat striate cortex. J Physiol. 1975; 249(3):445 468.
4 Dragoi V, Sharma J, Sur M. Adaptation-induced plasticity of orientation tuning in adult visual cortex. Neuron 2000; 28(1):287-298.
5 Kohn A, Movshon JA. Neuronal adaptation to visual motion in area MT of the Macaque. Neuron 2003; 39:681-691.
6 Ghisovan N, Nemri A, Shumikhina S, Molotchnikoff S. Visual cells remember earlier applied target: plasticity of orientation selectivity. PLoS ONE 2008; 3(11):e3689.
7 Yap H, Dan Y. Stimulus timing-dependent plasticity in cortical processing of orientation. Neuron 2001; 32:315-323.
8 Ghisovan N, Nemri A, Shumikhina S, Molotchnikoff S. Long adaptation reveals mostly attractive shifts of orientation tuning in cat primary visual cortex. Neuroscience 2009; 164:1274-1283.
9 Nemri A, Ghisovan N, Shumikhina S, Molotchnikoff S. Adaptive behaviour of neighboring neurons during adaptation-induced plasticity of orientation tuning in V1. BMC Neuroscience 2009; 10:147.
10 Maffei L, Fiorentini A, Bisti S. Neural correlate of perceptual adaptation to grating. Science 1973; 182 (4116):1036-1038.
11 Chiu C, Weliki M. The role of neural activity in the development of orientation selectivity. In The Visual Neurosciences, edited by: Chalupa LM, Werner J. Cambridge, MA: MIT Press; 2003:117-125.
12 Ding L , Gold J I. Neural correlates of perceptual decision making before, during, and after decision commitment in monkey frontal eye field. Cerebral Cortex 2011.
13 -Rakic PS. Functional synergism between putative gamma-aminobutyrate-containing neurons and pyramidal neurons in prefrontal cortex. Proc Natl Acad Sci. 1994; 91:4009-4013.
14 Marshansky S, Shumikhina S, Molotchnikoff S. Repetitive adaptation induces plasticity of spatial frequency tuning in cat primary visual cortex. Neuroscience 2011; 13(172):355-365. 15 Kuhlman SJ, Tring E, Trachtenber JT. Fast-spiking interneurons have an initial orientation bias that is lost with vision. Nature Neuroscience 2011; 14: 1121-1123.
16 Ge R, Qian H, Wang J. Physiological synaptic signals initiate sequential spikes at soma of cortical pyramidal neuron. Molecular Brain 2011; 4:1.
17. Kohn A, Movshon JA. Neuronal adaptation to visual motion in area MT of the macaque. Neuron. 2003; 39(4):681-91.
18 González-Burgos G, Krimer L S,Povysheva NV, Barrionuevo G, Lewis DA. Functional properties of fast spiking interneurons and their synaptic connections with pyramidal cells in primate dorsolateral prefrontal cortex. Journal of Neurophysiology 2005; 93(2): 942-953.
19 Fries P, Nikolic D, Singer W. The gamma cycle. Trends in Neurosciences 2007; 30(7): 309- 316.
20 Gouwens NW, Zeberg H, Tsumoto K, Tateno T, Aihara K, Robinson HPC. Synchronization of firing in cortical fast-spiking interneurons at gamma frequencies: A phase-resetting analysis. PLoS Computational Biology 2010; 6(9):e1000951.
21 Povysheva NV, González-Burgos G, Zaitsev AV, Kroner S, Barrionuevo G, Lewis DA, Krimer LS. Properties of excitatory synaptic responses in fast-spiking interneurons and pyramidal cells from monkey and rat prefrontal cortex. Cerebral Cortex 2005; 16(4) :541-552.
22 Galarreta M, Hestrin S. Electrical and chemical synapses among parvalbumin fast-spiking GABAergic interneurons in adult mouse neocortex. Proc Nat Acad. Sci. 2002; 99(19): 12438-12443.
23 McCormick DA, Connors BW, Lighthall, JW, Prince DA. Comparative electrophysiology of pyramidal and sparsely spiny stellate neurons of the neocortex. J. Neurophysiol 1985; 54:782-806.
24 Chang Y, Luebke JI. Electrophysiological diversity of layer 5 pyramidal cells in the prefrontal cortex of the Rhesus monkey: In vitro slice studies. Journal of Neurophysiology 2007; 98(5):2622-2632.
25 Hofer SB, Ko H, Pichler B, Vogelstein J, Ros H, Zeng H, Lein E, Lesica NA, Mrsic- Floge TD. Differential connectivity and response dynamics of excitatory and inhibitory neurons in visual cortex. Nat Neuroscience 2011; 14(8):1045-54.
Figure legends Fig. 1
Comparison between regular spikes and fast spikes. (a) Distribution of regular and fast spikes based on dv/dt (slope) in a time window of 0.2ms. (b) Superposition of regular spikes and fast spikes from all cells.
Fig. 2
An example of an attractive orientation tuning shift for a fast-spiking cell and a regular-spiking cell. (a) Cell displayed a 20° attractive shift following adaptation in the case of a regular waveform of the spike. Downward triangle indicates the adapting orientation. (b) Cell displayed a 15° attractive shift following adaptation in the case of a fast waveform of the spike. Downward triangle indicates the adapting orientation. (c) Example of a regular spike waveform. (d) Example of a fast spike waveform. (e) Polar plots (fast and regular cell superimposed) of two cells: regular-spiking cell and fast-regular-spiking cell.
Fig .3
Distribution of two classes of spikes according to post-adaptation shift of attractive, repulsive and no shift cells.
Figure 3 demonstrates that magnitudes of attractive and repulsive shifts are higher in regular-spiking cells than the fast-regular-spiking cells (Fisher test between regular-regular-spiking attractive cells and fast-spiking attractive cells: P value < 0.05) The maximum value of the shift was 85.5° and 26.7°, respectively for regular and fast-spiking cells. The small number (n=4) of fast-spiking cells with repulsive reaction precludes statistical computations, yet the trend appears clear that the peaks of the orientation tuning curves for regular-spiking cells in the repulsive direction were also displaced to a larger extent.
Orientation-selective neurons shift their preferred orientation after being adapted to a non-preferred orientation. These shifts of the peaks of tuning curves may be in the attractive or repulsive direction in relation to the adapter orientation. In anaesthetized cats we recorded evoked electrical responses from the visual cortex in a conventional fashion. The recorded spikes in cortex may present two typical waveforms: regular spikes or fast spikes. However, there is no evidence whether the shapes of spikes are related to the attractive or repulsive shifts of orientation tuning curves of cells. Our results show that after adaptation the recorded cells with both attractive and repulsive shifts display one or the other shape of spike. However, the magnitude of shifts is systematically higher for regular spikes, which is attributed to putative pyramidal cells, while tuning curves for fast spikes have smaller magnitudes and are evoked by putative interneurons.
Table 1: Classification of cells after adaptation.
Attractive Répulsive No shift n = 73 cells 42 (57%) 18 (25%) 13 (18%) Regular spikes 50 (68%) 30 (41%) 14 (19%) 6 (8%)