The effect of albumen removal before incubation (embryonic protein
under-nutrition) on the post-hatch performance, regulators of protein
translation activation and proteolysis in neonatal broilers
Nadia Everaert
1*, Sonia Me´tayer-Coustard
2, Hilke Willemsen
1, Haitang Han
3, Zhigang Song
4,
Zarbakht Ansari
5, Eddy Decuypere
1, Johan Buyse
1and Sophie Tesseraud
21Division of Livestock-Nutrition-Quality, Department of Biosystems, KU Leuven, Kasteelpark Arenberg, 30, 3001 Leuven,
Belgium
2INRA, UR83 Recherches Avicoles, F-37380 Nouzilly, France
3Department of Biochemistry and Molecular Biology, College of Biological Sciences, Beijing 100193,
People’s Republic of China
4Laboratory of Animal Econutrition, Department of Animal Science, Shandon Agricultural University, Taian,
Shandong 271018, People’s Republic of China
5Department of Animal Science, Sari Agricultural Sciences and Natural Resources University, Sari, Iran
(Submitted 8 February 2012 – Final revision received 28 September 2012 – Accepted 1 October 2012 – First published online 14 December 2012)
Abstract
Albumen was removed from broiler eggs before the start of incubation to induce prenatal protein under-nutrition in chicken embryos. With this method, the direct effect of protein deficiency was investigated, differing from mammalian models manipulating the maternal diet where indirect, hormonal effects can interfere. Based on the estimated albumen/egg weight ratio, 10 % of albumen was removed with an 18G needle, after making a hole at the sharp end of the egg with another 18G needle. Eggs were taped thereafter. The sham group underwent the same procedure, except that no albumen was removed. Control eggs did not receive any treatment. The removal of albumen decreased both embryonic and post-hatch body weight up to day 7 compared with the control group. On embryonic day 18, embryos from the albumen-deprived group had higher plasma uric acid levels compared with the sham (P¼ 0·016) and control (P¼ 0·009) groups. Moreover, a lower plasma amino acid concentration was observed at hatch compared with the sham (P¼ 0·038) and control (P¼ 0·152) groups. These findings indicate an altered protein metabolism. At hatch, a higher mRNA expression of muscle ring finger-1 (MuRF1), a gene related to proteolysis, was observed in albumen-deprived chicks compared with the control and sham chicks, together with an up-regulated expression of atrogin-1 (another atrogene) at this time point in the male protein-deficient chicks. These findings suggest that muscle proteolysis is transiently increased by the removal of albumen before the start of incubation. No evidence was found for altered protein synthesis capacity and translational efficiency in albumen-deprived chicks.
Key words:Prenatal under-nutrition: Protein metabolism: Signalling: Chickens
The two major components of an egg, i.e. albumen and yolk, differ in biochemical composition and accomplish different functions during embryonic and postnatal development(1). The yolk is the main source of lipids, whereas the albumen is a key source of water and proteins(2). Changes in relative yolk and albumen ratio are considered to be an important mechan-ism of maternal effects. Therefore, recent studies have been per-formed on the removal of albumen from barn swallow eggs(3,4) and yellow-legged gull eggs(5). In addition, the removal of
albu-men from an egg is useful as a model to study the direct effect of nutrient deficiency during embryonic development(6) on the
growth and metabolism of the newborns. This model differs from the model of protein under-nutrition during embryonic development induced by manipulations of the maternal diet, which can be considered as an indirect model where the effect of maternal hormones can interfere. Rats and mice have been used extensively to look for the effect of maternal diet on the programming of the progeny. Recently, also in chickens, the effect of a low-protein diet on the metabolic programming of the progeny was investigated(7). Studying these two models
(direct and indirect effects of nutrient deficiency) can give us a better understanding of the effect of restricting nutrients or
* Corresponding author: Dr N. Everaert, fax þ 32 16 321994, email nadia.everaert@biw.kuleuven.be
Abbreviations: 4E-BP1, 4E-binding protein; ED, embryonic day; MuRF1, muscle ring finger-1; p, phosphorylated; S6K1, 70 kDa S6 kinase.
qThe Authors 2012
British
Journal
of
both nutrients and maternal hormones. Interestingly, besides a decreased embryo and chick weight at hatch(6,8,9) due to
albumen removal, Ruijtenbeek et al.(10) and Miller et al.(11) also found disproportionate growth retardation. Moreover, Muramatsu et al.(12)observed a reduced whole-body protein synthesis by the removal of albumen from eggs before incubation. However, further knowledge is lacking.
Amino acids are substrates for protein synthesis and are also known to act as modulators of signal transduction pathways that control metabolism. In particular, certain amino acids affect the activity of several proteins involved in the control of mRNA translation, such as 4E-binding protein (4E-BP1), 70 kDa S6 kinase (p70S6K, also called S6K1) and one of its downstream targets, the ribosomal protein S6(13,14). Muscle mass depends on the dynamic balance between the processes of protein synthesis and degradation. In the last decade, studies on gene expression profiling have highlighted genes specifically induced during atrophy (atrophy-related genes, also called atrogenes) and related to proteolysis, i.e. muscle atrophy F box (MAFbx or atrogin-1) and muscle ring finger-1 (MuRF1)(15,16). These genes encode muscle-specific E3-ubiquitin ligases involved in the ubiquitination of proteins targeted to the ubiquitin – proteasome-dependent proteolytic system. It has been shown in the chicken that MuRF1 gene expression was increased by fasting(17), and atrogin-1 gene expression was also increased by fasting(17,18), whereas re-feeding or glycine supplementation suppressed it(18,19). In addition, Tesseraud et al.(20) have shown that atrogin-1 and MuRF1 were regulated in chickens transiently receiving lower lysine intake in sequential feeding programmes.
The aim of the present study was to investigate the direct effect of nutrient (protein) deficiency during chicken embryo-nic development, by the removal of albumen from the egg before incubation, on post-hatch performance, metabolism and signalling. In the present study, we also focused on the regulation of two important genes that control the polyubiqui-tination and, thus, the degradation of proteins, by measuring the expression of atrogin-1 and MuRF1 in breast muscle.
Materials and methods Experimental design
A total of 1230 fertile Cobb eggs (Belgabroed) were numbered and weighed. From thirty eggs, albumen weight and yolk weight were determined. The ratio of albumen weight/egg weight was used to estimate the albumen content in all eggs. From 800 eggs (albumen-deprived group), based on their initial egg weight and on the estimated albumen/egg weight ratio, 10 % of albumen was removed at the sharp end of the egg with a 18G needle and syringe after cleaning the egg with 70 % ethanol. After albumen removal, eggs were cleaned again with ethanol and taped. In 200 other eggs, a hole was made at the sharp end of the egg with a needle (18G), through the membranes, and taped thereafter to give the sham group. The other 200 eggs served as a control group. All eggs were set in one incubator (Pasreform) and incubated under standard conditions (37·88C, 55 % relative
humidity, turning once an hour over 908) with the blunt end upside. On embryonic day (ED) 18, all eggs were candled and those with living embryos were transferred to hatching baskets. At hatch, all chicks were weighed and numbered. Hatchability was defined as hatched chicks £ 100/all set eggs. The sex was determined by cloacal sexing (Hobo Chick Sexing B.V.B.A.). All chicks received a leg number and were housed for 1 week in a poultry house, with wood shavings as litter. Chicks had ad libitum access to food and water. The light schedule provided 23 h of light per d. Chicks were weighed on days 3, 5 and 7.
Sampling
On ED18, ten embryos per treatment were poured out of the egg and weighed after the yolk was removed. The breast muscle was dissected and snap-frozen in liquid N2before
sto-rage at 2 808C. The water content of the remaining chick was measured by drying the chick in an oven for 24 h at 1058C.
At hatch, before cloacal sexing, twelve chicks from each treatment (albumen-deprived, control and sham) were killed by decapitation and the blood was collected in heparinised tubes. The yolk was weighed and proportional yolk weight was defined as yolk weight £ 100/chick weight. The breast muscle was dissected and snap-frozen in liquid N2before
sto-rage at 2 808C. The sex was determined after dissection. There were eight, six and nine females for the albumen-deprived, control and sham groups, respectively, and, hence, four, six and three males for these groups, respectively. The water con-tent of the remaining chicks was measured by drying the chicks in an oven for 24 h at 1058C.
On days 3, 5 and 7, eight chicks of each sex per treatment were killed by decapitation to collect the blood in heparinised tubes and to dissect the breast muscle. The tissue was snap-frozen in liquid N2before storage at 2 808C.
The experimental set-up was approved by the Ethical Com-mission for Experimental Use of Animals of the KU Leuven.
Sexing chick embryos of embryonic day 18
A small piece of breast muscle tissue of embryos of ED18 was used to determine the sex, as described by Clinton et al.(21). In
short, DNA was extracted and a PCR was performed using sex-specific (Xhol, present on the W-chromosome of females) and control (18S) primers.
Plasma analysis
Blood was centrifuged and the plasma was stored at 2 208C until further analysis. The amino acid concentration in the plasma was determined as described by Dupont et al.(17). Plasma glu-cose (VetTest 9820369), uric acid (VetTest 9820378) and TAG (VetTest 9820377) concentrations were measured using a Vet Test 8008 analyser (Idexx laboratories, Inc.). The apparatus is based on dry chemical technology and colorimetric reaction. Sample analysis is carried out on selective testing discs (Idexx Laboratories, Inc.) by means of a laser reading the bar codes.
British
Journal
of
Ribosomal capacity assessed in breast muscle tissue
The ribosomal capacity, i.e. the capacity for protein synthesis, was calculated as the ratio of RNA to protein(22), according to Schmidt-Thannhauser, as modified by Munro & Fleck(23). It is
an index related to the number of ribosomes and, thus, protein synthesis machinery(24). In short, protein content was measured by colorimetric reaction with bicinchoninic acid (Interchim). Total RNA was measured on the basis of UV absorbance at 260 nm, with a correction for peptide material based on the UV absorbance at 232 nm.
Atrogin-1 and muscle ring finger-1 expression in the breast muscle
Total RNA was extracted from the breast muscle samples at ED18, hatch, day 3 and day 7 using RNA Now (Biogentec), according to the manufacturer’s recommendations. Concen-trations of RNA were measured by spectrophotometry (optical density 260 nm), and RNA integrity was electrophoretically ver-ified using ethidium bromide. After DNAse treatment (Ambion, Clinisciences), RNA was reverse-transcribed using Super Script II RNase H Reverse Transcriptase (Invitrogen) in the presence of Random Primers (Promega). Real-time PCR was performed using an ABI Prism 7000 apparatus (Applied Biosystems) with primers, as described in Table 1. mRNA levels were estimated on the basis of PCR efficiency and threshold cycle (Ct) deviation
of an unknown sample v. a reference sample. Runs were per-formed in duplicate. 18S mRNA was chosen as the reference gene to standardise the mRNA expression of each gene.
Preparation of breast muscle lysates and Western blotting
Breast muscle lysates from hatch and day 7 were prepared, as described previously(25). Tissue lysates (40 mg protein) were subjected to SDS-PAGE gel electrophoresis and Western blotting using the appropriate antibody: anti-phospho-Thr389 S6K1, anti-phospho-Ser235/236 S6, anti-phospho-(Thr34/46) 4E-BP1 or anti-S6 (Cell Signaling Technology); anti-S6K1 (Santa Cruz Biotechnology); or anti-vinculin (Sigma Chemical Company). These commercial antibodies directed against mammalian proteins have been previously shown to cross-react with chicken homologue protein to a good extent(25,26). After wash-ing, membranes were incubated with an Alexa Fluor secondary antibody (Molecular Probes, Interchim). Bands were visualised
by IR fluorescence using the Odysseyw
Imaging System
(LI-COR, Inc. Biotechnology) and quantified by Odyssey infra-red imaging system software (application software, version 1.2).
Statistical analysis
All data were processed using the statistical software package SAS version 9.2 (SAS Institute Inc.). Linear models were applied to analyse the effect of treatment (albumen-deprived, control and sham), sex (female or male) and age (ED18, hatch, day 3, day 5 and day 7) on the measured parameters using general linear models in SAS. Post hoc tests are only applied for pertinent significant effects in the models.
Due to an age and sex effect and age, sex and treatment interaction on 18S, results of the target gene expression were analysed and presented with and without normalisation with 18S. In addition, due to these effects on 18S, the mRNA levels of the genes/18S were analysed per sex and per time point. A log transformation was used to obtain homogeneity of variances for all data on gene expression.
A logistic regression model was developed to analyse the hatchability. The treatment served as a categorical explanatory variable in the model.
Body weight was analysed by the use of repeated measure-ments in a linear mixed model after a log transformation, con-taining age, treatment and sex and their interactions as factors. Data used for chick weight were only those from chicks that remained in the experiment until day 7. Differences between treatments were analysed by the specification of contrasts based on the significant model.
For all parameters, significance was set at a 5 % level. All values are expressed as means, with their standard errors. When no sex effect was observed, no distinction between sexes is shown in the tables or figures.
Results
Zootechnical results
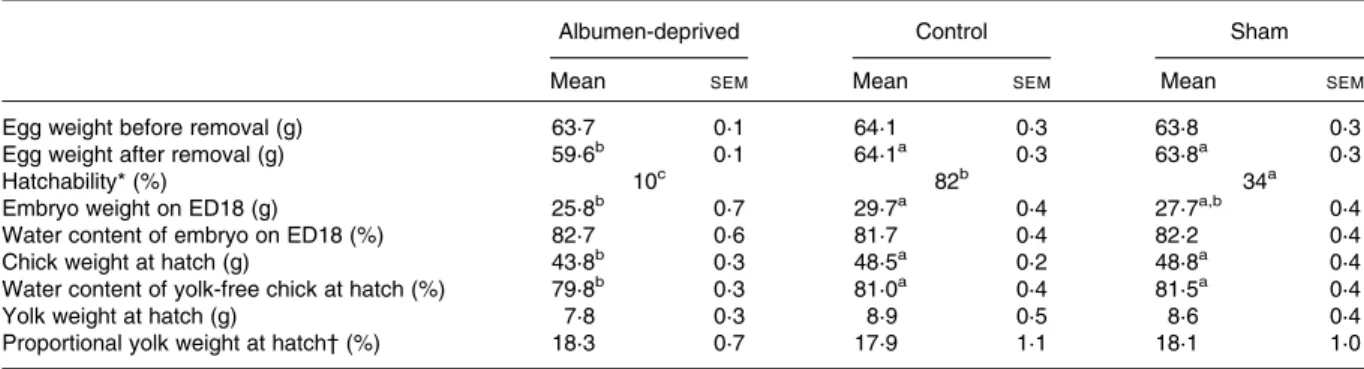
The albumen weight was 55·5 (SEM0·4) % of the egg weight,
as an average of the thirty eggs was used to determine the albumen/egg weight ratio. About 4 g of albumen was removed from the experimental group (Table 2). The removal of albu-men increased embryonic death (treatalbu-ment P, 0·001), result-ing in a very low hatchability compared with the sham and control groups (both P, 0·001). Moreover, the sham group exhibited a significantly lower hatchability compared with the control group (P, 0·001). No difference in the number of hatched females or males was observed between treatments (no sex effect or sex £ treatment interaction). On ED18, there was a significant treatment effect (P, 0·001) on embryo weight, but no sex effect or sex £ treatment interaction. Embryos from the albumen-deprived group were lighter than those of the control group (P, 0·001), while the sham group had intermediate values (Table 2). There was no differ-ence in water content of the embryos on ED18 between treat-ment or sex, nor was there any interaction. There was no sex effect on embryo weight and water content of the embryo/ chick on ED18 or at hatch. At hatch, chick weight and the Table 1. Primers used for quantitative RT-PCR
Gene Primer sequence
Atrogin-1 Forward GACGCGCTTTCTCGATGAG
Reverse CCTTGTTATTCAGTAGGTCTTTTTTCCT
MuRF1 Forward TGTCTATGGGCTGCAGAGGAA
Reverse GGTGCTCCCCCTTCTTGAGT
18S Forward TCCAGCTAGGAATAATGGAATAGGA
Reverse CCGGCCGTCCCTCTTAAT
MuRF1, muscle ring finger-1.
British
Journal
of
water content of the chicks used for sampling differed signifi-cantly between treatments (treatment P, 0·001 for both par-ameters). The chick weight at hatch was lower in the albumen-deprived group compared with both the sham and the control groups (albumen-deprived v. control and sham both P, 0·001) (Table 2). The remaining yolk weight and the proportional yolk weight at hatch did not differ between treat-ment or sex, nor was there any interaction (Table 2).
The body weight from hatch until day 7 is shown in Fig. 1. A log transformation was performed on the raw data to obtain homogeneity of variances. There was a general treatment and age effect (both P, 0·001). There was an interaction between sex and treatment (P¼ 0·008) on body weight from hatch until day 7. Female chicks from the albumen-deprived group had a lower body weight compared with control (P, 0·001) and sham (P, 0·001) female chicks on all measured time points. Female sham chicks did not differ from female control chicks. Male albumen-deprived and sham chicks had a lower body weight compared with control male chicks on all measured time points (both P, 0·001).
Plasma analysis
There was a significant effect of age (P¼ 0·025), treatment (P¼ 0·013) and sex x age interaction (P¼ 0·001) on plasma amino acid concentration. In general, the albumen-deprived group had significantly lower amino acid levels than the sham group (P¼0·015) and was marginally significantly different from the control group (P¼0·058), while the sham and the con-trol groups did not differ from each other (Fig. 2). Females had a higher amino acid concentration compared with males on day 7 (P¼0·021). Plasma uric acid concentration increased with age (P,0·001) and did not differ between sexes (Fig. 3). There was a significant interaction between treatment and age (treatment £ age P¼0·001). On ED18, the albumen-deprived group had higher levels than the control (P¼0·009) and sham groups (P¼0·016). At hatch, the albumen-deprived group had lower levels than the sham group (P¼0·031) and the levels of the control group were intermediate. Plasma glucose concentration increased with age until day 5 and decreased on day 7 (age P,0·001), without differences among sex, treatment Table 2. Egg weight before and after removal of albumen (g), hatchability, yolk-free embryo weight on embryonic day (ED) 18 (n 10) and water content of the yolk-free embryo (%), chick weight at hatch (g), water content of the yolk-free chicks (%) (n 12), yolk weight (g) and proportional yolk weight at hatch (%)
(Mean values with their standard errors)
Albumen-deprived Control Sham
Mean SEM Mean SEM Mean SEM
Egg weight before removal (g) 63·7 0·1 64·1 0·3 63·8 0·3
Egg weight after removal (g) 59·6b 0·1 64·1a 0·3 63·8a 0·3
Hatchability* (%) 10c 82b 34a
Embryo weight on ED18 (g) 25·8b 0·7 29·7a 0·4 27·7a,b 0·4
Water content of embryo on ED18 (%) 82·7 0·6 81·7 0·4 82·2 0·4
Chick weight at hatch (g) 43·8b 0·3 48·5a 0·2 48·8a 0·4
Water content of yolk-free chick at hatch (%) 79·8b 0·3 81·0a 0·4 81·5a 0·4
Yolk weight at hatch (g) 7·8 0·3 8·9 0·5 8·6 0·4
Proportional yolk weight at hatch† (%) 18·3 0·7 17·9 1·1 18·1 1·0
a,b,cValues within a row with unlike superscript letters were significantly different (P, 0·05).
* Hatchability ¼ number of chicks/number of set eggs £ 100. † Proportional yolk weight at hatch ¼ yolk weight/chick weight £ 100.
(A) (B)
Age
Hatch Day 3 Day 5 Day 7
Body weight (g) 0 20 40 60 80 100 120 140 160 180 Body weight (g) 0 20 40 60 80 100 120 140 160 180 Age
Hatch Day 3 Day 5 Day 7
Fig. 1. Chick weight (g) by sex from hatch until day 7 post-hatch for the albumen-deprived (Al, ), control (C, ) and sham (S, ) groups. Values are means, with standard errors represented by vertical bars. (A) For the females, n 15, 26 and 11 for the Al, C and S groups, respectively (Al v. C, P, 0·001; Al v. S, P, 0·001; C v. S, P. 0·05). (B) For the males, n 17, 26 and 10 for the Al, C and S groups, respectively (Al v. C, P, 0·001; Al v. S, P. 0·05; C v. S, P, 0·001). Only chicks remaining in the experiment until day 7 were used in the model (age P, 0·001; treatment P, 0·001; sex P. 0·05 and sex £ treatment P¼ 0·008). The specification of contrasts was used to analyse differences between treatments.
British
Journal
of
or interaction (data not shown). Plasma TAG concentration decreased with age (P,0·001), without an effect on sex, treat-ment or interaction (data not shown).
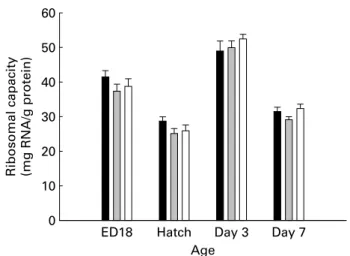
Ribosomal capacity assessed in the breast muscle tissue
Only an age effect (P, 0·001) was observed for the ribosomal capacity of the breast muscle tissue. Levels decreased from ED18 until hatch (Fig. 4). On day 3, the highest levels were measured, which decreased again on day 7. The ribosomal capacity did not differ between treatments or sex, nor was there any interaction.
Signalling pathways related to mRNA translation
Fig. 5 shows the ratio of the phosphorylated to the total protein for S6 and S6K1 and the ratio of phosphorylated (p)-4E-BP1 to vinculin at hatch and on day 7. There was, at both ages, no effect of sex, treatment or interaction on p-S6(S235 – 236)/S6 and p-S6K1(T389)/S6K1. In addition, Western blot analysis revealed no differences among treat-ments, sex and interaction for p-S6(S235 – 236)/vinculin, S6/vinculin, S6K1/vinculin at hatch and on day 7 (data not shown). At hatch, there was no treatment, sex or interaction effect on p-S6K1(T389)/vinculin (data not shown) and p-4E-BP1/ vinculin. On day 7, p-S6K1(T389)/vinculin (data not shown) and p-4E-BP1/vinculin levels were higher in females than in males (P¼0·003) (Fig. 5).
Atrogin-1 and muscle ring finger-1 mRNA expression in breast muscle
There was a significant effect of age (P, 0·001) and sex (P¼ 0·014) and interaction among sex, treatment and age (sex £ treatment £ age P¼ 0·049) on the gene expression of 18S (Fig. 6).
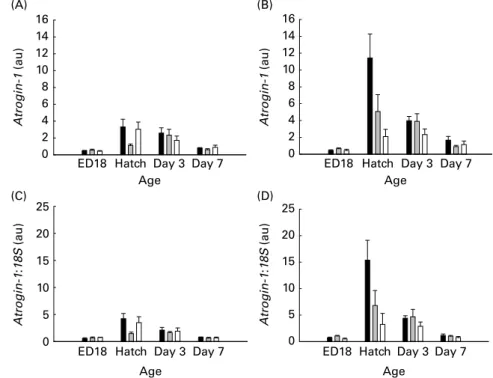
The mRNA expression of atrogin-1 and atrogin-1/18S in the breast muscle is shown in Fig. 7. There was a significant effect of treatment (P¼ 0·007), age (P, 0·001) and sex (P¼ 0·001) on
atrogin-1 expression. Levels were low on ED18 and increased at hatch to decrease again on day 3 and day 7. In general, the albumen-deprived group differed significantly from the sham group (P¼ 0·011), but not from the control group. When atrogin-1/18S expression was analysed per day and sex, no differences were observed between the treatments. The expression of MuRF1 revealed a significant effect of age (P, 0·001), sex (P¼ 0·041), treatment (P¼ 0·014), interaction between age and treatment (age £ treatment P¼ 0·001) and interaction among age, sex and treatment (age £ sex £ treatment P¼ 0·002). On ED18, levels were lower compared with other sampling days (Fig. 8). At hatch, for the females, higher MuRF1 levels were observed in the albumen-deprived group compared with the control group (P¼ 0·002), while the sham group was intermediate. For the males at hatch, higher MuRF1 levels were observed in the albumen-deprived group compared with the sham group (P¼ 0·043), with intermediate levels in the control group. MuRF1/18S levels were analysed
(A) (B) Age Amino acids (mg serine/ml plasma) Amino acids (mg serine/ml plasma) 0·0 0·2 0·4 0·6 0·8 1·0 1·2 1·4 1·6 b a,ba a b a,b 0·0 0·2 0·4 0·6 0·8 1·0 1·2 1·4 1·6
Hatch Day 3 Day 7
Age
Hatch Day 3 Day 7
Fig. 2. Plasma amino acid concentration (mgL-serine equivalents/ml) in chicks from the albumen-deprived ( ), control ( ) and sham ( ) groups at hatch, and on days 3 and 7 post-hatch (n 8 per treatment and per sex, except at hatch, where (A) n 8, 6 and 9 for the females of the albumen-deprived, control and sham groups, respectively and (B) n 4, 6 and 3 for the males of the albumen-deprived, control and sham groups, respectively). Values are means, with standard errors represented by vertical bars.a,bMeans values with unlike letters were significantly different for each time point (P, 0·05).
Age
ED18 Hatch Day 3 Day 7
Uric acid ( µ mol/l) 0 100 200 300 400 500 600 a b b a b a,b
Fig. 3. Plasma uric acid concentration (mmol/l) in chicks from the albumen-deprived ( ), control ( ) and sham ( ) groups at embryonic day (ED) 18, hatch and on days 3 and 7 post-hatch (n 10 per treatment on ED18; n 12 per treatment at hatch; and n 16 at days 3 and 7). Values are means, with stan-dard errors represented by vertical bars.a,bMeans values with unlike letters
were significantly different for each time point (P, 0·05).
British
Journal
of
per sex, per day. At hatch, the female albumen-deprived chicks had higher MuRF1/18S mRNA levels compared with the control group (P¼ 0·010) and the sham group (P¼ 0·051), the latter only numerically differing from the albumen-deprived females. No difference was found in the males between the albumen-deprived and sham groups.
Discussion
As proposed by Hill(6), the approach of removal of albumen before incubation can offer a unique avian model that enables the direct assessment of the independent influence of protein on growth and metabolism. In contrast, most animal models use mammals in which one can only examine the influence of nutrition on fetal development indirectly, typically by manip-ulating the mother’s nourishment. In the present model, the removal of protein by the removal of albumen clearly decreased both embryonic and post-hatch growth. The reduced embryo weight is in agreement with Deeming(8), who compared albumen-deficient embryos (by the removal of 5 ml on day 3 of incubation) with untreated control embryos and found a decreased wet and dry embryo weight from
Age
ED18 Hatch Day 3 Day 7
Ribosomal capacity (mg RNA/g protein)
0 10 20 30 40 50 60
Fig. 4. Ribosomal capacity (mg RNA/g protein) in breast muscle of chicks from the albumen-deprived ( ), control ( ) and sham ( ) groups on embryonic day (ED) 18, at hatch and on days 3 and 7 (n 10 per treatment on ED18 and n 12 per treatment on the other sampling time periods). Values are means, with standard errors represented by vertical bars.
p-S6K1:S6K1
p-S6:S6 p-4EBP1:vinculin
Phosphorylation level (au)
p-S6K1:S6K1 p-S6:S6
p-4EBP1:vinculin femalesp-4EBP1:vinculin males
Phosphorylation level (au) 0·0 0·2 0·4 0·6 0·8 1·0 1·2 1·4 1·6 (A) (B) Treatment S6 p-S6 S6K1 p-S6K1 Treatment Sex Al F F F M M M Al C S C S p-4E-BP1 Vinculin Treatment Al C S Al C S S6 S6K1 Vinculin p-S6K1 p-4E-BP1 p-S6 0·0 0·2 0·4 0·6 0·8 1·0 1·2 1·4 1·6
Fig. 5. Phosphorylation levels presented as ratios of phosphorylated (p)-S6K1(T389):S6K1, p-S6(S235 – 236):S6 and p-4E-BP1(T34/46):vinculin at (A) hatch and (B) on day 7 in the breast muscle of the albumen-deprived (Al, ), control (C, ) and sham (S, ) groups (n 12 per treatment at hatch and n 16 per treatment on day 7). Representative Western blots performed using antibodies raised against p-S6K1(T389), S6K1, p-S6(S235 – 236), S6, p-4E-BP1(T34/46) and vinculin as a protein-loading control. F, female; M, male; S6K1, 70 kDa S6 kinase; 4E-BP1, 4E-binding protein; au, arbitrary units. Values are means, with standard errors represented by vertical bars.
British
Journal
of
ED14 onwards. As albumen consists of 88·5 % water and 10·5 % protein(27), it is important to take the water content of the embryos/chicks into account. While the water content of the embryos was not affected by albumen removal on ED18, the water content of the yolk-free chicks was signifi-cantly reduced in the albumen-deprived group. However, the decreased water content in the albumen-deprived group cannot completely explain the 10 % decrease in body weight at hatch. Interestingly, Miller et al.(11) also noted a decreased body weight at hatch of chicks exposed to protein malnutrition,
without changes in chick length and together with a relative sparing of some organs such as brain and heart. Yolk consump-tion was not affected by albumen deprivaconsump-tion, measured by the residual yolk weight, which is in agreement with the results of Deeming(8). The removal of albumen had a persistent effect on post-hatch body weight up to day 7, compared with the control chicks. When compared with the sham group, albumen removal had long-term effects on the growth rate of females, with smaller differences for males, which is in agreement with the study of Hill(6), who only compared albumen-deficient
chicks with a sham group. The low hatchability of the albumen-deprived group is in agreement with Hill(6), who had a hatchability of 15 % when removing 8 % of albumen, and Finkler et al.(9). In contrast, Miller et al.(11)had a hatchability of 45 %, with 10 % albumen removal, and ascribed the better result to the careful use of sterile techniques. During the present experiment, we did not work in a sterile environment, which might have had a detrimental effect on the embryonic survival of both the sham and the albumen-deprived eggs. However, Finkler et al.(9) also worked under sterile conditions, but obtained a low hatchability in the albumen-deprived group, but not in the sham group. In addition, they observed an altered metabolic rate, embryo dry and wet weight and organ weights on ED20 of the sham group compared with the untreated con-trol group(9). In the present study, the sham group also had a retarded growth, which was more pronounced for the males than for the females. By perforating the shell membranes in both the sham and the albumen-deprived group, it could be that the chalazae – a ropy structure of spirals from the yolk into the albumen at either end of the egg(28) – were damaged.
Age
ED18 Hatch Day 3 Day 7
18 S (au) 0·0 0·2 0·4 0·6 0·8 1·0 1·2 b a,b a a
Fig. 6. mRNA levels of 18S from embryonic day (ED) 18 until day 7 in females ( ) and males ( ). Values are means, with their standard errors represented by vertical bars (on ED18, n 12 – 13 per sex; at hatch, n 23 for the females and n 13 for the males; and on days 3 and 7, n 24 per sex).
a,b
Mean values with unlike letters were significantly different (P, 0·05). Age (P, 0·001) and sex (P¼ 0·014). au, Arbitrary units.
Age Age
ED18 Hatch Day 3 Day 7
Atrogin-1 (au) 0 2 4 6 8 10 12 14 16 Age
ED18 Hatch Day 3 Day 7
Atrogin-1 :18 S (au) 0 5 10 15 20 25 (A)
ED18 Hatch Day 3 Day 7
Atrogin-1 (au) 0 2 4 6 8 10 12 14 16 (C) (D) (B)
ED18 Hatch Day 3 Day 7 Age Atrogin-1 :18 S (au) 0 5 10 15 20 25
Fig. 7. Expression of atrogin-1 from embryonic day (ED) 18 until day 7 in (A) females and (B) males of the albumen-deprived ( ), control ( ) and sham ( ) groups. Relative expression of atrogin-1:18S from ED 18 until day 7 in (C) females and (D) males of the albumen-deprived, control and sham groups. Values are means, with their standard errors represented by vertical bars (on ED18, n 4 – 5 per treatment and per sex. At hatch, n 8, 6 and 9 for the females of the albumen-deprived, control and sham groups, respectively; and n 4, 6 and 3 for the males of the albumen-albumen-deprived, control and sham groups, respectively. On days 3 and 7, n 8 per treatment and per sex). au, Arbitrary units.
British
Journal
of
As the chalazae serve to stabilise the position of the yolk, keep-ing it at the geometric centre of the egg, it could be that durkeep-ing turning, yolk – ovum security was affected. As the position of the yolk was disturbed by the damaged chalazae, the formation of other compartments, such as the albumen sac, might be dis-turbed, preventing movement of proteins from the albumen into the amnion through the sero-amniotic connection. There-fore, not only albumen removal, but also making a hole at the sharp end of the egg, might have affected the embryonic development.
As no differences were found in plasma glucose and TAG concentrations, no further analysis on carbohydrate or lipid metabolism was performed. Plasma uric acid concentration was remarkably high in the albumen-deprived group com-pared with the other groups on ED18, indicating a higher cat-abolism of amino acids in the liver, used for gluconeogenesis. These amino acids are derived from protein coming either from consumed amniotic fluid or from tissue protein reserves(29,30). The latter origin is more probable under these experimental conditions, as one would expect less amniotic fluid in albumen-deprived embryos, as albumen proteins are transferred to the amniotic fluid via the sero-amniotic connec-tion(27). At hatch, the plasma uric acid concentration was the lowest in the albumen-deprived group, which is also observed in chickens on a low-protein pre-starter diet(31), a diet pro-vided from day 7(32,33) or day 14 onwards(34,35). This low plasma uric acid concentration, together with a lower amino acid concentration at hatch in the albumen-deficient chicks, suggests an altered protein metabolism. In particular, the lower amino acid concentration might indicate that fewer
building blocks are available for protein synthesis and chick growth. These findings corroborate with the study of Muramatsu et al.(12)in which it was shown that the removal of albumen before incubation reduced whole-body protein synthesis in the embryo on the 12th day of incubation. Such a reduction in protein synthesis induced by albumen removal may not be related to a lower capacity for protein synthesis, which was not altered in the whole body(12), as in the breast
muscle (present study), as no difference in ribosomal capacity in breast muscle tissue was observed. In the present experimen-tal conditions, it can also be assumed that translation initiation was not altered by the removal of albumen before incubation. The amino acid-sensitive mammalian target of rapamycin sig-nalling pathway controls mRNA translation into proteins by phosphorylation of S6K1, S6 and 4E-BP1. Here, the protein con-tent and the level of phosphorylation of these proteins that play a critical role in protein translation (i.e. S6K1, S6 and 4E-BP1) were unaffected in the breast muscle. This corresponds with a rat study, where mothers were food restricted and the pro-geny had unaltered S6K1 and p-S6K1 in muscle(36). Postnatally, however, it was shown that the protein content in a diet given to broilers during the first 5 d after hatch affected S6K1 and S6 activation in the breast muscle of 3-d-old chicks(37).
In the present study, a potential regulation of the two atro-phy-related genes atrogin-1 and MuRF1 was explored. So far, little is known on their regulation during the perinatal period. Interestingly, at hatch, an over-expression of these atrophy-related genes was observed with respect to ED18. This appears consistent with the decrease in relative breast devel-opment during the late embryonic period(38). From hatch
ED18 Hatch Day 3 Day 7
MuRF1 (au) 0·0 0·2 0·4 0·6 0·8 1·0 1·2 1·4 1·6 1·8 2·0 a b a,b Age a a,b b Age
ED18 Hatch Day 3 Day 7
MuRF1 :18S (au) 0·0 0·5 1·0 1·5 2·0 2·5 a b a,b Age MuRF1 :18S (au) 0·0 0·5 1·0 1·5 2·0 2·5 (A) (D) (C)
ED18 Hatch Day 3 Day 7
MuRF1 (au) 0·0 0·2 0·4 0·6 0·8 1·0 1·2 1·4 1·6 1·8 2·0 Age (B)
ED18 Hatch Day 3 Day 7
Fig. 8. Expression of muscle ring finger-1 (MuRF1) from embryonic day (ED) 18 until day 7 in (A) females and (B) males of the albumen-deprived ( ), control ( ) and sham ( ) groups. Relative expression of MuRF1:18S from ED 18 until day 7 in (C) females and (D) males of the albumen-deprived, control and sham groups. Values are means, with their standard errors represented by vertical bars (on ED18, n 4 – 5 per treatment and per sex. At hatch, n 8, 6 and 9 for the females of the albumen-deprived, control and sham groups, respectively, and n 4, 6 and 3 for the males of the albumen-deprived, control and sham groups, respectively. On days 3 and 7, n 8 per treatment and per sex).a,bMean values with unlike letters were significantly different (P, 0·05). au, Arbitrary units.
British
Journal
of
onwards, MuRF1 levels did not change with age, while the expression of atrogin-1 decreased with age until day 7. From days 7 to 14, a decrease in the expression of atrogin-1 in skeletal muscle of broiler chicks has also been reported(39). The level of expression of the two atrogenes was not drastically increased by the removal of albumen in the majority of cases. On ED18, no treatment-related differences were observed, while at that time point, largely higher plasma uric acid concentrations in the albumen-deprived group could mean altered protein metabolism. The notable exception was the higher expression of MuRF1 in albumen-deprived chicks at hatch, when chicks did not have access to food yet and plasma amino acid concentrations were lower compared with the control and the sham groups. It should also be noted that an up-regulated expression of atrogin-1 was seen at this time point in the male protein-deprived chicks (by five times), whereas the effect of treatment was not observed in the females. There is evidence that MuRF1 and atrogin-1 do not respond necessarily similarly on a certain treatment(40 – 44). In the same way, the present study shows that the response to treatment might also be sex specific, as atrogin-1 was increased in males but not in females due to albumen depri-vation. However, maybe on the basis that atrogin-1 seems to represent as a relatively poor index of muscle proteolysis, con-versely to MuRF1, which is clearly involved in the degradation of myofibrillar proteins(45), the present findings suggest that muscle proteolysis is transiently increased by the removal of albumen before the start of embryonic development.
In conclusion, the present study shows that the removal of albumen from eggs can offer an interesting model to study the direct effect of protein availability during embryonic develop-ment on postnatal growth and metabolism. The removal of albumen before the start of incubation clearly affected postnatal growth until day 7. Changes in plasma uric acid and amino acid levels on ED18 and at hatch in the albumen-deprived group indicate an altered protein metabolism. The present results demonstrate that the expression of genes related to protein degradation (atrogin-1 and, especially, MuRF1) was stimulated by protein malnutrition at hatch, while no evidence was found for altered protein synthesis capacity and translational efficiency.
Acknowledgements
N. E. was supported by the Fund for Scientific Research Flan-ders (FWO-Vlaanderen). H. W. was funded by a PhD grant from the Institute for the Promotion of Innovation Through Science and Technology in Flanders (IWT-Vlaanderen). N. E., E. D. and J. B. contributed to the conception and design of the study. S. M.-C. assisted with the Western blotting. N. E. col-lected and analysed all the data. H. W., H. H., Z. S. and Z. A. assisted with the animal experiment. N. E., S. M.-C. and S. T. were responsible for the final interpretation of the data. All authors agreed with the final format. We thank all the authors for practical and scientific assistance, and Sabine Crochet and Estelle Cailleau-Audouin (INRA) for their technical assistance. The authors state that there are no conflicts of interest.
References
1. Carey C, Rahn H & Parisi P (1980) Calories, water, lipid and
yolk in avian eggs. Condor 82, 335 – 343.
2. Romanoff AL (1960) The Avian Embryo. New York, NY: The
Macmillan Company.
3. Ferrari RP, Martinelli R & Saino N (2006) Differential effects
of egg albumen content on barn swallow nestlings in relation to hatch order. J Evol Biol 19, 981 – 993.
4. Bonisoli-Alquati A, Martinelli R, Rubolini D, et al. (2008)
Sex-specific effects of albumen removal and nest environment manipulation on barn swallow nestlings. Ecology 89, 2315 – 2324.
5. Bonisoli-Alquati A, Rubolini D, Romano M, et al. (2007)
Effects of egg albumen removal on yellow-legged gull chick phenotype. Funct Ecol 21, 310 – 316.
6. Hill WL (1993) Importance of prenatal nutrition to the
devel-opment of a precocial chick. Dev Psychobiol 26, 237 – 249.
7. Rao K, Xie J, Yang X, et al. (2009) Maternal low-protein diet
programmes offspring growth in association with alterations in yolk leptin deposition and gene expression in yolk-sac membrane, hypothalamus and muscle of developing Lang-shan chicken embryos. Br J Nutr 102, 848 – 857.
8. Deeming DC (1989) Importance of sub-embryonic fluid and
albumen in the embryo’s response to turning of the egg during incubation. Br Poult Sci 30, 591 – 606.
9. Finkler MS, Van Orman JB & Sotherland PR (1998)
Exper-imental manipulation of egg quality in chickens: influence of albumen and yolk on the size and body composition of near-term embryos in a precocial bird. J Comp Physiol B 168, 17 – 24.
10. Ruijtenbeek K, Kessels LCGA, De Mey JGR, et al. (2003)
Chronic moderate hypoxia and protein malnutrition both induce growth retardation, but have distinct effects on arter-ial endothelium-dependent reactivity in the chicken embryo. Pediatr Res 53, 573 – 579.
11. Miller SL, Green LR, Peebles DM, et al. (2002) Effects of
chronic hypoxia and protein malnutrition on growth in the developing chick. Am J Obstet Gynecol 186, 261 – 267.
12. Muramatsu T, Hiramoto K, Koshi N, et al. (1990) Importance
of albumen content in whole-body protein synthesis of the chicken embryo during incubation. Br Poult Sci 31, 101 – 106.
13. Meijer AJ & Dubbelhuis P (2004) Amino acid signalling and
the integration of metabolism. Biochem Biophys Res
Commun 313, 397 – 403.
14. Tesseraud S, Abbas M, Duchene S, et al. (2006) Mechanisms
involved in the nutritional regulation of mRNA translation: features of avian model. Nutr Res Rev 19, 104 – 116.
15. Bodine SC, Latres E, Baumhueter S, et al. (2001)
Identifi-cation of ubiquitin ligases required for skeletal muscle atro-phy. Science 294, 1704 – 1708.
16. Gomes MD, Lecker SH, Jagoe RT, et al. (2001) Atrogin-1, a
muscle-specific F-box protein highly expressed during muscle atrophy. Proc Natl Acad U S A 98, 14440 – 14445.
17. Dupont J, Tesseraud S, Derouet M, et al. (2008) Insulin
immuno-neutralization in chicken: effects on insulin signal-ing and gene expression in liver and muscle. J Endocrinol 19, 531 – 542.
18. Nakashima K, Yakabe Y, Yamazaki M, et al. (2006) Effects of
fasting and refeeding on expression of atrogin-1 and Akt/ FOXO signaling pathway in skeletal muscle of chicks. Biosci Biotechnol Biochem 70, 2775 – 2778.
19. Nakashima K, Yakabe Y, Ishida A, et al. (2008) Effects of
orally administered glycine on myofibrillar proteolysis and
British
Journal
of
expression of proteolytic-related genes of skeletal muscle in chicks. Amino Acids 35, 451 – 456.
20. Tesseraud S, Bouvarel I, Collin A, et al. (2009) Daily
vari-ations in dietary lysine content alter the expression of genes related to proteolysis in chicken pectoralis major muscle. J Nutr 139, 38 – 43.
21. Clinton M, Haines L, Belloir B, et al. (2001) Sexing chick
embryos: a rapid and simple method. Br Poult Sci 42, 134 – 138.
22. Tesseraud S, Peresson R & Chagneau AM (1996) Age related
changes of protein turnover in specific tissues of the chick. Poult Sci 75, 627 – 631.
23. Munro HN & Fleck A (1969) Analysis of tissues and body
fluids for nitrogenous constituents. In Mammalian Protein Metabolism, vol. III, pp. 424 – 525 [HN Munro, editor]. New York, NY: Academic Press.
24. Millward DJ & Waterlow JC (1978) Effect of nutrition on
pro-tein turnover in skeletal muscle. Fed Proc 37, 2283 – 2290.
25. Ducheˆne S, Me´tayer S, Audouin E, et al. (2008) Refeeding
and insulin activate the AKT/p70S6 kinase pathway without affecting IRS1 tyrosine phosphorylation in chicken muscle. Domest Anim Endocrinol 34, 1 – 13.
26. Me´tayer-Coustard S, Mameri H, Seiliez, et al. (2010)
Methion-ine deprivation regulates the S6K1 pathway and protein syn-thesis in avian QM7 myoblasts without activating the GCN2/ eIF2a cascade. J Nutr 140, 1539 – 1545.
27. Deeming DC (2002) Avian Incubation. Behaviour,
Environ-ment, and Evolution. Lincoln: Edition Oxford University Press.
28. Romanoff AL & Romanoff AJ (1949) The Avian Egg. New
York, NY: John Wiley, Sons, Inc.
29. Keirs RW, Peebles ED, Hubbard SA, et al. (2002) Effects of
supportative gluconeogenic substrates on early performance of broilers under adequate brooding conditions. J Appl Poult Res 11, 367 – 372.
30. Moran ET Jr (2007) Nutrition of the developing embryo and
hatchling. Poult Sci 86, 1043 – 1049.
31. Swennen Q, Everaert N, Debonne M, et al. (2009) Effect of
macronutrient ratio of the pre-starter diet on broiler perform-ance and intermediary metabolism. J Anim Physiol Anim Nutr (Berl) 94, 375 – 384.
32. Malheiros RD, Moraes VMB, Collin A, et al. (2003) Dietary
macronutrients, endocrine functioning and intermediary metabolism in broiler chickens. Pairwise distributions between protein, fat and carbohydrate. Nutr Res 23, 567 – 578.
33. Swennen Q, Janssens GPJ, Millet S, et al. (2005) Effects of
sub-stitution between fat and protein on food intake and its regu-latory mechanisms in broiler chickens: endocrine functioning and intermediary metabolism. Poult Sci 84, 1051 – 1057.
34. Collin A, Malheiros RD, Moraes VMB, et al. (2003) Effects of
dietary macronutrient content on energy metabolism and uncoupling protein mRNA expression in broiler chickens. Br J Nutr 90, 261 – 269.
35. Swennen Q, Janssens GPJ, Collin A, et al. (2006)
Diet-induced thermogenesis and glucose oxidation in broiler chickens: influence of genotype and diet composition. Poult Sci 85, 731 – 742.
36. Gavete ML, Martin MA, Alvarez C, et al. (2005) Maternal food
restriction enhances insulin-induced GLUT-4 translocation and insulin signaling pathway in skeletal muscle from suck-ling rats. Endocrinology 146, 3368 – 3378.
37. Everaert N, Swennen Q, Coustard SM, et al. (2010) The effect
of the protein level in a pre-starter diet on the post-hatch performance and activation of ribosomal protein S6 kinase in muscle of neonatal broilers. Br J Nutr 103, 206 – 211.
38. Guernec A, Berri C, Chevalier B, et al. (2003) Muscle
devel-opment, insulin-like growth factor-I and myostatin mRNA levels in chickens selected for increased breast muscle yield. Growth Horm IGF Res 13, 8 – 18.
39. Nakashima K, Ishida A & Katsumata M (2009) Comparison of
proteolytic-related gene expression in the skeletal muscles of layer and broiler chickens. Biosci Biotechnol Biochem 73, 1869 – 1871.
40. Frost RA, Nystrom GJ, Jefferson LS, et al. (2007) Hormone,
cytokine, and nutritional regulation of sepsis-induced increases in atrogin-1 and MuRF1 in skeletal muscle. Am J Physiol Endocrinol Metab 292, E501 – E512.
41. Sacheck JM, Ohtsuka A, McLary SC, et al. (2004) IGF-I
stimu-lates growth by suppressing protein breakdown and expression of atrophy-related ubiquitin ligases, atrogin-1 and MuRF1. Am J Physiol Endocrinol Metab 287, E591 – E601.
42. Cleveland BM & Weber GM (2010) Effects of insulin-like
growth factor-I, insulin, and leucin on protein turnover and ubiquitin ligase expression in rainbow trout primary myo-cytes. Am J Physiol Regul Integr Comp Physiol 298, R341 – R350.
43. Bower NI, de la Serrana DG & Johnston IA (2010)
Character-isation and differential regulation of MAFbx/Atrogin-1 alpha and beta transcripts in skeletal muscle if Atlantic salmon (Salmo salar). Biochem Biophys Res Commun 396, 265 – 271.
44. Herningtyas EH, Okimura Y, Handayaningsih AE, et al.
(2008) Branched-chain amino acids and arginine suppress MAFbx/atrogin-1 mRNA expression via mTOR pathway in C2C12 cell line. Biochim Biophys Acta 1780, 1115 – 1120.
45. Attaix D & Baracos VE (2010) MAFbx/Atrogin-1 expression is
a poor index of muscle proteolysis. Curr Opin Clin Nutr Metab Care 13, 223 – 224.