arXiv:1307.6532v2 [astro-ph.EP] 1 Oct 2013
October 3, 2013
Discovery of WASP-65b and WASP-75b:
Two Hot Jupiters Without Highly Inflated Radii
Y. G ´omez Maqueo Chew1
,2
,3, F. Faedi1, D. Pollacco1, D. J. A. Brown4, A. P. Doyle5, A. Collier Cameron4, M.
Gillon7, M. Lendl6, B. Smalley5, A. H. M. J. Triaud6
,8, R. G. West1, P. J. Wheatley1, R. Busuttil14, C. Liebig4, D. R.
Anderson5, D. J. Armstrong1, S. C. C. Barros9, J. Bento1
,10, J. Bochinski14, V. Burwitz15, L. Delrez7, B. Enoch4, A.
Fumel7, C. A. Haswell14, G. H´ebrard11
,12, C. Hellier5, S. Holmes14, E. Jehin7, U. Kolb14, P. F. L. Maxted5, J.
McCormac16
,1, G. R. M. Miller4, A. J. Norton14, F. Pepe6, D. Queloz6
,17, J. Rodr´ıguez18, D. S´egransan6, I.
Skillen16, K. G. Stassun2
,19, S. Udry6, and C. Watson20
1 Department of Physics, University of Warwick, Coventry CV4 7AL, UK; e-mail: [email protected] 2 Physics and Astronomy Department, Vanderbilt University, Nashville, Tennessee 37235, USA
3 Centro de Radioastronom´ıa y Astrof´ısica, UNAM, Apartado Postal 3-72, 58089 Morelia, Michoac´an, M´exico 4 School of Physics and Astronomy, University of St Andrews, St Andrews, Fife KY16 9SS, UK
5 Astrophysics Group, Keele University, Staffordshire, ST5 5BG, UK
6 Observatoire astronomique de l’Universit´e de Gen`eve, 51 ch. des Maillettes, 1290 Sauverny, Switzerland 7 Universit´e de Li`ege, All´ee du 6 aoˆut 17, Sart Tilman, Li`ege 1, Belgium
8 Department of Physics, and Kavli Institute for Astrophysics and Space Research, Massachusetts Institute of Technology, Cambridge, MA 02139, USA
9 Aix Marseille Universit´e, CNRS, LAM (Laboratoire d’Astrophysique de Marseille) UMR 7326, 13388, Marseille, France 10 Department of Physics and Astronomy, Macquarie University, NSW 2109, Australia
11 Institut d’Astrophysique de Paris, UMR7095 CNRS, Universit´e Pierre & Marie Curie, France 12 Observatoire de Haute-Provence, CNRS/OAMP, 04870 St Michel l’Observatoire, France 13 Department of Physics and Astronomy, University of Leicester, Leicester, LE1 7RH, UK 14 Department of Physical Sciences, The Open University, Milton Keynes, MK7 6AA, UK
15 Max Planck Institut f¨ur Extraterrestrische Physik, Giessenbachstrasse 1, 85748 Garching, Germany 16 Isaac Newton Group of Telescopes, Apartado de Correos 321, E-38700 Santa Cruz de Palma, Spain 17 Department of Physics, University of Cambridge, J J Thomson Av, Cambridge, CB3 0HE, UK 18 Observatori Astron`omic de Mallorca, Cam´ı de l’Observatori s/n 07144 Costitx, Mallorca, Spain 19 Department of Physics, Fisk University, Nashville, Tennessee 37208, USA
20 Astrophysics Research Centre, Queen’s University Belfast, University Road, Belfast BT7 1NN, UK Received 18 July 2013; accepted 27 September 2013
ABSTRACT
We report the discovery of two transiting hot Jupiters, WASP-65b (Mpl= 1.55 ± 0.16 MJ; Rpl= 1.11 ± 0.06 RJ), and WASP-75b (Mpl= 1.07 ± 0.05 MJ; Rpl= 1.27 ± 0.05 RJ). They orbit their host star every ∼2.311, and ∼2.484 days, respectively. The planet host WASP-65 is a G6 star (Teff= 5600 K, [Fe/H] = −0.07 ± 0.07, age & 8 Gyr); WASP-75 is an F9 star (Teff= 6100 K, [Fe/H] = 0.07 ± 0.09, age ∼ 3 Gyr). WASP-65b is one of the densest known exoplanets in the mass range 0.1 and 2.0 MJ(ρpl= 1.13 ± 0.08 ρJ), a mass range where a large fraction of planets are found to be inflated with respect to theoretical planet models. WASP-65b is one of only a handful of planets with masses of ∼1.5 MJ, a mass regime surprisingly underrepresented among the currently known hot Jupiters. The radius of WASP-75b is slightly inflated (.10%) as compared to theoretical planet models with no core, and has a density similar to that of Saturn (ρpl= 0.52 ± 0.06 ρJ).
Key words.planetary systems – stars: individual: (WASP-65, WASP-75) – techniques: radial velocity, photometry
1. Introduction
Since the discovery of the first extrasolar planet around a main-sequence star, 51 Peg (Mayor & Queloz 1995), our un-derstanding of planetary systems has dramatically evolved. Planetary science, which was previously based solely on our own Solar System, must be able to explain the observed di-versity in physical properties and trends in the known exo-planet population (e.g., Baraffe et al. 2010; Cameron 2011). An exceptionally valuable subset of the known extrasolar plan-ets are those that transit the disc of their host star. To date,
there are over 300 confirmed transiting exoplanets in the lit-erature1. Most of these discoveries have been the product of
ground-based surveys, of which the Wide Angle Search for Planets (WASP; Pollacco et al. 2006) has been the most suc-cessful, along with the HATNet Project (Bakos et al. 2004), OGLE-III (Udalski et al. 2002), TrES (Alonso et al. 2004), XO Project (McCullough et al. 2005), and KELT (Pepper et al. 2007). The space missions CoRoT (Baglin et al. 2006), and Kepler (Borucki et al. 2010) have also significantly increased
the number of discovered transiting planetary systems, and have been able to find much smaller planets than those that have been discovered from the ground, as well as multi-planetary and cir-cumbinary transiting systems.
With knowledge of the physical properties of the stellar host, the transisting system’s particular orbital geometry allows us to measure both the actual mass (i.e., Mpl instead of Mplsin i) and the radius of the transiting planet (e.g., Charbonneau et al.
2000). The wide range of observed planetary radii and, in par-ticular, the large fraction of close-in Jupiter-mass planets with anomalously bloated radii (e.g., Fortney & Nettelmann 2010; Leconte et al. 2010; Laughlin et al. 2011) challenge planetary structure models. Transiting planets allow us to probe the planetary structure by inferring the bulk composition of the planet from its mean density. For example, among the most bloated planets, WASP-17b (Anderson et al. 2010), and HAT-P-32b (Hartman et al. 2011) have mean planet densities ρpl of
0.06, and 0.11 ρJ, respectively, that are not able to be
re-produced with standard core-less planet models which predict the largest planets for a given mass (e.g., Baraffe et al. 2008; Fortney et al. 2007). Thus, planetary inflation mechanisms, such as stellar irradiation (Guillot et al. 1996), atmospheric circula-tion (e.g., Showman & Guillot 2002; Guillot et al. 2006), tidal effects (e.g., Bodenheimer et al. 2000; Jackson et al. 2008), en-hanced atmospheric opacities (Burrows et al. 2007), and ohmic heating (Batygin & Stevenson 2010; Wu & Lithwick 2012) have been proposed to explain these anomalously large radii (see also Baraffe et al. 2010). However, a single mechanism has not been able to explain the entire range of observed radii, and it is possi-ble that a combination of them come into play, with some being more effective than others in differing environments/conditions. Thus, it is paramount to expand the sample of well-characterized transiting planets in order to understand the physical and envi-ronmental factors that determine the surprising diversity in plan-etary radii and orbits that have been thus far discovered.
In this paper, we present two newly identified transiting planets in the WASP Survey: 1SWASP J085317.82+083122.8, hereafter WASP-65; and 1SWASP J224932.56-104031.8, here-after WASP-75. The WASP discovery photometry is described in §2.1. Section 2.2 describes the spectroscopic follow-up ob-servations that are used to determine the radial velocities of the planet hosts and the spectroscopically determined stellar param-eters. The high-cadence, follow-up photometry, detailed in §2.3, includes data from four different facilities. We derive the stellar physical properties in §3.1 and §3.2, and the planetary proper-ties via the simultaneous modelling of the radial velociproper-ties and the light curves, and the use of theoretical isochrones in §3.3. Finally, in §4, we discuss the implications of these new discov-eries in the context of the known planetary population.
2. Observations
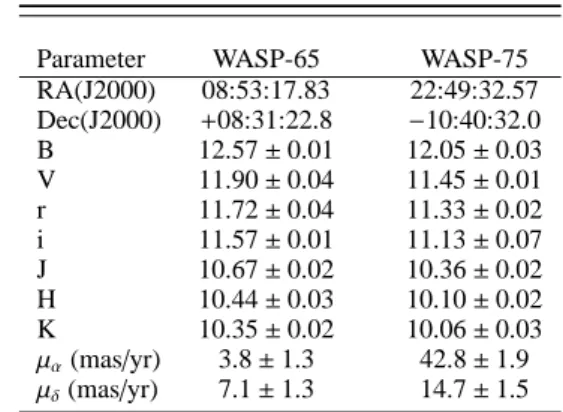
WASP-65 and WASP-75 have been identified in several all-sky catalogues which provide broad-band optical and infrared photometry, as well as proper motion information. Coordinates, broad-band magnitudes and proper motion of the stars are taken from the Fourth U.S Naval Observatory CCD Astrograph Catalog (UCAC4; Zacharias et al. 2012), and are given in Table 1.
2.1. WASP Observations
The WASP North and South telescopes are located in La Palma (ING - Canaries Islands, Spain) and Sutherland (SAAO - South
Table 1. Photometric and astrometric properties of the two stars
WASP-65 and WASP-75
Parameter WASP-65 WASP-75
RA(J2000) 08:53:17.83 22:49:32.57 Dec(J2000) +08:31:22.8 −10:40:32.0 B 12.57 ± 0.01 12.05 ± 0.03 V 11.90 ± 0.04 11.45 ± 0.01 r 11.72 ± 0.04 11.33 ± 0.02 i 11.57 ± 0.01 11.13 ± 0.07 J 10.67 ± 0.02 10.36 ± 0.02 H 10.44 ± 0.03 10.10 ± 0.02 K 10.35 ± 0.02 10.06 ± 0.03 µα(mas/yr) 3.8 ± 1.3 42.8 ± 1.9 µδ(mas/yr) 7.1 ± 1.3 14.7 ± 1.5
The broad-band magnitudes and proper motion are obtained from the UCAC4 catalogue.
Africa), respectively. Each telescope consists of 8 Canon 200mm f/1.8 focal lenses coupled to e2v 2048×2048 pixel CCDs, which yield a field of view of 7.8 × 7.8 square degrees with a corre-sponding pixel scale of 13.′′7 (Pollacco et al. 2006).
WASP-65 and WASP-75 (V = 11.90 and 11.45 mag, re-spectively) are located in an equatorial region of sky that is monitored by both WASP instruments. The WASP observations have an exposure time of 30 seconds, and a typical cadence of 8 min. All WASP data for the two newly discovered plan-ets were processed with the custom-built reduction pipeline de-scribed in Pollacco et al. (2006). The resulting light curves were analysed using our implementation of the Box Least-Squares and SysRem detrending algorithms (see Collier Cameron et al. 2006; Kov´acs et al. 2002; Tamuz et al. 2005) to search for sig-natures of planetary transits. Once the targets were identified as planet candidates a series of multi-season, multi-camera analy-ses were performed to strengthen the candidate detection. In ad-dition, different de-trending algorithms (e.g., Kov´acs et al. 2005) were used on the single season and multi-season light curves to confirm the transit signal and the physical parameters of the planet candidate. These additional tests allow a more thorough analysis of the stellar and planetary parameters derived solely from the WASP data and publicly available catalogues (e.g., UCAC4) thus helping in the identification of the best candidates, as well as to reject possible spurious detections.
WASP-65 was first observed on 2009 January 14, and
con-tinued to be monitored over the following observing seasons up to 2011 April 24 with the WASP North facility. This resulted in a total of 18922 photometric points. The WASP data shows the periodic dip characteristic of a transiting planetary signal with a period of P = 2.31 days, a transit duration of T14 ∼ 2.6 h,
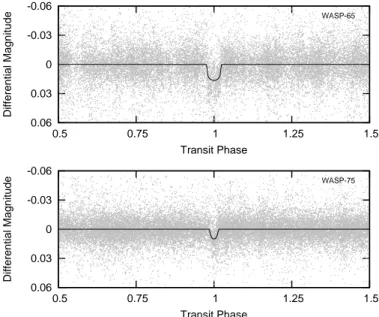
and a transit depth of ∼11 mmag. The top panel of Fig. 1 shows the discovery WASP photometry phase-folded over the period derived in §3.3 superimposed on the model light curve.
WASP-75 was observed with both the WASP telescopes
from 2008 June 13 to 2010 November 11. The WASP light curve is comprised of 23751 photometric data points. The WASP light curve is shown in Fig. 1 (bottom panel) folded over the identified transit period of P = 2.48 days, and presents a transit depth of ∼ 10 mmag, and a transit duration of 1.91 h.
-0.06 -0.03 0 0.03 0.06 0.5 0.75 1 1.25 1.5 Differential Magnitude Transit Phase WASP-65 -0.06 -0.03 0 0.03 0.06 0.5 0.75 1 1.25 1.5 Differential Magnitude Transit Phase WASP-75
Fig. 1. Discovery WASP Light Curves. Upper panel: WASP
transit light curve of WASP-65b, phase folded on the ephemeris given in Table 7. The black, solid line is the best-fit transit model, as described in §3.3. Lower panel: Same as top panel for WASP-75b light curve.
2.2. Spectroscopic Follow-up Observations
WASP-65 and WASP-75 were observed with the CORALIE spectrograph mounted on the 1.2m Euler Swiss telescope at La Silla, Chile (Baranne et al. 1996; Queloz et al. 2000; Pepe et al. 2002). The data were processed with the CORALIE standard data reduction pipeline. The radial velocity uncertainties were derived from the photon noise. All spectra were single-lined. For each planetary system the radial velocities of the host star were computed from a weighted cross-correlation of each spec-trum with a numerical mask of spectral type G2, as described in Baranne et al. (1996) and Pepe et al. (2002). To test for possi-ble false-positive scenarios, we performed the cross-correlation with masks of different stellar spectral types (i.e., G2 and K5) obtaining for each mask similar radial velocity variations.
We present in Tables 2 and 3 the spectroscopic measure-ments of WASP-65 and WASP-75. Each table contains: the Barycentric Julian Date (BJDUTC−2 450 000.0), the stellar
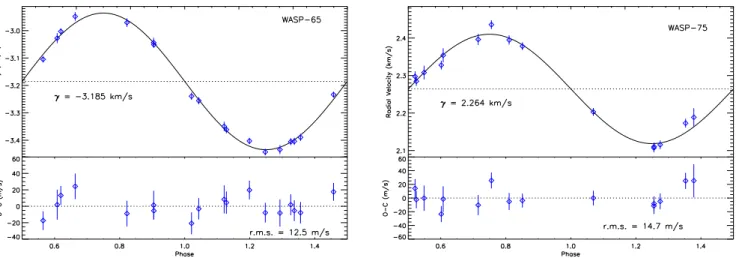
ra-dial velocity (RV) measurements (km s−1), the RV uncertain-ties (km s−1), and the line bisector span measurements (Vspan; km s−1) as defined by Toner & Gray (1988) and applied to the cross-correlation function as per Queloz et al. (2001). The RV residuals (in units of m s−1) to the best-fit Keplerian model are found in the last column of Tables 2 and 3; the residuals are calculated to have r.m.s. = 12.5 m s−1for WASP-65, and r.m.s. = 14.7 m s−1for WASP-75. Figure 2 shows the measured radial ve-locities and the residuals to the fit folded on the orbital period de-rived from the simultaneous analysis of the RVs and light curves (see §3.3) for WASP-65 (left), and WASP-75 (right). Typical er-rors for the CORALIE RV measurements are 10–15 m s−1.
Furthermore, Figure 3 presents the line bisector variations as a function of time and of measured RV. The line bisector mea-surements are examined to discard any false-positive scenarios that would reproduce the radial velocity motion of the star mim-icking a planet signature that would induce a change in the line profile (e.g., Dall et al. 2006). Any asymmetries in spectral line profiles would be identified by the variation of the line bisector
Table 2. Radial Velocitiy Measurements of WASP-65
BJDUTC RV σRV Vspan O – C −2 450 000 (km s−1) (km s−1) (km s−1) (m s−1) 5683.53391 -3.403 0.011 -0.030 20 5696.53167 -2.971 0.016 -0.024 -9 5706.48433 -3.361 0.014 -0.033 4 5711.48759 -3.434 0.017 0.026 -8 5715.48188 -3.239 0.013 -0.046 -21 5721.46162 -3.028 0.018 0.024 2 5722.46766 -3.256 0.013 -0.021 -3 5724.45871 -3.044 0.018 0.005 1 5725.45819 -3.404 0.013 -0.045 -5 5894.84370 -3.003 0.012 -0.050 13 5917.83196 -3.105 0.011 -0.006 -17 5926.83061 -3.234 0.011 -0.028 18 5927.86471 -3.051 0.011 -0.004 -5 5928.83795 -3.405 0.013 -0.029 2 5958.70536 -3.443 0.012 0.007 -8 6000.56135 -3.389 0.013 -0.036 -8 6003.58262 -2.948 0.016 0.024 24 6004.64137 -3.350 0.017 -0.035 8
The columns are: the Barycentric Julian Date, the stellar RV measure-ments, the RV uncertainties, the line bisector span measuremeasure-ments, and the residuals.
Table 3. Radial Velocitiy Measurements of WASP-75
BJDUTC RV σRV Vspan O – C −2 450 000 (km s−1) (km s−1) (km s−1) (m s−1) 5538.59311 2.396 0.015 -0.009 -10 5795.80716 2.107 0.012 0.039 -11 5803.56482 2.189 0.024 0.005 25 5804.63835 2.395 0.012 0.035 -5 5809.70786 2.378 0.010 -0.043 -4 5810.76030 2.115 0.012 0.023 -5 5823.79344 2.298 0.014 -0.026 14 5830.58703 2.110 0.011 0.006 -8 5832.60740 2.203 0.011 -0.003 0 5833.73979 2.285 0.013 0.092 -2 5855.66998 2.173 0.012 0.029 25 5856.67102 2.436 0.012 0.020 26 5858.64072 2.308 0.018 0.044 0 5883.62851 2.354 0.019 -0.036 -1 5888.58231 2.328 0.012 0.018 -23 The columns are: the Barycentric Julian Date, the stellar RV measure-ments, the RV uncertainties, the line bisector span measuremeasure-ments, and the residuals.
span, and could result from unresolved binarity or from stellar activity. Such effects would cause the bisector spans to vary in phase with radial velocity. No significant correlation is observed between either radial velocity and the line bisector (with a corre-lation coefficient of 0.04 for WASP-65, and -0.07 for WASP-75), or the bisector and the time at which observations were taken (with a correlation coefficient of 4e-06 for WASP-65, and 6e-05 for WASP-75). This supports our conclusion that each signal originates from a planetary companion as opposed to a blended eclipsing binary system, or to stellar activity (e.g., Queloz et al. 2001).
Fig. 2. Upper panels: Phase folded radial velocity measurements of WASP-65 (left) and WASP-75 (right) obtained with the
CORALIE spectrograph. Superposed is the best-fit model RV curve with parameters from Table 7. The centre-of-mass velocity is marked by the horizontal, dotted line. Lower panels: Residuals from the radial velocity fit plotted against orbital phase; the dotted line in the lower panels marks zero. The residuals are in units of m s−1.
Fig. 3. Upper panels: We show the bisector span measurements of WASP-65 (left) and WASP-75 (right) as a function of radial
velocity. The horizontal, dotted line marks the mean line bisector span <Vspan>= −0.017 km s−1, and <Vspan>= 0.013 km s−1, respectively. Lower panels: The bisector span measurements as a function of time (BJDUTC– 2 450 000.0) for WASP-65 (left) and
WASP-75 (right). The bisector spans of both planet hosts are of the same order of magnitude as the errors in the radial velocity measurements, and show no significant variation nor correlation with radial velocity or time. This suggests that the radial velocity variations (with semi-amplitudes of K1= 0.249 ± 0.005 km s−1for WASP-65b, and K1= 0.146 ± 0.004 km s−1for WASP-75b) are
due to Doppler shifts of the stellar lines induced by a planetary companion rather than stellar profile variations due to stellar activity or a blended eclipsing binary.
2.3. Follow-Up Multi-band Photometry
In order to better constrain the systems’ parameters, high-cadence, high-precision time series photometry during the tran-sits of WASP-65b and WASP-75b were obtained. These follow-up light curves include data from four different telescopes (see below for details), and are summarized in Table 4. All photomet-ric data presented here are available electronically from CDS2. We show in Figures 4 and 5 the follow-up photometry for the transits of WASP-65b, and WASP-75b, respectively. In each plot we show the differential magnitude versus orbital phase, along 2 Tables 8–11 are only available in electronic form at the CDS via anonymous ftp to cdsarc.u-strasbg.fr (130.79.128.5) or via http://cdsweb.u-strasbg.fr/cgi-bin/qcat?J/A+A/
with the residual to the best-fit model (see §3.3). The data are phase folded on the ephemeris derived by our analysis of each individual object as given in Table 7.
2.3.1. TRAPPIST Observations
Both WASP systems were observed with TRAPPIST (TRAnsiting Planets and PlanetesImals Small Telescope; Gillon et al. 2011) located at ESO La Silla, Chile. Its thermoelectrically-cooled camera is equipped with a 2K×2K Fairchild 3041 CCD with a 22′×22′ field of view (i.e., 0.65′′/pixel). The observations were done using a readout mode of 2 × 2 MHz with 1 × 1 binning, resulting in a readout + overhead time of 6.1 s and a readout noise of 13.5 e−. A
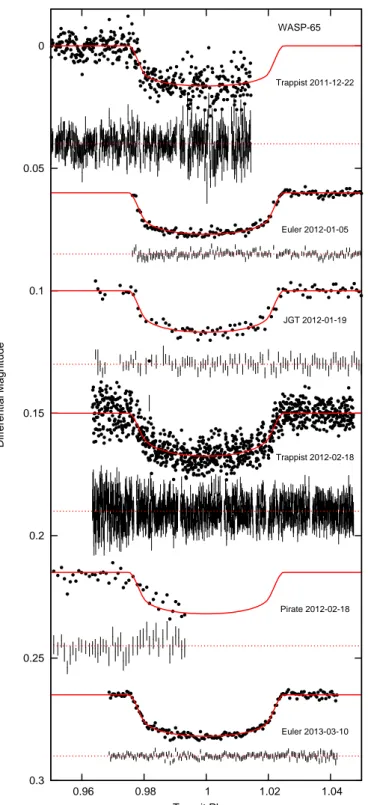
0 0.05 0.1 0.15 0.2 0.25 0.3 0.96 0.98 1 1.02 1.04 Differential Magnitude Transit Phase WASP-65 Trappist 2011-12-22 Euler 2012-01-05 JGT 2012-01-19 Trappist 2012-02-18 Pirate 2012-02-18 Euler 2013-03-10
Fig. 4. Follow-up, high-precision, time-series photometry of the
WASP-65b during the transit (see Table 4). The observations are shown as red points and are phase folded on the ephemeris shown in Table 7. The superimposed, solid, black line is our best-fit transit model (§3.3) using the formalism of Mandel & Agol (2002). The residuals from the fit and the individual data points photometric uncertainties are displayed directly under each light curve. The light curves and residuals are displaced from zero for clarity.
slight defocus was applied to the telescope to optimize the observation efficiency and to minimize pixel-to-pixel effects.
0 0.05 0.1 0.96 0.98 1 1.02 1.04 Differential Magnitude Transit Phase WASP-75 Trappist 2011-11-23 Trappist 2011-11-28 Euler 2012-08-28
Fig. 5. Follow-up, high signal-to-noise light curves of
WASP-75b during transit. Same as Fig. 4.
Table 4. Follow-Up Time-Series Transit Photometry
Planet Date Instrument Filter
WASP-65b
2011 12 22 TRAPPIST I + z
2012 01 05 EulerCam Gunn r
2012 01 19 JGT RC
2012 02 18 TRAPPIST blue blocking
2012 02 18 PIRATE R 2013 03 10 EulerCam Gunn r WASP-75b 2011 11 23 TRAPPIST I + z 2011 11 28 TRAPPIST I + z 2012 08 28 EulerCam Gunn r
The TRAPPIST facility is described in detail by Jehin et al. (2011) and Gillon et al. (2011). A standard pre-reduction (bias, dark, flatfield correction), was carried out and the stellar fluxes were extracted from the images using the IRAF/DAOPHOT aperture photometry software (Stetson 1987). After a careful selection of reference stars, differential photometry was then obtained.
The transit of WASP-65b was observed twice with TRAPPIST. One partial transit was observed on 2011 December 22 in the ‘I + z’ filter (that has a transmittance > 90% from 750 nm to beyond 1100 nm) with the observations starting about two hours before the transit’s ingress, and ending at sunrise af-ter mid-transit but before the start of the egress. As WASP-65 changed position in the night sky, the telescope had to undergo a “meridian flip” which caused the field of view to rotate and the stars to change pixel position. We have accounted for this in our light curve analysis by treating the data before the
“merid-ian flip” as independent from the data after the “merid“merid-ian flip” to allow for an offset. The exposure time of these data was 20 s per frame with an average FWHM of 4 pixels for the stel-lar sources. A full transit of WASP-65b was observed on 2012 February 18 with the blue-blocking filter (with a transmittance ¿90% above 500nm). The observations began more than 0.5 h before the ingress of the transit and ended over 1 h after egress. The exposure time per frame was 8.0 s with an average FWHM of 4.4 pixels. There was also a “meridian flip” during the obser-vations of this transit.
The WASP-75 system was also observed with TRAPPIST during the transit of the planet using the I+z filter. The first TRAPPIST light curve was acquired on 2011 November 23 spanning the full transit, including ∼0.5 h before the transit ingress and ∼1 h after egress. However, the last half hour of data was obtained with an airmass of more than 1.8. The ex-posure time per frame was 15 s, with an average FWHM of 4.5 pixels. WASP-75 was observed again with TRAPPIST on 2011 November 28, obtaining photometry of an almost full transit. The observations began shortly after ingress started and ended about 1 h after egress. The exposure time per frame was 20 s, with an average FWHM of 4.4 pixels.
2.3.2. EulerCam Observations
We observed two transits of WASP-65b and one transit of WASP-75b using an r’-Gunn filter with EulerCam which is mounted on the 1.2 m Euler-Swiss telescope at the La Silla Observatory in Chile. All images were corrected for bias and flat-field variations, and the light curves were obtained using dif-ferential aperture photometry. Lendl et al. (2012) describe in de-tail the EulerCam instrument, and the reduction procedures used. The first observations of WASP-65b captured an almost complete transit (starting shortly after the beginning of the ingress) on 2012 January 06 (UT), using fixed exposure times of 60 s. The second set of observations took place on 2013 March 11 (UT) covering a complete transit, and fixed exposure times of 70s were used. In both instances, the detector was read out through four ports in order to improve our efficiency, and the telescope was slightly defocussed to improve the PSF sampling. A full transit of WASP-75b was observed with EulerCam with the r’-Gunn filter on 2012 August 28 (UT). The observa-tions started about half an hour before the beginning of ingress, and ended about an hour after egress. A similar observing strat-egy was used as for the WASP-65b transits with the exposure time fixed at 60 s, with defocussing, and the detector readout through four ports.
2.3.3. JGT Observations
We observed the transit of WASP-65b across its host star with the 1-m James Gregory telescope (JGT) at the University of St Andrews Observatory in Scotland, UK. More de-tails of the telescope and instrument can be found in, e.g., Collier Cameron et al. (2010) and Hebrard et al. (2012). A full transit was observed on 2012 January 19. The JGT light curve is comprised of 99 photometric measurements made using an RC (Cousins) filter with an exposure time of 150s each. The pre-eclipse out-of-transit measurements and part of ingress were af-fected by clouds, but the full width of transit, including times of first and last contact, were detected. The stellar fluxes were ex-tracted from the flat-fielded CCD frames using the photometry routines in the Starlink PHOTOM package. The differential
pho-tometry was calculated using a single nearby comparison star, which was the only object brighter than the target in the 15’ field of view.
2.3.4. PIRATE Observations
The transit of WASP-65b was also observed on 2012 February 18 by the PIRATE Facility3 (PIRATE Mk II configuration)
lo-cated at the Observatori Astron `omic de Mallorca (for details see Holmes et al. 2011). The time series is composed of 120-sec exposures that captured nearly 6 hours of out-of-transit light curve (with the pier flip after about 2 hr), as well as the ingress. The conditions were good, giving a typical FWHM of 3.1′′. Additional out-of-transit and in-transit data were obtained with non-optimal weather conditions on 2012 January 19, 2012 March 02, and 2012 March 03 and were only used to constrain the ephemeris of the transit. All frames were taken with the Baader R filter; this has a performance similar to the Astrodon Sloan r′filter used by the APASS survey (Smith et al. 2010). The data sets were calibrated in the standard way using flat field, dark and bias frames. We constructed the light curves using the en-semble photometry pipeline described in Holmes et al. (2011). Pre- and post-pier flip branches were analysed separately.
3. Results
3.1. Spectroscopically-determined Stellar Properties
For both planets the same stellar spectral analysis has been per-formed by co-adding individual CORALIE spectra. The stan-dard pipeline reduction products were used in the analysis. The analysis was performed using the methods given in Gillon et al. (2009). The Hαline was used to determine the effective temper-ature (Teff). The surface gravity (log g) was determined from the
Ca i lines at 6122Å, 6162Å and 6439Å (Bruntt et al. 2010b), along with the Na i D and Mg i b lines. The parameters for WASP-65 and WASP-75 obtained from the spectral analysis are listed in Table 5.
The elemental abundances were determined from equivalent width measurements of several clean and unblended lines. A value for microturbulence (ξt) was determined from Fe i using
the method of Magain (1984). The quoted errors are estimated to include the uncertainties in Teff, log g and ξt, as well as the
scatter due to measurement (dependent on data quality), and atomic data uncertainties. The projected stellar rotation veloc-ity (v sin i⋆) was determined by fitting the profiles of several un-blended Fe i lines. For each system, the macroturbulence (vmac)
was assumed based on the calibration by Bruntt et al. (2010a). The telluric lines around 6300Å were used to determine the in-strumental FWHM. There are no emission peaks evident in the Ca ii H+K lines in the spectra of the two planet hosts. The pa-rameters obtained for each planet host from the spectroscopic analysis are discussed below:
WASP-65: A total of 10 individual CORALIE spectra of
WASP-65 were co-added to produce a single spectrum with a typical S/N of around 60:1. Our spectral analysis yields Teff =
5600±100 K, log g = 4.25±0.10 (cgs), and [Fe/H]= −0.07±0.07 dex, and a spectral type of G6V. Taking into account the instru-mental line profile (FWHM = 0.11 ± 0.01 Å) and the macro-turbulence (vmac = 2.0 ± 0.3 km s−1), the projected stellar
rota-tional velocity was determined to be v sin i⋆= 3.6 ± 0.5 km s−1. There is no significant detection of lithium in the spectra, with
Table 5. Stellar Properties of WASP-65, and WASP-75 from
Spectroscopic Analysis
Parameter WASP-65 WASP-75
Teff(K) 5600 ± 100 K 6100 ± 100 K log g 4.25 ± 0.1 4.5 ± 0.1 ξt(km s−1) 0.9 ± 0.1 1.3 ± 0.1 v sin i⋆(km s−1) 3.6 ± 0.5 4.3 ± 0.8 [Fe/H] −0.07 ± 0.07 0.07 ± 0.09 [Na/H] 0.08 ± 0.13 0.14 ± 0.05 [Mg/H] 0.07 ± 0.08 0.17 ± 0.15 [Si/H] 0.23 ± 0.06 0.10 ± 0.09 [Ca/H] 0.10 ± 0.15 0.11 ± 0.09 [Sc/H] 0.07 ± 0.10 0.19 ± 0.08 [Ti/H] 0.04 ± 0.07 0.10 ± 0.13 [V/H] 0.05 ± 0.11 0.13 ± 0.09 [Cr/H] 0.04 ± 0.13 0.10 ± 0.10 [Co/H] 0.14 ± 0.10 0.15 ± 0.10 [Ni/H] 0.05 ± 0.06 0.08 ± 0.10 log A(Li) <1.14 ± 0.10 2.52 ± 0.09 Sp. Type G6 F9 Distance (pc) 310 ± 50 260 ± 70
Note: Spectral Type estimated from Teffusing the table in Gray (2008).
an equivalent width upper limit of 12 mÅ, corresponding to an abundance upper limit of log A(Li) < 1.14 ± 0.10. This implies an age of at least several Gyr (Sestito & Randich 2005). The ro-tation rate (P = 17.9 ± 3.4 d) implied by the v sin i⋆gives a gy-rochronological age of ∼ 1.72+1.26
−0.76Gyr using the empirical rela-tionship of Barnes (2007). The latter of these age indicators sug-gests that WASP-65 is a younger version of our Sun. However, assuming a higher value for vmac, like that from the calibrations
of Valenti & Fischer (2005) or Gray (2008), v sin i⋆ would be lower and a longer rotation period would be derived implying an older age for the planet host. A better measure of the rotation period of WASP-65 would be from photometric rotational mod-ulation; none was observable in the WASP light curve, which was searched with a sine-wave fitting algorithm, described in Maxted et al. (2011). Moreover, given the lack of stellar activity (i.e., the absence of Ca ii H+K emission) and the comparison of the stellar properties with theoretical evolutionary models (see Table 6), WASP-65 seems to be older than our Sun (& 8 Gyr).
WASP-75: A total of 15 individual CORALIE spectra of
WASP-75 were co-added to produce a single spectrum with a typical S/N of around 100:1. The derived spectroscopic proper-ties of WASP-75 are Teff = 6100 ± 100 K, log g = 4.5 ± 0.1
(cgs), and [Fe/H]= 0.07 ± 0.09 dex, and a spectral type of F9V. Considering a macroturbulence (vmac = 3.5 ± 0.3 km s−1) and
an instrumental FWHM of 0.11 ± 0.01 Å, the best fitting value of v sin i⋆ = 4.3 ± 0.8 km s−1 was obtained. The lithium line strength log A(Li) = 2.52 ± 0.09 implies an age of approximately 2∼5 Gyr according to Sestito & Randich (2005). The rotation rate (P = 11.7±2.7 d) implied by the v sin i⋆gives a gyrochrono-logical age of ∼ 1.69+1.58
−0.87 Gyr using the Barnes (2007) rela-tion. Both the gyrochronological and the age derived from the Li abundance imply that WASP-75 is a relatively young system, which is consistent with the age derived from stellar evolution-ary tracks (∼3–4 Gyr; see Table 6).
3.2. Stellar Mass Determination
The absolute properties of the planet are well determined to the extent the stellar physical properties are accurate and
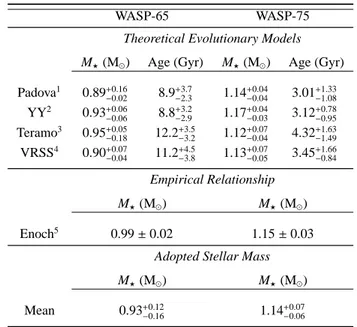
pre-Table 6. Stellar Masses and Ages for WASP-65 and WASP-75
WASP-65 WASP-75
Theoretical Evolutionary Models M⋆(M⊙) Age (Gyr) M⋆(M⊙) Age (Gyr)
Padova1 0.89+0.16 −0.02 8.9 +3.7 −2.3 1.14 +0.04 −0.04 3.01 +1.33 −1.08 YY2 0.93+0.06 −0.06 8.8 +3.2 −2.9 1.17 +0.04 −0.03 3.12 +0.78 −0.95 Teramo3 0.95+0.05 −0.18 12.2 +3.5 −3.2 1.12 +0.07 −0.04 4.32 +1.63 −1.49 VRSS4 0.90+0.07 −0.04 11.2 +4.5 −3.8 1.13 +0.07 −0.05 3.45 +1.66 −0.84 Empirical Relationship M⋆(M⊙) M⋆(M⊙) Enoch5 0.99 ± 0.02 1.15 ± 0.03
Adopted Stellar Mass
M⋆(M⊙) M⋆(M⊙)
Mean 0.93+0.12
−0.16 1.14
+0.07 −0.06
References. (1) Marigo et al. (2008); Girardi et al. (2010); (2) Demarque et al. (2004); (3) Pietrinferni et al. (2004); (4) VandenBerg et al. (2006); (5) Enoch et al. (2010).
cise. Thus, we have determined the stellar mass using four the-oretical evolutionary models and a stellar empirical calibration (Enoch et al. 2010; Torres et al. 2010), as described below. The mean of these five independent mass estimates is adopted for the rest of our analysis (see §3.3), and its uncertainty is given by the possible range of masses including the individual uncertainties. Table 6 summarizes the results from the interpolation of the four theoretical models, from the empirical relationship, and, lastly, the mean stellar mass adopted to derive the final orbital, stellar, and planetary properties.
The stellar mass is derived from the spectroscopically-determined stellar effective temperature and metallicity (§3.1), and the mean stellar density ρ⋆, directly determined from tran-sit light curves. Trantran-siting planets allow us to measure ρ⋆ in-dependently from the Teff determined from the spectrum
(as-suming Mpl ≪ M⋆; see also Seager & Mall´en-Ornelas 2003), as well as of theoretical stellar models (Sozzetti et al. 2007; Hebb et al. 2009, e.g.,). We measured the mean stellar density of both planet hosts via our Markov-Chain Monte Carlo (MCMC) analysis (see §3.3). In the case of the theoretical evolutionary models, the four sets of tracks used are: a) the Padova stel-lar models by Girardi et al. (2000), b) the Yonsei-Yale (YY) models by Demarque et al. (2004), c) the Teramo models of Pietrinferni et al. (2004), and d) the Victoria-Regina stellar mod-els (VRSS) of VandenBerg et al. (2006). The interpolation of the isochrones and mass tracks for the metallicity derived from the spectral analysis is done using a Delaunay triangulation (Delaunay 1934), as implemented by Bernal (1988) and devel-opped by P´al & Bakos (2006). The errors are derived using the error ellipse from Teffand ρ⋆−1/3, taking into account the range of values given by the 1−σ uncertainties, and the points at 45 de-grees between these on the error ellipse. Additionally, we have incorporated the uncertainty in the stellar mass due to the 1−σ error in [Fe/H]. The stellar mass is also derived from the empiri-cal empiri-calibration of Enoch et al. (2010) adapted for transiting plan-ets with measurable ρ⋆from the study by Torres et al. (2010) of eclipsing binary stars with masses and radii known to better than
3%. The uncertainty on the stellar mass derived from the em-pirical relationship results from our MCMC analysis (§3.3). The stellar masses derived for WASP-75 from the four sets of stel-lar evolution models (Table 6) agree very well with each other, and with the stellar mass from the Enoch calibration from our MCMC analysis, within their 1–σ uncertainties. In the case of WASP-65, the M⋆from the empirical Enoch relationship is con-sistent within 2–σ with the masses derived from the theoretical stellar tracks. For a more robust measurement of the stellar mass, we have calculated the mean of the stellar masses derived from the four theoretical models and the empirical Enoch calibration, which is used as a prior in our MCMC analysis below and is used in the determination of the planetary properties. The uncertainty in the adopted stellar masses are given by the 1−σ range for the individual derivations in order to account for all sources of error discussed above.
3.3. Planetary Physical Properties
The planetary properties were determined via an MCMC analysis which simultaneously models the WASP photom-etry, the follow-up, high-cadence photomphotom-etry, together with CORALIE radial velocity measurements, as described in de-tail by Collier Cameron et al. (2007) and Pollacco et al. (2008). The parameters used by the MCMC analysis are: the epoch of mid transit T0, the orbital period P, the fractional change of
flux proportional to the ratio of stellar to planet surface areas ∆F = R2
pl/R 2
⋆, the transit duration T14, the impact parameter
b, the radial velocity semi-amplitude K1, the stellar host mass
M⋆ calculated in §3.2, the Lagrangian elements √e cos ω and
√e sin ω (where e is the eccentricity and ω the longitude of
pe-riastron), and the systemic or centre-of-mass velocity γ. For the treatment of the stellar limb-darkening, the 4-coefficient model of Claret (2000, 2004) was adopted, using the corresponding tabulated coefficients for each passband, and the stellar spec-troscopic properties. In the case of the WASP photometry, the
R-band was used as an approximation. Similarly, the I and
V-bands were used for the TRAPPIST I+z and blue-blocking fil-ters, respectively. The sum of the χ2 for all input data curves with respect to the models was used as the goodness-of-fit statis-tic, and each light curve is weighted such that the reduced-χ2of the best-fit solution is ∼1.
An initial MCMC solution with a linear, long-term trend in the radial velocities was explored for both planetary systems by allowing the systemic velocity to change with time (i.e.,
dγ/dt , 0.). No significant variation of the systemic velocity
was found for either planetary system. Thus, the rest of the anal-yses are done assumming no long-term trend in the radial ve-locities (i.e., dγ/dt = 0.). For each planetary system, four dif-ferent sets of solutions were considered: (a) a circular solution assuming that the stellar host is on the main sequence, (b) a solu-tion with a free-floating eccentricity and the mass–radius main-sequence constraint, (c) a circular orbit without the mass–radius constraint, and (d) an orbit with eccentricity as a free parameter with no main-sequence constraint.
In the case of both planetary systems, when the eccentric-ity was left as a free paramenter (with and without the main-sequence constraint), it converged to a small, non-zero value (e < 0.02) for all solutions. To assess whether these small eccentricities are real, we performed the F-test proposed by Lucy & Sweeney (1971, see their Eq. 27). We find in all in-stances that the resulting eccentricity is spurious. The orbit could be truly eccentric to the resulting e, but the available
data are unable to differentiate between that and a circular or-bit. Furthermore, the longitude of periastron of these eccentric solutions is close to 90◦ or −90◦, which could also indicate a spurious eccentricity detection. Thus, we adopt circular orbits for both WASP-65b and WASP-75b.
Additionally, we assessed whether either planet host required the assumption of the star being on the main sequence. Typically this constraint is needed when the follow-up light curves do not include full transits or do not have the necessary preci-sion to well determine the transit duration, depth, and the sys-tem’s impact parameter. Both WASP-65 and WASP-75 have high-quality follow-up photometry of full transits. Comparing both sets of solutions with and without the mass-radius main-sequence assumption, the solutions with the main-main-sequence prior have higher χ2 values than those without. For both
plan-etary systems, both solutions with and without the mass–radius constraint are the same within their 1−σ uncertainties; however the solutions with the main-sequence constraint have larger un-certainties. Thus, we adopt the solution of each system that does not impose the main-sequence constraint.
Based on the parameters and considerations described above, radius R, density ρ, and surface gravity log g of the star (denoted with the subscript⋆) and of the planet (denoted with the sub-scriptpl), as well as the mass Mpl and the equilibrium
temper-ature of the planet Teqare calculated. The planet’s equilibrium
temperature assumes that it is a black-body (Tpl,A=0) and that the
energy is efficiently redistributed from the planet’s day-side to its night-side. We also calculate the transit ingress (and egress) duration T12(= T34), and the orbital semi-major axis a.
These calculated properties and their 1–σ uncertainties from our MCMC analysis, adopting circular orbits for both planets and not using the main-sequence constraint, are presented in Table 7. The corresponding best-fit model radial velocity curves are shown in Fig. 2. The transit light curve models are shown in Fig. 1 against the WASP observed photometry of WASP-65b (top) and WASP-75b (bottom), in Fig. 4 against the follow-up transit light curves of 65b, and in Fig. 5 for the WASP-75b follow-up transit light curves. Each figure also contains the individual photometric uncertainties and the residuals to the fit.
4. Discussion
We present two newly discovered planets from the WASP sur-vey, WASP-65b and WASP-75b.
In this paper, we have implemented an estimation of the stellar host mass based on both theoretical stellar isochrones (Girardi et al. 2000; Demarque et al. 2004; Pietrinferni et al. 2004; VandenBerg et al. 2006), and the empirical relationship of Torres et al. (2010) as implemented by Enoch et al. (2010) specifically for transiting planets. This allows the inclusion of realistic errors in the host mass determination emcompassing five independent derivations of the stellar mass based on the ρ⋆ measured from the transit light curve, and the spectroscopically-determined [Fe/H] and Teffincluding their uncertainties, which
are not always taken into account. Our analysis includes the propagation of the stellar mass uncertainty in the planet mass and orbital parameters. This is of importance because the planet physical properties are only as accurate as the stellar properties, and any conclusions directly depend on these derived properties. WASP-65b has a mass of 1.55 ± 0.16 MJ, which lies in the
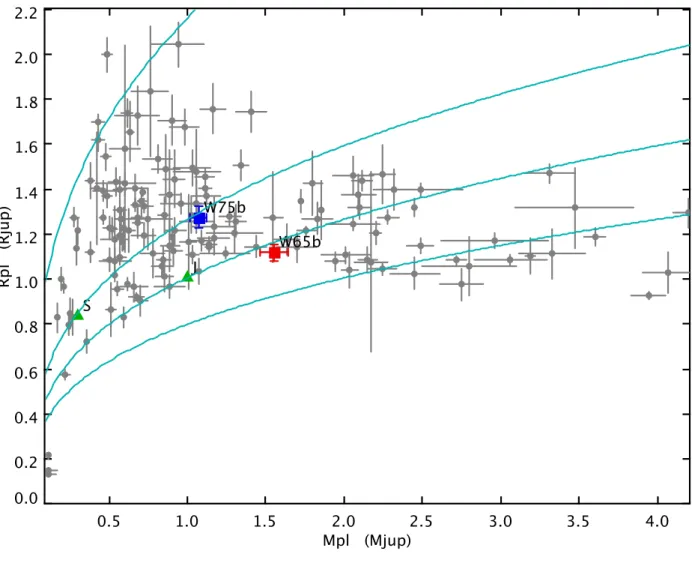
mass regime at which Bayliss et al. (2013) identify a surprising lack of known hot Jupiters. Figure 6 shows this scarcity of hot Jupiters at the mass of WASP-65b (red-filled square), and marks
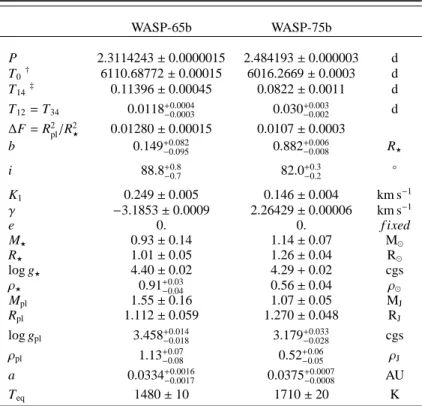
Table 7. System parameters of WASP-65 and WASP-75 WASP-65b WASP-75b P 2.3114243 ± 0.0000015 2.484193 ± 0.000003 d T0† 6110.68772 ± 0.00015 6016.2669 ± 0.0003 d T14‡ 0.11396 ± 0.00045 0.0822 ± 0.0011 d T12= T34 0.0118+0.0004−0.0003 0.030+0.003−0.002 d ∆F = R2 pl/R 2 ⋆ 0.01280 ± 0.00015 0.0107 ± 0.0003 b 0.149+0.082 −0.095 0.882 +0.006 −0.008 R⋆ i 88.8+0.8 −0.7 82.0 +0.3 −0.2 ◦ K1 0.249 ± 0.005 0.146 ± 0.004 km s−1 γ −3.1853 ± 0.0009 2.26429 ± 0.00006 km s−1 e 0. 0. f ixed M⋆ 0.93 ± 0.14 1.14 ± 0.07 M⊙ R⋆ 1.01 ± 0.05 1.26 ± 0.04 R⊙ log g⋆ 4.40 ± 0.02 4.29 + 0.02 cgs ρ⋆ 0.91+0.03−0.04 0.56 ± 0.04 ρ⊙ Mpl 1.55 ± 0.16 1.07 ± 0.05 MJ Rpl 1.112 ± 0.059 1.270 ± 0.048 RJ log gpl 3.458+0.014−0.018 3.179+0.033−0.028 cgs ρpl 1.13+0.07 −0.08 0.52 +0.06 −0.05 ρJ a 0.0334+0.0016 −0.0017 0.0375 +0.0007 −0.0008 AU Teq 1480 ± 10 1710 ± 20 K †BJD TDB– 2 450 000.0
‡T14: time at transit between 1stand 4thcontact
the locus in the mass-radius diagram that separates the lower-density (.1.0ρJ) from the higher-density giant planets (>1.0ρJ).
There are four other known planets with masses consistent with that of WASP-65b within their 1-σ uncertainties: WASP-5b, WASP-12b, WASP-50b, and WASP-72b. Among these five plan-ets, WASP-65b is the smallest/densest. It is also the one in the orbit with the longest period; though WASP-72b’s orbital pe-riod (∼2.22d) is similar to that of WASP-65b. Their planet hosts range from 5400 (WASP-50) to 6300 K (WASP-12), and from -0.12 to 0.3 dex in [Fe/H]. WASP-65 also seems to be the old-est planet host; however, given the uncertainties in the ages, this is not well constrained. It remains unclear whether this paucity of known planets with a mass of ∼1.5 MJ is the result
of a real physical process that might inhibit the formation of giant planets of this mass, a systematic effect in the planetary mass of the known planets because of inaccurate host masses, or due to low-number statistics. The discovery of WASP-65b suggests that we cannot discard any explanation at this time. More discoveries of hot Jupiters, in tandem with a careful re-analysis of the known transiting planets, such as that proposed by G´omez Maqueo Chew et al. (2013) will enable the confirma-tion/rejection of these scenarios.
The mean density of WASP-65b (1.13 ± 0.08 ρJ) is slightly
higher than that of Jupiter, and in fact, WASP-65b is one of the densest planets known in the mass range of 0.1 < Mpl < 2.0
MJ. WASP-75b is also shown in Fig. 6, marked by the
blue-filled square. With Mpl= 1.07 ± 0.05 MJ, WASP-75b has a mean
density (0.52 ± 0.06 ρJ) similar to that of Saturn.
Given the measured semi-major axes of their orbits (0.033 ± 0.002 AU for 65, and 0.0375 ± 0.0008 AU for WASP-75), we compared the theoretical models of Fortney et al. (2007)
for planets orbiting a solar-type star at two different orbital sepa-rations (0.02 and 0.045 AU). We considered the models that pre-dict the largest planet radii: those without a core that are com-posed of only H/He, and those with a 10 M⊕ core composed of 50% rock and 50% ice and a H/He envelope. We find that the radius of WASP-65b (1.11 ± 0.06 RJ) is not inflated, and is
consistent with all of the predicted radii at 10 Gyr for a 1.5 MJ
planet in the cases mentioned above. This agreement in the plan-etary radii could also be considered as evidence of the old age of the system as suggested by the stellar isochrones (∼9-11 Gyr; see Table 6), given that hot Jupiters generally decrease in size
as they evolve (see e.g., Fig. 5 in Fortney et al. 2007),
inde-pendent of heating mechanisms (e.g., Spiegel & Burrows 2013). In the case of WASP-75b, we find the measured radius of 1.27 ± 0.05 RJ to be inflated by <10% as compared to the coreless
models for a 1.0 MJplanet with an age of 3.16 Gyr orbiting at a
distance of 0.02 AU (Fortney et al. 2007).
Perna et al. (2012) identify the equilibrium temperature boundary where the atmospheric heat redistribution starts to be less efficient to be around ∼1500–1700 K. WASP-65b (Teq ∼
1500 K) and WASP-75b (Teq∼ 1700 K) straddle this
bound-ary, and if their atmospheres were observable they could provide insight into the heating/cooling mechanisms of planetary atmo-spheres. With current capabilities for transmission spectroscopy, it is not possible to study these atmospheres. The upper limit of the atmospheric scale height is given for an atmosphere com-posed of 100% molecular Hydrogen, and for the case of both WASP-65b and WASP-75b, it is only of a few hundreds of kilo-metres (∼200 and ∼450 km, respectively). In the case of measur-ing the emission of the planets, the secondary eclipses could be detectable in the K-band and in the Spitzer IRAC 1+2 channels.
Fig. 6. Planet Mass–Radius Diagram. We present two newly discovered planets from the WASP survey for transiting planets,
WASP-65b (red-filled square), and WASP-75b (blue-filled square). The grey points represent the known exoplanets in the Saturn and Jupiter mass regimes taken from exoplanet.org (23 May 2013) and complemented from the literature. Saturn and Jupiter are marked in the green-filled triangles, and are initialed. The continuous (cyan) lines represent equal density traces of 0.1, 0.5, 1.0, and 2.0 ρJ, from
left to right. WASP-65b lies in between the lower-density giant planets and the higher-density high-mass planets.
However, it will make them interesting targets for future plane-tary atmospheric studies (e.g., JWST and EChO; Gardner et al. 2006; Tinetti et al. 2012).
Acknowledgements. We would like to thank the anonymous referee for
sig-nificantly improving this paper. The SuperWASP Consortium consists of as-tronomers primarily from University of Warwick, Queens University Belfast, St Andrews, Keele, Leicester, The Open University, Isaac Newton Group La Palma and Instituto de Astrofsica de Canarias. The SuperWASP-N camera is hosted by the Issac Newton Group on La Palma and WASPSouth is hosted by SAAO. We are grateful for their support and assistance. Funding for WASP comes from consortium universities and from the UK’s Science and Technology Facilities Council. Based on observations made with the CORALIE Echelle spectrograph mounted on the Swiss telescope at ESO La Silla in Chile. TRAPPIST is funded by the Belgian Fund for Scientific Research (Fond National de la Recherche Scientifique, FNRS) under the grant FRFC 2.5.594.09.F, with the participa-tion of the Swiss Naparticipa-tional Science Fundaparticipa-tion (SNF). Y. G ´omez Maqueo Chew acknowledges postdoctoral funding support from the Vanderbilt Office of the Provost, through the Vanderbilt Initiative in Data-intensive Astrophysics (VIDA) and through a grant from the Vanderbilt International Office in support of the Vanderbilt-Warwick Exoplanets Collaboration. M. Gillon and E. Jehin are FNRS Research Associates. L. Delrez is FRIA PhD student of the FNRS. The research
leading to these results has received funding from the European Community’s Seventh Framework Programme (FP7/2007-2013) under grant agreement num-ber RG226604 (OPTICON). C. Liebig acknowledges the Qatar Foundation for support from QNRF grant NPRP-09-476-1-078. A. H.M.J. Triaud is a Swiss National Science Foundation fellow under grant number PBGEP2-145594.
References
Alonso, R., Brown, T. M., Torres, G., et al. 2004, ApJ, 613, L153 Anderson, D. R., Hellier, C., Gillon, M., et al. 2010, ApJ, 709, 159
Baglin, A., Auvergne, M., Boisnard, L., et al. 2006, in COSPAR Meeting, Vol. 36, 36th COSPAR Scientific Assembly, 3749
Bakos, G., Noyes, R. W., Kov´acs, G., et al. 2004, PASP, 116, 266 Baraffe, I., Chabrier, G., & Barman, T. 2008, A&A, 482, 315
Baraffe, I., Chabrier, G., & Barman, T. 2010, Reports on Progress in Physics, 73, 016901
Baranne, A., Queloz, D., Mayor, M., et al. 1996, A&AS, 119, 373 Barnes, S. A. 2007, ApJ, 669, 1167
Batygin, K. & Stevenson, D. J. 2010, ApJ, 714, L238 Bayliss, D., Zhou, G., Penev, K., et al. 2013, ArXiv e-prints
Bernal, J. 1988, National Institute of Standards and Technology Technical Note, 1252
Bodenheimer, P., Hubickyj, O., & Lissauer, J. J. 2000, Icarus, 143, 2 Borucki, W. J., Koch, D., Basri, G., et al. 2010, Science, 327, 977 Bruntt, H., Bedding, T. R., Quirion, P.-O., et al. 2010a, MNRAS, 405, 1907 Bruntt, H., Deleuil, M., Fridlund, M., et al. 2010b, A&A, 519, A51 Burrows, A., Hubeny, I., Budaj, J., & Hubbard, W. B. 2007, ApJ, 661, 502 Cameron, A. C. 2011, in IAU Symposium, Vol. 276, IAU Symposium, ed.
A. Sozzetti, M. G. Lattanzi, & A. P. Boss, 129–134
Charbonneau, D., Brown, T. M., Latham, D. W., & Mayor, M. 2000, ApJ, 529, L45
Claret, A. 2000, A&A, 363, 1081 Claret, A. 2004, A&A, 428, 1001
Collier Cameron, A., Guenther, E., Smalley, B., et al. 2010, MNRAS, 407, 507 Collier Cameron, A., Pollacco, D., Street, R. A., et al. 2006, MNRAS, 373, 799 Collier Cameron, A., Wilson, D. M., West, R. G., et al. 2007, MNRAS, 380,
1230
Dall, T. H., Santos, N. C., Arentoft, T., Bedding, T. R., & Kjeldsen, H. 2006, A&A, 454, 341
Delaunay, B. 1934, Otdelenie Matematicheskikh i Estestvennykh Nauk, 7, 793 Demarque, P., Woo, J., Kim, Y., & Yi, S. K. 2004, ApJ, 155, 667
Enoch, B., Collier Cameron, A., Parley, N. R., & Hebb, L. 2010, A&A, 516, A33 Fortney, J. J., Marley, M. S., & Barnes, J. W. 2007, ApJ, 659, 1661
Fortney, J. J. & Nettelmann, N. 2010, Space Science Reviews, 152, 423 Gardner, J. P., Mather, J. C., Clampin, M., et al. 2006, Space Sci. Rev., 123, 485 Gillon, M., Jehin, E., Magain, P., et al. 2011, Detection and Dynamics of Transiting Exoplanets, St. Michel l’Observatoire, France, Edited by F. Bouchy; R. D´ıaz; C. Moutou; EPJ Web of Conferences, Volume 11, id.06002, 11, 6002
Gillon, M., Smalley, B., Hebb, L., et al. 2009, A&A, 496, 259
Girardi, L., Bressan, A., Bertelli, G., & Chiosi, C. 2000, A&AS, 141, 371 Girardi, L., Williams, B. F., Gilbert, K. M., et al. 2010, ApJ, 724, 1030 G ´omez Maqueo Chew, Y., Faedi, F., Cargile, P., et al. 2013, ApJ, 768, 79 Gray, D. F. 2008, The Observation and Analysis of Stellar Photospheres, ed.
Gray, D. F.
Guillot, T., Burrows, A., Hubbard, W. B., Lunine, J. I., & Saumon, D. 1996, ApJ, 459, L35
Guillot, T., Santos, N. C., Pont, F., et al. 2006, A&A, 453, L21 Hartman, J. D., Bakos, G. ´A., Torres, G., et al. 2011, ApJ, 742, 59 Hebb, L., Collier-Cameron, A., Loeillet, B., et al. 2009, ApJ, 693, 1920 Hebrard, G., Collier Cameron, A., Brown, D. J. A., et al. 2012, ArXiv e-prints Holmes, S., Kolb, U., Haswell, C. A., et al. 2011, PASP, 123, 1177
Jackson, B., Greenberg, R., & Barnes, R. 2008, ApJ, 681, 1631 Jehin, E., Gillon, M., Queloz, D., et al. 2011, The Messenger, 145, 2 Kov´acs, G., Bakos, G., & Noyes, R. W. 2005, MNRAS, 356, 557 Kov´acs, G., Zucker, S., & Mazeh, T. 2002, A&A, 391, 369 Laughlin, G., Crismani, M., & Adams, F. C. 2011, ArXiv e-prints Leconte, J., Chabrier, G., Baraffe, I., & Levrard, B. 2010, A&A, 516, A64 Lendl, M., Anderson, D. R., Collier-Cameron, A., et al. 2012, A&A, 544, A72 Lucy, L. B. & Sweeney, M. A. 1971, AJ, 76, 544
Magain, P. 1984, A&A, 134, 189
Mandel, K. & Agol, E. 2002, ApJ, 580, L171
Marigo, P., Girardi, L., Bressan, A., et al. 2008, A&A, 482, 883
Maxted, P. F. L., Anderson, D. R., Collier Cameron, A., et al. 2011, PASP, 123, 547
Mayor, M. & Queloz, D. 1995, Nature, 378, 355
McCullough, P. R., Stys, J. E., Valenti, J. A., et al. 2005, PASP, 117, 783 P´al, A. & Bakos, G. ´A. 2006, PASP, 118, 1474
Pepe, F., Mayor, M., Galland, F., et al. 2002, A&A, 388, 632 Pepper, J., Pogge, R. W., DePoy, D. L., et al. 2007, PASP, 119, 923 Perna, R., Heng, K., & Pont, F. 2012, ArXiv e-prints
Pietrinferni, A., Cassisi, S., Salaris, M., & Castelli, F. 2004, ApJ, 612, 168 Pollacco, D., Skillen, I., Collier Cameron, A., et al. 2008, MNRAS, 385, 1576 Pollacco, D. L., Skillen, I., Collier Cameron, A., et al. 2006, PASP, 118, 1407 Queloz, D., Eggenberger, A., Mayor, M., et al. 2000, A&A, 359, L13 Queloz, D., Henry, G. W., Sivan, J. P., et al. 2001, A&A, 379, 279 Seager, S. & Mall´en-Ornelas, G. 2003, ApJ, 585, 1038
Sestito, P. & Randich, S. 2005, A&A, 442, 615 Showman, A. P. & Guillot, T. 2002, A&A, 385, 166
Smith, T. C., Henden, A., & Terrell, D. 2010, Society for Astronomical Sciences Annual Symposium, 29, 45
Sozzetti, A., Torres, G., Charbonneau, D., et al. 2007, ApJ, 664, 1190 Spiegel, D. S. & Burrows, A. 2013, ArXiv e-prints
Stetson, P. B. 1987, PASP, 99, 191
Tamuz, O., Mazeh, T., & Zucker, S. 2005, MNRAS, 356, 1466
Tinetti, G., Beaulieu, J. P., Henning, T., et al. 2012, Experimental Astronomy, 34, 311
Toner, C. G. & Gray, D. F. 1988, ApJ, 334, 1008
Torres, G., Andersen, J., & Gim´enez, A. 2010, A&ARv, 18, 67
Udalski, A., Paczynski, B., Zebrun, K., et al. 2002, Acta Astronomica, 52, 1
Valenti, J. A. & Fischer, D. A. 2005, ApJS, 159, 141
VandenBerg, D. A., Bergbusch, P. A., & Dowler, P. D. 2006, ApJS, 162, 375 Wu, Y. & Lithwick, Y. 2012, ArXiv e-prints
Zacharias, N., Finch, C. T., Girard, T. M., et al. 2012, VizieR Online Data Catalog, 1322, 0