Full Terms & Conditions of access and use can be found at
http://www.tandfonline.com/action/journalInformation?journalCode=yacb20
Download by: [University of Liege] Date: 17 May 2016, At: 02:17
Acta Clinica Belgica
International Journal of Clinical and Laboratory Medicine
ISSN: 1784-3286 (Print) 2295-3337 (Online) Journal homepage: http://www.tandfonline.com/loi/yacb20
The ecology of health care in a Belgian area
T. L. Vo, C. Duchesnes, O. Vögeli, J. L. Belche, V. Massart & D. Giet
To cite this article: T. L. Vo, C. Duchesnes, O. Vögeli, J. L. Belche, V. Massart & D. Giet (2015)
The ecology of health care in a Belgian area, Acta Clinica Belgica, 70:4, 280-286, DOI: 10.1179/0001551214Z.000000000137
To link to this article: http://dx.doi.org/10.1179/0001551214Z.000000000137
Published online: 31 Oct 2014.
Submit your article to this journal
Article views: 23
View related articles
The ecology of health care in a Belgian area
T. L. Vo, C. Duchesnes, O. Vo
¨geli, J. L. Belche, V. Massart, D. Giet
Department of General Medicine, Faculty of Medicine, University of Lie`ge, Rue de l’Hoˆpital, 1 Baˆt B23, 4000 Lie`ge, Belgium
Introduction: Focusing on the monthly prevalence of health problems and recourse to different levels of care of the population is an interesting approach to demonstrate the respective roles of different levels of health care. In the present study, the ecology of health care was studied in the region of Lie`ge, Belgium. Method:A survey questioning people about their health problems was conducted in 2009 in two communes of the province of Lie`ge. For each health problem, ‘health care’ was defined as contact with any qualified care provider. For each consultation, three elements were recorded: the profession of the health care provider; the place where the care was provided and the kind of health care received.
Results: A total of 537 people were interviewed. The monthly prevalence of people who experienced a health problem during the previous month was 85.1%. The monthly prevalence of people who turned to a health care provider at least once during the month was 62.2%. The proportion of people turning to doctors, primarily local doctors, for a simple consultation was important (49.2%).
Discussion:Our results are highly comparable with those of other studies. Recourse to a doctor is high (49%), which probably reflects the broad accessibility of health care in Belgium and maybe its overuse. Additional questions on the current and future organisation of the Belgian health care system are debated.
Keywords: Delivery of health care, Primary health care, Attitude to health, Community health service, Belgium
Introduction
The term ‘ecology of health care’ was first used in 1954 by John and Elisabeth Horder.1 These two London general practitioners (GPs) published a model, which used three squares of decreasing sizes to represent respectively their patients, the proportion of patients presenting a health problem sufficiently significant to require a consultation and those who required a referral to a hospital specialist.
In 1961, Kerr White represented monthly prevalence of health problems and recourse to different levels of care using superimposed squares of decreasing sizes.2 His study monitored an Anglo-American population of 1000 adults over the period of one month and found that 750 people had experienced at least one health problem. Of these, 250 had visited a doctor for a consultation. Only nine patients had needed to be sent to hospital to receive more advanced care and only one had required a referral to a university-level hospital.
White’s diagrammatic model was later referred to by some as the ‘Square of White’. This approach sparked a particularly fertile debate, and above all, highlighted the role of primary health care in Western health care systems. White’s model and the lessons that have been drawn from it regarding the role of
primary care doctors were addressed in 2006 in a paper published in the ‘Revue Me´dicale de Lie`ge’.3
In 2001, Green et al.4 published an analysis of the ecology of health care in the US, thereby updating White’s findings: the authors demonstrated great stability in the trends that White had originally described. Figure 1 presents their conclusions relating to medical care. Other authors have stressed the usefulness of White’s diagram-matic model and have re-examined the concept of the ecology of health care in different contexts5–9or in relation to various specific pathologies.10,11
All this research carried out on the ecology of health care has been based on the concept of monthly prevalence, i.e. the number of people in a general population who have reported at least one health problem or who have sought medical help over a given period. This is an interesting approach that highlights in particular the respective roles of different levels of health care.
To our knowledge, this type of analysis has never been performed in a sample of the Belgian population. Based on a comparable model and method, we carried out an analysis of the ecology of health care in the Lie`ge region.
Method
A study was conducted between April and June 2009, on a randomly selected double sample. Two communes in the province of Lie`ge were selected – one in a rural area (Sprimont, 20 km South of Lie`ge) and the other in
Correspondence to: Duchesnes Christiane, Department of General Medicine, University of Lie`ge, Rue de l’Hoˆpital, 1 Baˆt B23, 4000 Lie`ge, Belgium. Email: cduchesnes@ulg.ac.be
an urban area (Herstal, adjoining the North part of Lie`ge). The researchers visited around one hundred addresses, randomly selected beforehand from the municipal register for each commune. In the case of a selected household refusing to participate, the research-ers were instructed to go to the household immediately to the right of the selected one, and to continue in this way until a household agreed to participate. The researchers were all students of either medicine or social sciences, who were all trained to work in an identical way.
A face to face interview based on a questionnaire was conducted with all members of the household who had been living under the same roof for at least one month. If a direct interview with a member of the household was considered to be impossible [due to the young age (below 10 years), disability, absence or lack of availability of the individual], information was obtained from another member of the same family.
The aim of the questionnaire was to record, for each person, all the health problems they had experienced during the previous month, as well as each time they had had recourse to health care during the same period. In order to limit the loss of information due to possible difficulties in remember-ing recent relevant events, three different questions were asked successively: ‘Have you experienced any health problems during the previous month?’; ‘Have you required any health care or medication?’; ‘Have you seen a health professional?’.
All health problems were listed where they related to the origin of symptoms or the consumption of health care during the month in question. All pre-existing health problems that did not require a consultation with a health care professional during the period in question were not taken into account (for example, in the case of a chronic illness that had not required professional care or a chronic illness that had only required a medical prescription prior to the period under study).
‘Health care’ was defined as contact with any qualified care provider. Thus, the use of medica-tions not issued by a pharmacy (self-medication at home) and health care administered without any professional assistance (sticking plasters, baths, etc.) were not recorded. For each consultation, three elements were recorded: the profession of the health care provider (classified in one of the following six categories: doctor, pharmacist, den-tist, nurse, physiotherapist, and other provider); the place where the care was provided [six categories: hospital admissions department; accident and emergency (A&E) department; outpatients’ clinics, doctor’s office, pharmacy, and the patient’s home], and finally the kind of care received (six categories: surgical operation, hospitalisation for non-surgical reasons; complex medical consultation [including technical interventions, laboratory testing, X-rays, etc.]; simple medical consultation [without any technical intervention requiring specialised equip-ment]; provision of medication by a pharmacy without prior medical advice, and paramedical care).
Statistical tests were conducted using the SPSS version 13.0 software with a significant threshold set at P50.05.
Results
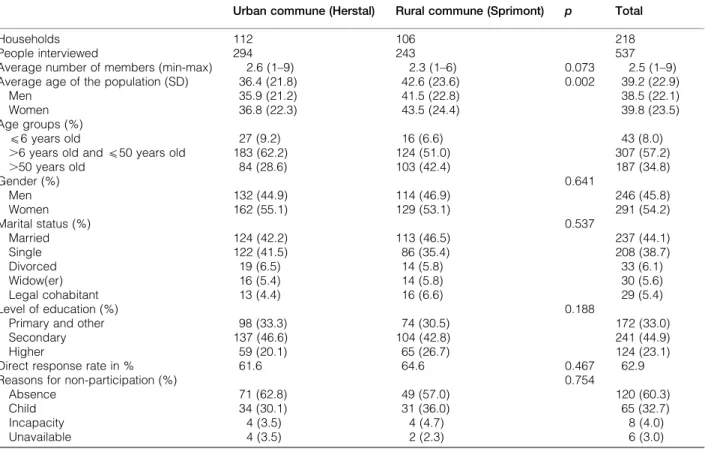
In total, 537 people were interviewed in 218 house-holds spread over the two communes. The demo-graphic characteristics of the two sub-populations studied were not significantly different, except for one: the average age of the interviewees was slightly lower in the urban commune (Table 1). Because there were no significant differences between the two sub-populations studied, it was decided to consider the population as a whole in order to take advantage of a larger sample for the various analyses.
The direct response rate to the researchers was 62.9%. The two most common reasons for non-participation were absence (60.3% of cases) and the young age of the individual concerned (32.7%).
The number of people who had experienced a health problem during the previous month was 457 (i.e. 851 people for every 1000 inhabitants), corre-sponding to a monthly prevalence of 85.1%. The
Figure 1 Monthly prevalence of health problems and the roles of different sources of health care in the United States (adapted from Green et al., 2001).
Vo et al. Ecology of health care in a Belgian area
Acta Clinica Belgica 2015 VOL. 70 NO. 4 281
number of people who had turned to a health care provider at least once during the month was 334 (i.e. 622 in a population of 1000), corresponding to a monthly prevalence of 62.2%. These results are presented in Table 2.
Our data were also analysed according to Green’s criteria4(Fig. 2).
Table 3 provides details of the distribution of recourse to health care according to the type of health care provider consulted, the place where the care was provided, and the kind of care received. The number of people turning to doctors, primarily local doctors, for simple consultations was large (49.2%). The monthly prevalence of people seeking health care, according to the type of health care provider consulted, the setting in which this took place, and the kind of care received are shown in Fig. 3. The ecology of health care is thus analysed from three different points of view.
In addition, a more detailed format is used for presenting the ecology of health care (Fig. 4). This method of presentation facilitates a careful compara-tive analysis according to the level of health care.
Discussion
The ecology of health care model described by White forty years ago2provides an interesting view of the health care system, in the sense that it concentrates on the population and not on the health care system or practitioners. No information based on the monthly prevalence with which people experience health
problems and turn to health care providers is currently available in Belgium. This is the first piece of Belgian research enabling a comparison with research conducted in other countries.
The monthly prevalence of health problems encoun-tered in our sample was 851 per 1000 inhabitants. This is highly comparable with other studies conducted in other Western countries. While White’s original trials conducted among the Anglo-American population in 1961 showed a rate of 750 people per population of 1000 inhabitants reporting experience of a health problem,2more recent studies have revealed figures of between 800 to 860 people per 1000.4,8
In the present study, slightly fewer than 40% of people who reported experiencing at least one health problem had not turned to any medical professional. This underlines the importance of the self-management of health problems, which includes self-medication, but also recourse to other practitioners outside the health care system. This advocates the need for education and health promotion campaigns in the broadest sense of the term, aiming to support people in making those choices.
In terms of health care, the observed monthly prevalence in our study was high, which probably reflects the broad accessibility of health care in Belgium. A rate of 492 individuals out of 1000 had made contact with a doctor during the previous month. It is difficult to make a direct comparison with the results from other studies because of the variety of research methodologies and indicators used
Table 1 Characteristics of the population studied. Results are expressed by mean and standard deviation Urban commune (Herstal) Rural commune (Sprimont) p Total
Households 112 106 218
People interviewed 294 243 537
Average number of members (min-max) 2.6 (1–9) 2.3 (1–6) 0.073 2.5 (1–9) Average age of the population (SD) 36.4 (21.8) 42.6 (23.6) 0.002 39.2 (22.9)
Men 35.9 (21.2) 41.5 (22.8) 38.5 (22.1) Women 36.8 (22.3) 43.5 (24.4) 39.8 (23.5) Age groups (%)
(6 years old 27 (9.2) 16 (6.6) 43 (8.0) .6 years old and (50 years old 183 (62.2) 124 (51.0) 307 (57.2) .50 years old 84 (28.6) 103 (42.4) 187 (34.8) Gender (%) 0.641 Men 132 (44.9) 114 (46.9) 246 (45.8) Women 162 (55.1) 129 (53.1) 291 (54.2) Marital status (%) 0.537 Married 124 (42.2) 113 (46.5) 237 (44.1) Single 122 (41.5) 86 (35.4) 208 (38.7) Divorced 19 (6.5) 14 (5.8) 33 (6.1) Widow(er) 16 (5.4) 14 (5.8) 30 (5.6) Legal cohabitant 13 (4.4) 16 (6.6) 29 (5.4) Level of education (%) 0.188
Primary and other 98 (33.3) 74 (30.5) 172 (33.0) Secondary 137 (46.6) 104 (42.8) 241 (44.9) Higher 59 (20.1) 65 (26.7) 124 (23.1) Direct response rate in % 61.6 64.6 0.467 62.9 Reasons for non-participation (%) 0.754
Absence 71 (62.8) 49 (57.0) 120 (60.3) Child 34 (30.1) 31 (36.0) 65 (32.7) Incapacity 4 (3.5) 4 (4.7) 8 (4.0) Unavailable 4 (3.5) 2 (2.3) 6 (3.0)
and, above all, the characteristics of each health care system. The first version of the Square of White presented a figure of 250 people out of 1000 making
contact with a doctor over the course of one month;2 Green et al. reported a rise in this figure in 2001 to 327 inhabitants.4In our Belgian sample, almost one in two people had seen a doctor over the course of a month. This may raise the question of the possible over-qualification of these service providers: do all these health problems justify medical contact? This is an important question at a time when the possible transfer of skills within our health care system is a matter of debate, in particular the transfer of skills from doctors towards specialist nurses in terms of monitoring chronic conditions.12 The issue of task shifting from GP to practice assistant or advanced nurse practitioner is the subject of current debate in many countries.13–15
Our analysis of the monthly prevalence in relation to the setting in which care was provided showed the high number of people who had received medical care at home: in the previous month, more than 14% of the population had received a home visit from a doctor. This is not a new observation, as several studies have already highlighted this characteristic of the Belgian health care system: each Belgian person on average receives 1.6 home visits per year, the majority of which are conducted by GPs, compared to 2.7 consultations in the doctor’s office and 2.1 consultations in a specialist clinic.16 In 2001, a comparative study of 18 European countries showed
Table 2 Monthly prevalence of people experiencing one or more health problems and turning to health care providers according to age, expressed in percentage (n)
Number of people interviewed 537
Monthly prevalence of people with one or more health problems 85.1 (457) Monthly prevalence of people with one or more health problems aged Less than 6 years 83.7 (36)
Over 6 years and under 50 83.7 (257) Over 50 87.7 (164) Monthly prevalence of people turning to health care providers 62.2 (334) Figure 2 Ecology of health care in the Lie`ge region, using a
model inspired by Green (2001) (monthly prevalence expressed for 1000 people and concerning only recourse to doctors).
Table 3 Distribution of people turning to health care providers, expressed in percentage (n), according to the service provider, the place where care was provided, and the kind of care received
Monthly prevalence of people turning to health care providers on one or more occasions according to the service provider
Doctor 49.2 (264) Dentist 11.5 (62) Physiotherapist 8.6 (46) Pharmacist 6.5 (35) Other provider 5.2 (28) Nurse 4.1 (22)
Monthly prevalence of people turning to health care providers on one or more occasions according to where this care was provided
Doctor’s office 43.4 (233) Outpatients’ clinics 17.5 (94) Patient’s home 14.7 (79)
Pharmacy 6.5 (35)
A&E department 1.9 (10) Hospital admissions department 1.5 (8) Monthly prevalence of people turning to
health care providers on one or more occasion according to the kind of care received
Simple medical consultation 55.7 (299) Complex medical consultation 10.1 (54) Paramedical care 9.3 (50) Provision of medication without prior medical advice 6.7 (36) Surgical operation 0.9 (5) Hospitalisation for non-surgical reasons 0.6 (3)
Vo et al. Ecology of health care in a Belgian area
Acta Clinica Belgica 2015 VOL. 70 NO. 4 283
that the number of home visits by GPs was the highest in Belgium.17Although the rate of home visits has been decreasing in Belgium since 2006,18analysis of the justification for these home visits is essential, given the costs to society. However, there is currently an international debate regarding the ageing of the population and the potential usefulness of home visits for the elderly.19–21
In terms of the number of people turning to hospital A&E departments, or to other hospital
departments, our figures are more or less comparable to those observed in other studies. The frequency rate of use of an A&E department was found to be 1.9%, which is close to rates reported elsewhere (ranging from 1.3 to 1.6%).4–7 A small proportion of the population in our study (1.5%) reported requiring intra-hospital care. This differs little from previous observations (0.7 to 1%).2,4,8,9 In contrast to the American system, our health care system does not allow for the clear distinguishing of those 15 patients
Figure 3 Ecology of health care in the Lie`ge region in terms of health care providers, the place where health care is provided and the kind of care received (monthly prevalence reported for 1000 people): (A) according to health care provider; (B) according to health care setting; (C) according to the kind of care received.
per month who received intra-hospital care and those who required treatment at a university hospital. In Belgium, university hospitals may also provide relatively routine clinical care.
This paper has the added benefit of using a more detailed approach to the ecology of recourse to health care, providing details on the nature of the health care providers, the setting in which that care is provided, and the kind of care received. In line with other observations,2,4,8,9 our study showed that the vast majority of the population had turned to local health care providers for their health problems, which most often required little or no technical input.
This finding may be useful when discussing the distribution of health care resources between the various areas of care, the role of different service providers, and
their specific training needs. In this regard, some authors stress that universities have a responsibility to adapt the medical curriculum to the needs of society.22
The extent of recourse to ‘pharmaceutical advice’ has been the subject of recent discussion in the literature.23,24 In our study, 6.7% of the population reported having recourse to ‘pharmaceutical advice’ in the previous month (contact with a pharmacist for the provision of medication with a medical prescrip-tion was not taken into account in this survey).
To enable a minimal, careful comparison with earlier research, we made the decision to use the concept of monthly prevalence, which follows the method adopted by White.2This approach places the focus on the population by looking at the proportion of people who have experienced at least one health
Figure 4 Ecology of health care in the Lie`ge region in terms of health care providers, place where health care is provided and the kind of care received: (A) according to health care provider (expressed in %); (B) according to health care setting (expressed in %); (C) according to the kind of care received (expressed in %).
Vo et al. Ecology of health care in a Belgian area
Acta Clinica Belgica 2015 VOL. 70 NO. 4 285
problem or who have had recourse to any level of the health care system. There are limits to this approach: it cannot, for example, address the consumption of care, health care needs, or barriers to accessing care. In practice, the choice of a retrospective study based on a questionnaire is open to bias.25 Difficulties in remembering can lead to an under-evaluation of health problems and treatment.26An inverse influence may be linked to the telescoping effect, whereby health events occurring prior to the period being studied are included within it.25 The face-to-face method, how-ever, has the advantage of collecting greater individual detail, compared to studies based on the analysis of official administrative data. The Belgian health authorities regularly issue significant statistical ana-lyses; however, these often relate exclusively to information that is officially declared and recorded.27 We opted for a grouped analysis of two random populations, which were assumed to be representative of the urban and rural populations. We assumed that the total population studied approached the reality of the Lie`ge region. Although the socio-demographic parameters and the information collated in each sub-population were very comparable, the representative-ness of the size of each sample is debatable. Some characteristics of the two communes studied, linked to specific local conditions (for example, the distance between people and clinics or hospital establish-ments), may have hampered the interpretation of the results and their generalisation.28
Conclusion
This study is the first Belgian publication relating to the ecology of health care. It was based on a relatively detailed analysis of the monthly prevalence of health problems and recourse to health care in a population around Lie`ge, which was selected and questioned in line with a rigorous methodology. As in other studies of this nature, a significant proportion of the population were found to have experienced health problems within a period of one month and the majority of them reported seeking a solution through the use of local health care structures. A significant proportion of the population reported turning to doctors, who play a dominant role in primary care provision.
Analysis of the models illustrating the ecology of health care raises various questions, which will fuel discussion on the current and future organisation of the Belgian health care system.
References
1 Horder J, Horder E. Illness in general practice. Practitioner. 1954;173:177–87.
2 White KL, Williams TF, Greenberg BG. The ecology of medical care. N Engl J Med. 1961;265:885–92.
3 Giet D. Ecology of medical care, the square of White, primary care and general practice. Rev Med Liege. 2006;61:277–84. 4 Green LA, Fryer GE, Jr, Yawn BP, Lanier D, Dovey SM. The
ecology of medical care revisited. N Engl J Med. 2001;344:2021–5. 5 Fryer GE, Jr, Green LA, Dovey SM, Yawn BP, Phillips RL, Lanier D. Variation in the ecology of medical care. Ann Fam Med. 2003;1:81–9.
6 Dovey SM, Weitzman M, Fryer GE, Green LA, Yawn B, Lanier D, et al. The ecology of medical care for children in the United States. Pediatrics. 2003;111:1024–9.
7 Leung GM, Wong IO, Chan WS, Choi S, Lo SV, Health Care Financing Study G. The ecology of health care in Hong Kong. Soc Sci Med. 2005;61:577–90.
8 Thacker SB, Greene SB, Salber EJ. Hospitalizations in a southern rural community: an application of the ‘ecology model’. Int J Epidemiol. 1977;6:55–63.
9 White KL. The ecology of medical care: origins and implica-tions for population-based healthcare research. Health Serv Res. 1997;32:11–21.
10 Yawn BP, Fryer GE, Phillips RL, Dovey SM, Lanier D, Green LA. Using the ecology model to describe the impact of asthma on patterns of health care. BMC Pulm Med. 2005;5:7. 11 Chou LF. The ecology of mental health care in Taiwan. Adm
Policy Ment Health. 2006;33:492–8.
12 Giet D. Challenges to the general practice for the years to come. La Revue de Me´decine Ge´ne´rale. 2008;252:154–6.
13 Brant C, Leydon GM. The role of the health-care assistant in general practice. Br J Nurs. 2009;18(15):926–33.
14 Dini L, Sarganas G, Boostrom E, Ogawa S, Heintze C, Braun V. German GPs’ willingness to expand roles of physician assistants: a regional survey of perceptions and informal practices influencing uptake of health reforms in primary health care. Fam Pract. 2012;29:448–54.
15 Weber-Yaskevich O, Reber A, Gillabert C. Present and future ambulatory nursing care in Switzerland: what general practi-tioners should know. Rev Med Suisse. 2011;7:1846–51. 16 Corens D. Health system review: Belgium. Health Syst Transit.
2007;9:1–172.
17 Boerma WGW, Groenewegen PP. GP home visiting in 18 European countries: adding the role of health system features. EJGP. 2001;7:132–7.
18 Meeus P, Van Aubel X. Performance de la me´decine ge´ne´rale, bilan de sante´. Health Services Research (HSR). Bruxelles: Institut national d’assurance maladie-invalidite´ (INAMI); 2012. D/2012/0401/11.
19 Kao H, Conant R, Soriano T, McCormick W. The past, present, and future of house calls. Clin Geriatr Med. 2009;25:19–34. 20 Unwin BK, Tatum PE. House calls. Am Fam Phys. 2011;83:
925–31.
21 Hayashi J, Christmas C, Durso SC. Educational outcomes from a novel house call curriculum for internal medicine residents: report of a 3-year experience. JAGS. 2011;59:1340–9. 22 Gibbon W. Medical schools for the health-care needs of the
21st century. Lancet. 2007;369:2211–3.
23 Laliberte MC, Perreault S, Damestoy N, Lalonde L. Ideal and actual involvement of community pharmacists in health promotion and prevention: a cross-sectional study in Quebec, Canada. BMC Public Health. 2012;12:192.
24 Eades CE, Ferguson JS, O’Carroll RE. Public health in community pharmacy: a systematic review of pharmacist and consumer views. BMC Public Health. 2011;11:582.
25 Bhandari A, Wagner T. Self-reported utilization of health care services: improving measurement and accuracy. Med Care Res Rev. 2006;63:217–35.
26 Roberts RO, Bergstralh EJ, Schmidt L, Jacobsen SJ. Comparison of self-reported and medical record health care utilization measures. J Clin Epidemiol. 1996;49:989–95. 27 Vlayen J, Vanthomme K, Camberlin C, Pie´rart J, Walckiers D,
Kohn L, et al. A first step towards measuring the performance of the Belgian health care system. Health Services Research (HSR), Brussels: Belgian Health Care Knowledge Center (KCE)]; 2010. KCE Reports 128B (D/2010/10.273/26).
28 Gerkens S, Merkur S. Belgium: Health system review. Health Syst Transit. 2010;12:1–266.