Protected Areas in Tropical Africa:
Assessing Threats and Conservation
Activities
Sandra Tranquilli
1*, Michael Abedi-Lartey
2,3, Katharine Abernethy
4,5, Fide`le
Amsini
6, Augustus Asamoah
7, Cletus Balangtaa
8, Stephen Blake
9,10, Estelle
Bouanga
11, Thomas Breuer
12, Terry M. Brncic
13, Genevie`ve Campbell
14, Rebecca
Chancellor
15, Colin A. Chapman
9,16, Tim R. B. Davenport
17, Andrew Dunn
18, Jef
Dupain
19, Atanga Ekobo
20, Manasseh Eno-Nku
21, Gilles Etoga
22, Takeshi
Furuichi
23,24, Sylvain Gatti
25, Andrea Ghiurghi
26, Chie Hashimoto
23,24, John A.
Hart
27, Josephine Head
28, Martin Hega
29, Ilka Herbinger
30, Thurston C. Hicks
28,31,
Lars H. Holbech
32, Bas Huijbregts
33, Hjalmar S. Ku
¨ hl
28,34, Inaoyom Imong
18,28,
Stephane Le-Duc Yeno
35, Joshua Linder
36, Phil Marshall
37, Peter Minasoma
Lero
38, David Morgan
39, Leonard Mubalama
40, Paul K. N’Goran
41, Aaron
Nicholas
42, Stuart Nixon
43, Emmanuelle Normand
44, Leonidas Nziguyimpa
45,
Zacharie Nzooh-Dongmo
22, Richard Ofori-Amanfo
46, Babafemi G. Ogunjemite
47,
Charles-Albert Petre
48,49, Hugo J. Rainey
9, Sebastien Regnaut
50, Orume
Robinson
51, Aaron Rundus
52, Crickette M. Sanz
53, David Tiku Okon
54, Angelique
Todd
55, Ymke Warren
56, Volker Sommer
11. Department of Biological Anthropology, University College London, London, United Kingdom, 2. Department of Migration and Immuno-Ecology, Max Planck Institute for Ornithology, Radolfzell, Germany, 3. Department of Biology, University of Konstanz, Konstanz, Germany, 4. African Forest Ecology Group, School of Natural Sciences, University of Stirling, Stirling, United Kingdom, 5. IRET, Libreville, Gabon, 6. Frankfurt Zoological Society, Maiko National Park, Tshopo, Democratic Republic of Congo, 7. Environmental Sustainability Project, United Nations Development Programme/Ghana Cocoa Board, Adabraka, Accra, Ghana, 8. Wildlife Division of Forestry Commission of Ghana, Ankasa Conservation Area, Elubo, Takoradi, Ghana, 9. Wildlife Conservation Society, New York, United States of America, 10. Whitney Harris World Ecology Center, University of Missouri – Saint Louis, Saint Louis, Missouri, United States of America, 11. Ministe`re de la Foreˆt, de l’Environnement et de la Protection des Ressources Naturelles, Libreville, Gabon, 12. Wildlife Conservation Society, Congo Program, Brazzaville, Republic of Congo, 13. Tacugama Chimpanzee Sanctuary, Freetown, Sierra Leone, 14. Independent Researcher, Montreal, Canada, 15. Departments of Anthropology & Sociology, and Psychology, West Chester University, West Chester, Pennsylvania, United States of America, 16. Department of Anthropology and McGill School of Environment, McGill University, Montre´al, Que´bec, Canada, 17. Wildlife Conservation Society, Tanzania Program, Zanzibar, Tanzania, 18. Wildlife Conservation Society, Calabar, Nigeria, 19. African Wildlife Foundation, Nairobi, Kenya, 20. World Wide Fund for Nature, Limbe, Cameroon, 21. World Wide Fund for Nature, Mount Cameroon NP, Limbe, Cameroon, 22. World Wide Fund for Nature CARPO, Jengi Tridom, Yaunde´, Cameroon, 23. Primate Research Institute, Kyoto University, Kyoto, Japan, 24. Support for Conservation of Bonobos, Luo Reserve, Democratic Republic of Congo, 25. West African Primate Conservation Action, Accra, Ghana, 26.
Independent Researcher, Rome, Italy, 27. Lukuru Wildlife Research Foundation, Kinshasa, Democratic Republic of Congo, 28. Department of Primatology, Max Planck Institute for Evolutionary Anthropology, Leipzig, Germany, 29. Wildlife Conservation Society, Monts de Cristal, Gabon, 30. World Wide Fund for Nature, Berlin, Germany, 31. Institute for Biodiversity and Ecosystem Dynamics, The University of Amsterdam, Amsterdam, The Netherlands, 32. Department of Animal Biology and Conservation Science, University of Ghana, Legon, Accra, Ghana, 33. World Wide Fund for Nature, Central Africa Regional Programme Office, Yaounde´, Cameroon, 34. German Centre for Integrative Biodiversity Research, Leipzig, Germany, 35. World Wide Fund for Nature, Gamba, Libreville, Gabon, 36. Department of Sociology and Anthropology, James Madison University, Harrisonburg, Virginia, United States of America, 37. North Eastern Parks Programme, Windhoek, Namibia, 38. Directorate of Wildlife Service, Ministry of Interior and Wildlife Conservation, Juba, Republic of South Sudan, 39. Lester E. Fisher Center for Great Ape Research, Lincoln Park Zoo, Chicago, Illinois, United States of America, 40. World Wide Fund for Nature, Itombwe Conservation OPEN ACCESS
Citation: Tranquilli S, Abedi-Lartey M, Abernethy K, Amsini F, Asamoah A, et al. (2014) Protected Areas in Tropical Africa: Assessing Threats and Conservation Activities. PLoS ONE 9(12): e114154. doi:10.1371/journal.pone.0114154 Editor: Francisco Moreira, Institute of Agronomy, University of Lisbon, Portugal
Received: June 22, 2014 Accepted: November 4, 2014 Published: December 3, 2014
Copyright: ß 2014 Tranquilli et al. This is an open-access article distributed under the terms of theCreative Commons Attribution License, which permits unrestricted use, distribution, and repro-duction in any medium, provided the original author and source are credited.
Data Availability: The authors confirm that, for approved reasons, some access restrictions apply to the data underlying the findings. Data is available from Figshare (http://dx.doi.org/10.6084/ m9.figshare.1230106).
Funding: The authors have no support or funding to report.
Competing Interests: The authors modified the affiliation of the two co-authors that are currently employed by commercial companies ‘‘SG Sustainable Oils Cameroon’’ and ‘‘AGRECO’’. At the time of data collection, one of them was employed at the WWF and the other one was an independent researcher. Therefore, the authors changed their affiliation according to with whom they were affiliated at the time of the data collection. The authors confirm that this does not alter their adherence to PLOS ONE policies on sharing data and materials.
Programme, Bukavu, South Kivu Province, Eastern Democratic Republic of Congo, 41. Centre Suisse de Recherches Scientifiques en Coˆte d’Ivoire, Abidjan, Coˆte d’Ivoire, 42. Wildlife Conservation Society, Ruaha-Katavi Landscape, Tanzania, 43. Zoological Society of London, London, United Kingdom, 44. Wild Chimpanzee Foundation, Abidjan, Cote d’Ivoire, 45. Institut National pour l’Environnement et la Conservation de la Nature, Bururi, Burundi, 46. Bia Conservation Area, Sefwi Wiawso, Ghana, 47. Department Ecotourism and Wildlife Management, Federal University of Technology, Akure, Nigeria, 48. Laboratory of Tropical and Subtropical Forestry, Unit of Forest and Nature Management, Gembloux Agro-Bio Tech, University of Lie`ge, Gembloux, Belgium, 49. Education and Nature, Conservation Biology Unit, Royal Belgian Institute of Natural Sciences, Brussels, Belgium, 50. International Union for Conservation of Nature, Protected Areas Program West and Central Africa, Ouagadougou, Burkina Faso, 51. Ministry of Forestry and Wildlife, Korup National Park, Ndian, Cameroon, 52. Department of Psychology, West Chester University, West Chester,
Pennsylvania, United States of America, 53. Department of Anthropology, Washington University, Saint Louis, Missouri, United States of America, 54. World Wide Fund for Nature, Korup National Park, Limbe, Cameroon, 55. World Wide Fund for Nature, Bangui, Central African Republic, 56. Wildlife Conservation Society, Limbe, Cameroon
*sandra.tranq@gmail.com
Abstract
Numerous protected areas (PAs) have been created in Africa to safeguard wildlife
and other natural resources. However, significant threats from anthropogenic
activities and decline of wildlife populations persist, while conservation efforts in
most PAs are still minimal. We assessed the impact level of the most common
threats to wildlife within PAs in tropical Africa and the relationship of conservation
activities with threat impact level. We collated data on 98 PAs with tropical forest
cover from 15 countries across West, Central and East Africa. For this, we
assembled information about local threats as well as conservation activities from
published and unpublished literature, and questionnaires sent to long-term field
workers. We constructed general linear models to test the significance of specific
conservation activities in relation to the threat impact level. Subsistence and
commercial hunting were identified as the most common direct threats to wildlife
and found to be most prevalent in West and Central Africa. Agriculture and logging
represented the most common indirect threats, and were most prevalent in West
Africa. We found that the long-term presence of conservation activities (such as law
enforcement, research and tourism) was associated with lower threat impact levels.
Our results highlight deficiencies in the management effectiveness of several PAs
across tropical Africa, and conclude that PA management should invest more into
conservation activities with long-term duration.
Introduction
Tropical rainforests harbour a particularly rich and unique biodiversity [
1
].
Though representing only 7% of land surface, they support more than 60% of all
known species [
2
]. However, their existence is compromised by many interrelated
anthropogenic threats that have intensified over recent decades [
3
,
4
]. Increased
human population growth and economic expansion have fostered the rapid
expansion of two of the main threats to wildlife, habitat destruction and
unsustainable hunting. These disturbances have caused several declines in wildlife
populations and have contributed to the degradation of many tropical forests
[
5
,
6
,
7
]. Over the past 20–30 years, threats to African tropical forests in particular
have attracted national and international attention. This has led to the creation of
numerous protected areas (PAs), which are intended to conserve both fauna and
flora, whilst benefitting neighbouring human communities [
8
,
9
,
10
].
Nevertheless, human populations throughout Africa have increased the amount
of pressure being exerted on PAs. Thus, despite their legal protected status, PAs
face significant threats. Of particular concern are overexploitation of natural
resources, habitat loss, fragmentation and isolation (e.g., [
6
],[
11
–
14
]). These
factors impact severely on key species and especially taxa with large body sizes,
slow reproductive rates, and little behavioural adaptability [
15
,
16
]. Moreover,
many PAs in tropical Africa are ‘‘paper-parks’’ where conservation efforts are
minimal or non-existent [
17
]. Thus, many wildlife populations continue to
decline [
18
] and local extinctions have become increasingly common within PAs
(e.g., colobus monkeys: [
19
]; great apes: [
20
,
21
]; ungulates: [
22
]).
The persistence of wildlife in a PA depends largely on the magnitude of
anthropogenic pressures and the success of conservation efforts to combat such
threats [
17
]. For instance, the mere continuous presence of conservation
non-governmental organizations (NGOs), law enforcement, tourism or research in
PAs has a positive effect on the persistence of large mammals within PAs, such as
apes [
23
]. Conversely, inadequate law enforcement, including insufficient
training, guard numbers, equipment, patrols and funding enables poaching and
other illegal activities [
6
,
24
,
25
].
Many PAs are not adequately funded by the national governments, because they
are not considered to be economically viable investments [
26
]. Therefore, they
often depend on additional support from both international and national NGOs
working in partnerships with national and regional authorities. Nevertheless, the
total funding allocated to a PA is often insufficient to ensure effective protection
[
26
,
27
,
28
].
The management performance, threat impact level and wildlife status inside
African PAs have been increasingly assessed over the last decade [
6
,
23
,
29
]. These
evaluations are particularly important to bridge the gap between policy makers,
funding bodies and conservation practitioners [
30
]. However, threats to PAs in
tropical areas are notoriously difficult to assess due to poor or non-existent data
and typically limited to case studies (e.g., [
31
,
32
]) or individual countries [
33
,
34
].
In addition, the significance of conservation activities in relation to the impact
level of the different threats to PAs has rarely been evaluated on a broad scale in
tropical Africa.
To address this deficit, we collected information on threats to wildlife and
conservation activities in 98 PAs in tropical forests throughout Africa with
significant wildlife populations. In this study we evaluate the impact levels of 12
different threats both at a continental and regional scale. Moreover, we use an
evidence-based approach to assess the relative significance of a range of
conservation activities (including law enforcement, tourism and research
activities) that are aimed at the protection of PAs. Based on our findings, we
provide recommendations to enhance effective conservation management.
Methods
Ethical statement
The research was reviewed and approved by the Ethical Review Process of the
University College London (UCL) before data collection began.
The ethics committee allowed the involvement of human participants in the
project and their participation in written, face-to-face and phone interviews, and a
written consent declaring their willingness to participate in this study and to be a
co-author of the study. All the participants provided via e-mail written informed
consent to participate in the study and to be a co-author.
Data collection
We collected information about local threats to wildlife and conservation
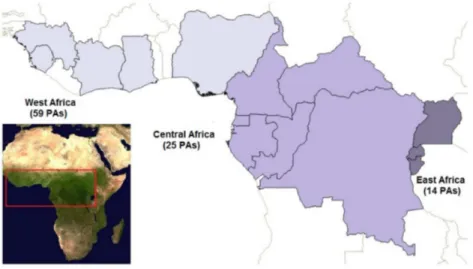
activities of 98 PAs from 14 countries with tropical forest cover (
Fig. 1
, Table S1),
across West, Central and East Africa. These areas harbour significant wildlife
populations, including endangered and charismatic large and small mammals
(such as apes, elephants, leopards, monkeys, and pangolins) and birds (such as
vultures and eagles) [
35
]. Size of PAs ranged from 9.3 to 32, 967 km
2covering a
total area of 182, 797 km
2. The PAs included in the analyses focussed on the
conservation of wildlife and ecosystem services.
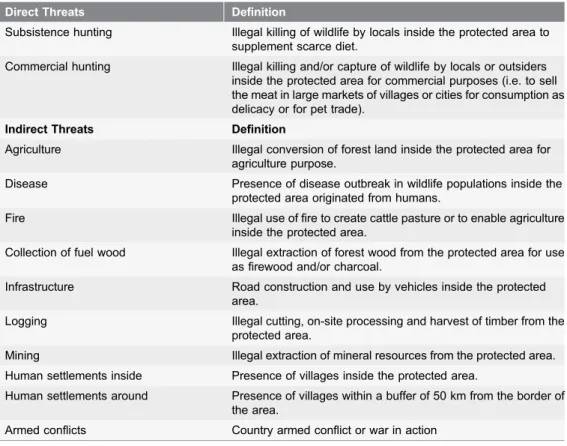
Data on local threats to wildlife in PAs were collected from published literature
and a list of the 12 common known threats was generated, as cited in the literature
of the past 20 years as the most critical to wildlife within PAs (
Table 1
, Text S1).
These include (i) direct threats, with short-term and immediate effects on wildlife
populations (i.e. removal and killing of individual animals) such as subsistence
and commercial hunting, and (ii) indirect threats, with long-term effects that
drive wildlife population declines, such as illegal agriculture, collection of fuel
wood, fire, mining, logging and human settlement density, infrastructure, armed
conflicts and disease.
In addition, questionnaires about the generated list of common threats were
completed by long-term field workers and augmented by face-to-face or phone
interviews (Text S1, Table S2). Interviewees were asked to score the relative
importance of individual threats to wildlife populations for the years of the last
decade when they worked at their respective sites. Threats were assigned to the
following impact levels: level 0 (absent impact), level 1 (low impact, threat present
with minimal impact on wildlife populations), level 2 (moderate impact, threat
present and affecting wildlife populations with impact not critical to their
survival), level 3 (high impact, threat present with impact critically affecting the
survival of wildlife populations). Moreover, interviewees were invited to describe
additional ‘‘site-specific’’ or ‘‘country-specific’’ threats.
Data on conservation activities in PAs for each year were collected from
published and unpublished literature, and gaps in information for specific areas
were filled by the expert knowledge of conservation scientists and practitioners
through questionnaires or phone interviews (Text S1, Tables S3, S4). These data
aimed to cover the last 20 years for 105 PAs and included primary activities
(direct actions to reduce threats; i.e. law enforcement) and secondary activities
(indirect supportive actions, i.e. tourism and research). We selected these
conservation activities for the analyses on the basis of a recent study that
demonstrated their important role in reducing species extinction risk in tropical
Africa [
23
].
Statistical analyses
Correlations between the impact levels of two threats at a time were investigated
on a continent-wide scale, employing Spearman’s correlations test and a post-hoc
Bonferroni correction to reduce the error of multiple testing. To visualize in detail
the relationships of similarities and dissimilarities in threats we developed
Figure 1. Regional distribution of the protected areas (PAs) in tropical Africa considered in the analyses. The regions are coloured in different grey scale colours. Light grey represents West Africa, including 54 protected areas; medium grey represents Central Africa, including 31 protected areas; dark grey represents East Africa, including 14 protected areas. On the left-side bottom corner a MODIS NDVI image of Africa, with a red quadrant highlighting the tropical area considered in the study.dendrograms, as a graphical representation of the matrix of Euclidian distances
between groups of threats.
We calculated the percentage of PAs having a particular threat at different
impact levels, to reveal any differences at a continental and regional level. In
addition, we analyzed the proportion of PAs, both at a continental and at regional
scale in tropical Africa, to investigate the temporal trend of conservation activities
presence over the last two decades.
We used General Linear Models (GLMs) [
36
] with binomial error structure and
logit link function to evaluate the relative importance of conservation activities
variables on ‘PA conservation status’. We used the term ‘PA conservation status’
to refer to the level of impact of several threats to its wildlife and thus to its
ecological viability, having a binary status ‘not threatened/threatened with more
than 30% of threats at level 2 and 39. We analyzed all possible GLM subsets for the
three categories of test variables, i.e., law enforcement, tourism, and research. In
addition, we included the size of the PA as control variable, assuming that the
threat impact levels vary according to the area dimension (see
Table 2
for the
description of the predictor variables). In addition, we ran a correlation between
all conservation activities of
Table 2
(Table S5) and eliminated the most
redundant, and then we used both forward and backward stepwise regression
analysis to identify the strongest predictors of threat impact level among all the
Table 1. Common threats to wildlife in protected areas in tropical Africa and their definition.Direct Threats Definition
Subsistence hunting Illegal killing of wildlife by locals inside the protected area to supplement scarce diet.
Commercial hunting Illegal killing and/or capture of wildlife by locals or outsiders inside the protected area for commercial purposes (i.e. to sell the meat in large markets of villages or cities for consumption as delicacy or for pet trade).
Indirect Threats Definition
Agriculture Illegal conversion of forest land inside the protected area for agriculture purpose.
Disease Presence of disease outbreak in wildlife populations inside the protected area originated from humans.
Fire Illegal use of fire to create cattle pasture or to enable agriculture inside the protected area.
Collection of fuel wood Illegal extraction of forest wood from the protected area for use as firewood and/or charcoal.
Infrastructure Road construction and use by vehicles inside the protected area.
Logging Illegal cutting, on-site processing and harvest of timber from the protected area.
Mining Illegal extraction of mineral resources from the protected area. Human settlements inside Presence of villages inside the protected area.
Human settlements around Presence of villages within a buffer of 50 km from the border of the area.
Armed conflicts Country armed conflict or war in action doi:10.1371/journal.pone.0114154.t001
three conservation activity categories [
37
]. These latter analyses were based on a
dataset where information on each conservation activity was available for each PA
for the period considered, and encompassed 76 PAs. All variables were
z-transformed before model fitting. For both GLMs and stepwise regression models,
we used the Akaike’s Information Criterion (AIC) model selection [
38
,
39
] to
identify the predictor variables that best explained the data. The Akaike
Information Criterion Weight (AICw) was calculated for each model to obtain the
one that best explains the relative explanatory value of the different predictors
influencing the response variable [
40
]. All analyses were conducted using R
software (version 2.11.1; [
41
]). The GLMs and stepwise regression models were
carried out using the function ‘‘lmer’’ from R package ‘‘lme4’’ [
42
], and the
function ‘‘step’’ from R package ‘‘MASS’’ [
43
], respectively.
Results
Relationships between threats
A total of 66 correlations between the threat impact levels were performed for the
overall sample of 98 PAs (
Table 3
). Impact levels of subsistence and commercial
hunting were positively correlated, likewise subsistence hunting and agriculture.
Moreover, there was a positive correlation between the combined impacts of
agriculture and fuel wood collection on one hand, and agriculture and human
settlement on the other. Additional positive correlations were found between the
level of impact of fuel wood collection and the use of fire (
Table 3
).
The dendrogram showed the associations between three main clades (Fig. S2).
The geometry indicated that groupings within each clade were more similar to
each other than to those within any other clade. War and disease were shown to be
dissimilar to the rest of the other threats (clade I); agriculture and collection of
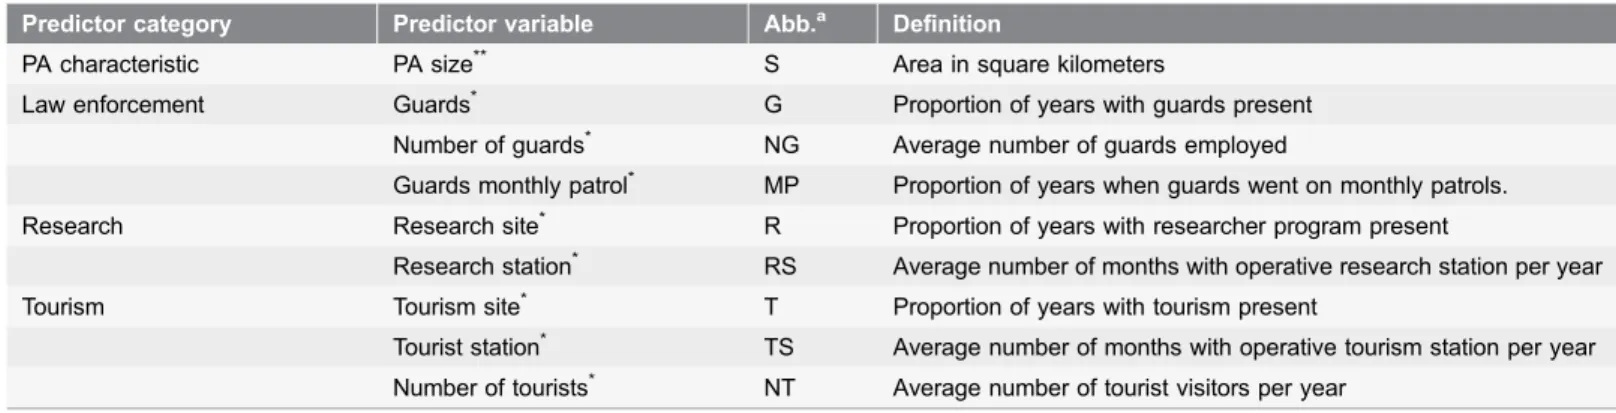
Table 2. Predictor variables considered in the GLM analyses.Predictor category Predictor variable Abb.a Definition
PA characteristic PA size** S Area in square kilometers
Law enforcement Guards* G Proportion of years with guards present
Number of guards* NG Average number of guards employed
Guards monthly patrol* MP Proportion of years when guards went on monthly patrols.
Research Research site* R Proportion of years with researcher program present
Research station* RS Average number of months with operative research station per year
Tourism Tourism site* T Proportion of years with tourism present
Tourist station* TS Average number of months with operative tourism station per year Number of tourists* NT Average number of tourist visitors per year
(a) Abbreviation used in models (seeTab 4,5,6)
(*) Test variables included information during the five years prior to the year when PA threat impact level was scored, as an approximation of temporal
change of these variables, between 1992 and 2011 (source: literature, questionnaires). (**) Control variables (source: World Database on Protected Areas).
wood activities were close to each other and belonging to the same clade with
human settlements within and around PAs (clade II). Close relationship was
shown for both the two hunting activities and infrastructure and logging, in
contrast to fire and mining (clade III).
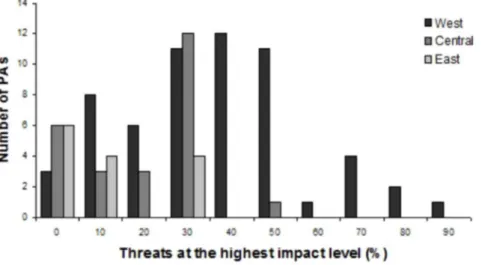
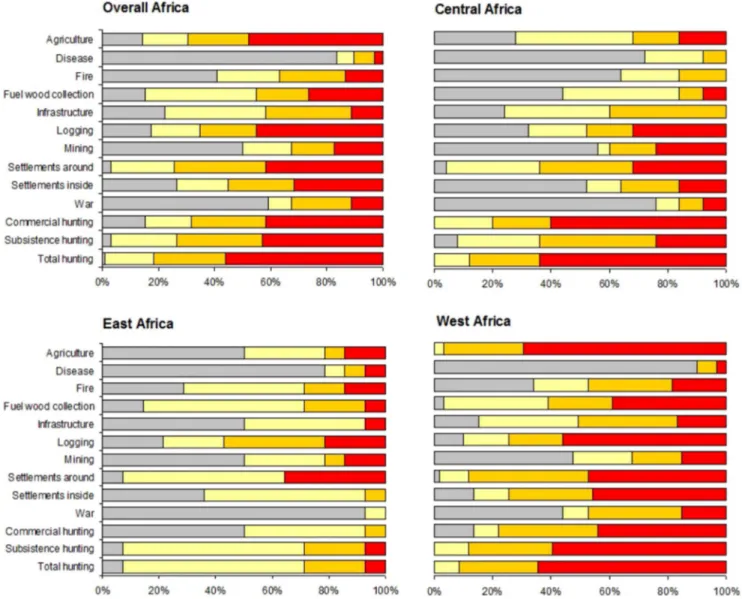
Threat impact level at a continental and regional scale
Wildlife populations within 83 out of the 98 PAs (85%) were rated as highly
threatened, with at least one threat at level 3. Moreover, 32 PAs experienced more
than 40% of all the 12 listed threats at level 3. Of these, 31 sites were located in
West Africa (
Fig. 2
).
Among the threats at impact level 3 across tropical Africa, hunting was the most
common for 56% of all PAs (
Fig. 3a
). However, little difference was found
between subsistence and commercial hunting (42% and 41% of sites,
respectively). Agriculture and logging were the most common indirect threats
with rank at level 3 in 48% and 45% of all the sites, respectively. Human
settlements within and bordering PAs had also high impact on wildlife for 31%
and 41% of the areas (
Fig. 3a
).
Concerning the regional distribution of threats, West Africa harboured the
most threatened PAs suffering threats ranked at level 3 (95% of sites; n 559 PAs)
(
Fig. 3d
). Specifically, the direct threats most frequently rated with the highest
impact were hunting (with subsistence hunting being slightly more prevalent than
commercial hunting). As for indirect threats, agriculture and logging were the
most common high impact threats.
Central Africa (n525 PAs) showed a similar scenario with respect to hunting.
However, commercial hunting was found to be more prevalent, with the highest
Table 3. Symmetric matrix with Spearman’s correlation between all threat impact levels recorded in 98 protected areas.coh suh agr fuw inf hsa hsi war dis fir min log
coh 1.00 suh 0.55 1.00 agr 0.07 0.52 1.00 fuw 0.22 0.36 0.60 1.00 inf 0.20 0.25 0.40 0.32 1.00 hsa 0.15 0.40 0.48 0.36 0.39 1.00 hsi 0.03 0.31 0.55 0.39 0.25 0.41 1.00 war 20.08 0.08 0.28 0.12 0.22 0.04 0.31 1.00 dis 0.06 0.10 20.05 0.06 20.09 0.20 0.10 0.11 1.00 fir 0.17 0.34 0.30 0.50 0.14 0.37 0.38 20.05 0.11 1.00 min 0.37 0.25 20.01 0.15 0.31 0.31 0.04 20.05 0.22 0.32 1.00 log 0.30 0.34 0.27 0.38 0.40 0.13 0.11 0.23 20.07 0.11 0.21 1.00
In bold are highlighted significant correlations (p,0.0001) following post hoc test Bonferroni correction (p50.05/78). Abbreviations: coh, commercial hunting; suh, subsistence hunting; agr, agriculture; fuw, fuel wood; inf, infrastructure; has, human settlement around; his, human settlement inside; war, war; dis, disease; fir, fire; min, mining; log, logging.
impact level than subsistence hunting. Human settlements around the PAs and
logging had the highest percentage of high impact level within the indirect human
threats (32% of the areas;
Fig. 3b
).
In East Africa (n514 PAs), subsistence hunting was scored at the highest
impact level in contrast to commercial hunting, although at a small percentage
(7%;
Fig 3c
). Human density around the PAs was found to be the most prevalent
threat with impact level 3 in relation to other activities (36% of the sites;
Fig. 3c
).
When interviewees described additional threats, cattle grazing was the most
common threat added and this was present in both West Africa (12 sites, with
66% of them at level 3, occurring in Nigeria, Sierra Leone and Coˆte d’Ivoire) and
East Africa (one site in Rwanda at level 3). Presence of refugees, and
human-wildlife conflicts were perceived as threats principally in Uganda (Fig. S1).
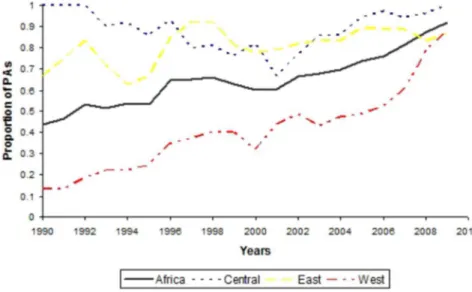
Conservation activities and influence on threat levels
The last two decades have seen a considerable increase of conservation activities
across tropical forest Africa (
Fig. 4
). During the 1990s, West Africa had the lowest
presence of conservation activities; however, PAs with conservation activities
reached similar proportion in all regions towards the end of the first decade of the
new millennium (
Fig. 4
).
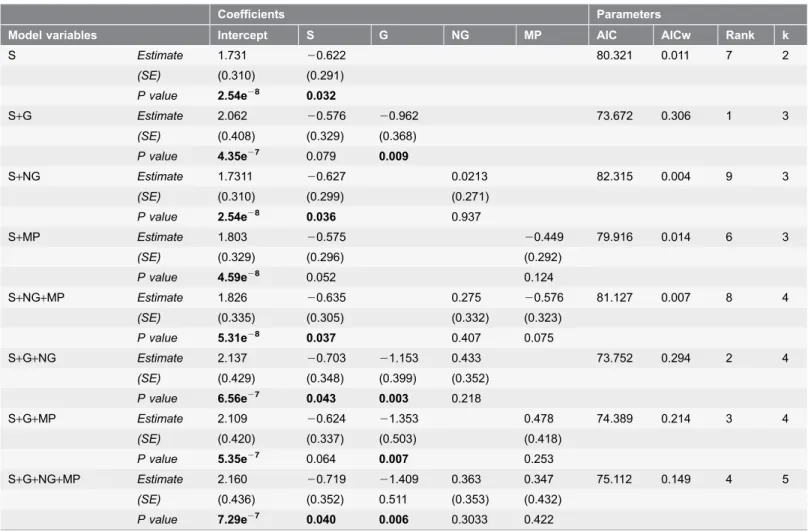
Concerning law enforcement activities, the proportion of years with the
presence of guards was significant in all the models where it was included. The
model that best explained the relationship of law enforcement on the threat
Figure 2. Number of protected areas with percentage of threats at the highest impact level per region. doi:10.1371/journal.pone.0114154.g002impact level in a PA included the proportion of years with guards being present as
a single test variable (guards ¡ SE520.962¡0.368, p5 0.009, n590,
AIC
w50.306;
Table 4
).
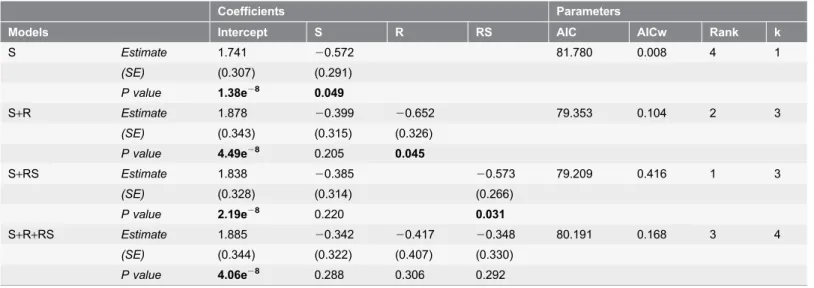
As for the relationship with research activities, the average number of months
with an operative research station was found to be the most significant (research
station ¡ SE 520.573¡0.266, p5 0.031, n592, AIC
w50.416;
Table 5
).
Moreover, significant association was evident for the presence of research alone as
a single test variable (
Table 5
).
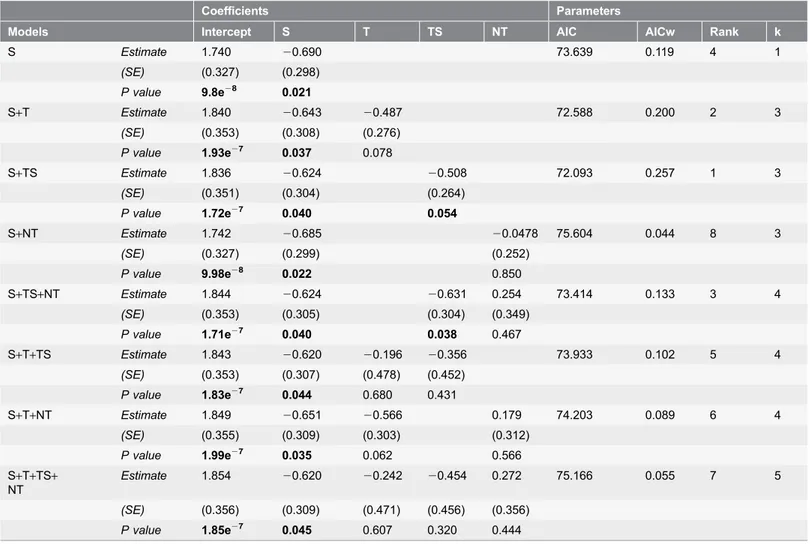
Concerning tourism activities, the model which included the average number of
months with the duration of an active tourist station best explained the relative
importance of tourism (tourist station ¡ SE52 0.508¡0.264, p5 0.054, n583,
Figure 3. Threats impact levels to 98 tropical African protected areas at a continental and regional scale. Clockwise from top: Africa (a), Central Africa (b), East Africa (c) and West Africa (d).AIC
w50.257;
Table 6
). In addition to the influence of the various conservation
activities, the larger size of the PA was associated with lower threat impact level.
This was shown in particular in models were it was present as a single predictor
variable but also in models with various test variables (
Tables 4
,
5
, and
6
).
Stepwise regression analysis also indicated that presence of guards, research
station, tourist station and PA size were the best predictor variables of threat
impact level (Table S6).
Discussion
PAs are fundamental for protecting natural resources and reducing biodiversity
loss. It is therefore crucial to document their level of effectiveness against the
multitude of threats that they are currently facing [
6
,
30
,
44
]. To our knowledge,
this study is a first comprehensive attempt to evaluate how specific anthropogenic
disturbances influence the ecological viability of PAs in Africa with tropical forest,
both at a continental and regional scale, and to analyse which particular
conservation actions are best suited to reduce threat impact levels.
Figure 4. Proportion of protected areas with conservation activities between 1990 and 1999 across different African regions. The number of protected areas with available information on presence and absence of any conservation activity (research, tourism and law enforcement guards) over the considered period were in total 105.
Threats distribution and degree of pressure
Our results indicate that only a few PAs in tropical Africa are better protected, in
particular in East Africa, while the rest are under considerable pressure from
anthropogenic threats, although the types of threats and degrees of influence vary
across regions. According to our analyses, hunting for bushmeat, agriculture and
logging are the most common threats with high impact levels.
Direct threats
Our findings clearly confirm that wildlife in PAs in tropical Africa is under more
pressure from hunting than any other threats [
6
,
13
]. At the continental level, we
found no particular differences between the impacts of commercial and
subsistence hunting on wildlife populations. Past studies show that hunters who
hunt for subsistence needs may often sell their wild game to local markets [
45
],
this was also shown by our correlation study.
Table 4. Influence of law enforcement activities and PA size on threat levels in 90 PAs.
Coefficients Parameters
Model variables Intercept S G NG MP AIC AICw Rank k
S Estimate 1.731 20.622 80.321 0.011 7 2 (SE) (0.310) (0.291) P value 2.54e28 0.032 S+G Estimate 2.062 20.576 20.962 73.672 0.306 1 3 (SE) (0.408) (0.329) (0.368) P value 4.35e27 0.079 0.009 S+NG Estimate 1.7311 20.627 0.0213 82.315 0.004 9 3 (SE) (0.310) (0.299) (0.271) P value 2.54e28 0.036 0.937 S+MP Estimate 1.803 20.575 20.449 79.916 0.014 6 3 (SE) (0.329) (0.296) (0.292) P value 4.59e28 0.052 0.124 S+NG+MP Estimate 1.826 20.635 0.275 20.576 81.127 0.007 8 4 (SE) (0.335) (0.305) (0.332) (0.323) P value 5.31e28 0.037 0.407 0.075 S+G+NG Estimate 2.137 20.703 21.153 0.433 73.752 0.294 2 4 (SE) (0.429) (0.348) (0.399) (0.352) P value 6.56e27 0.043 0.003 0.218 S+G+MP Estimate 2.109 20.624 21.353 0.478 74.389 0.214 3 4 (SE) (0.420) (0.337) (0.503) (0.418) P value 5.35e27 0.064 0.007 0.253 S+G+NG+MP Estimate 2.160 20.719 21.409 0.363 0.347 75.112 0.149 4 5 (SE) (0.436) (0.352) 0.511 (0.353) (0.432) P value 7.29e27 0.040 0.006 0.3033 0.422
In bold are highlighted significant values (p ,0.05). See abbreviations inTab 2. AIC, Akaike’s Information Criterion; AICw, Akaike Information Criterion weight; Rank, model rank from the smallest to the largest AIC value; k, number of variables including the intercept.
However, at a regional level, these hunting activities were found to be most
prevalent in West and Central Africa, supporting earlier studies [
46
,
47
].
Commercial hunting in Central Africa occurred at the highest impact level at 36%
more in relation to subsistence hunting. In contrast, subsistence hunting in West
Africa occurred at the highest level at 15% more than commercial hunting. The
combination of these two hunting activities has likely led in the past years to the
over-exploitation and even complete disappearance of wildlife in some regions in
West and Central Africa, known as the ‘‘empty forest syndrome’’, where forests
are often devoid of large mammals and birds [
13
,
48
,
49
]. In fact, over the last
decades West and Central Africa have been subject to rapid human population
growth and economic development. These along with the improved affordable
communications and logistics have increased demand for bushmeat, therefore
instigating higher levels of both subsistence and commercial bushmeat
[
50
,
51
,
52
]. Multiple lines of evidence from West Africa region indicate that
hunting has decreased populations of both large and small mammals (e.g.,
[
20
],[
46
],[
52
–
54
]), fish [
44
] and large raptors [
55
]. Instead the majority of PAs in
East Africa were under lesser high threat impact levels from hunting. Subsistence
hunting was the only type of hunting at the highest level for 7% of PAs. Such a
low percentage could be due to a more effective control of hunting or to
socio-cultural differences [
56
].
Indirect threats
According to our results, agriculture and logging exerted the highest impact on
wildlife in tropical PAs in Africa. In particular at the regional level, the impact of
these two land-use types was most prevalent in West Africa, followed by Central
and East Africa. These illegal land use activities have long been noted to cause
Table 5. Influence of research activities and PA size on threat level in 92 PAs.Coefficients Parameters
Models Intercept S R RS AIC AICw Rank k
S Estimate 1.741 20.572 81.780 0.008 4 1 (SE) (0.307) (0.291) P value 1.38e28 0.049 S+R Estimate 1.878 20.399 20.652 79.353 0.104 2 3 (SE) (0.343) (0.315) (0.326) P value 4.49e28 0.205 0.045 S+RS Estimate 1.838 20.385 20.573 79.209 0.416 1 3 (SE) (0.328) (0.314) (0.266) P value 2.19e28 0.220 0.031 S+R+RS Estimate 1.885 20.342 20.417 20.348 80.191 0.168 3 4 (SE) (0.344) (0.322) (0.407) (0.330) P value 4.06e28 0.288 0.306 0.292
In bold are highlighted significant values (p ,0.05). See abbreviations inTab 2. AIC, Akaike’s Information Criterion; AICw, Akaike Information Criterion weight; Rank, model rank from the smallest to the largest AIC value; k, number of variables including the intercept.
deforestation and forest degradation, to reduce the effective size of PAs and
increase faunal decline by facilitating hunters’ access to remote areas [
6
,
57
,
58
].
Logging often leads to clear-cutting, as it follows an economic value model that is
based on initially harvesting the most valuable tree species, and then on extracting
less valuable trees [
59
]. Agriculture will often expands inside PAs because farmers
aim to compensate for land that has become unproductive [
60
].
Settlements within or around a PA were also found to detrimentally impact
wildlife at high levels, in particular in West Africa, where they affected almost half
of all PAs.
Wildlife in Eastern African PAs were under lesser impact level from indirect
threats, with a high prevalence of impacts at levels 1 and 0.
Table 6. Influence of tourism activities and PA size on threat level in 83 PAs.
Coefficients Parameters
Models Intercept S T TS NT AIC AICw Rank k
S Estimate 1.740 20.690 73.639 0.119 4 1 (SE) (0.327) (0.298) P value 9.8e28 0.021 S+T Estimate 1.840 20.643 20.487 72.588 0.200 2 3 (SE) (0.353) (0.308) (0.276) P value 1.93e27 0.037 0.078 S+TS Estimate 1.836 20.624 20.508 72.093 0.257 1 3 (SE) (0.351) (0.304) (0.264) P value 1.72e27 0.040 0.054 S+NT Estimate 1.742 20.685 20.0478 75.604 0.044 8 3 (SE) (0.327) (0.299) (0.252) P value 9.98e28 0.022 0.850 S+TS+NT Estimate 1.844 20.624 20.631 0.254 73.414 0.133 3 4 (SE) (0.353) (0.305) (0.304) (0.349) P value 1.71e27 0.040 0.038 0.467 S+T+TS Estimate 1.843 20.620 20.196 20.356 73.933 0.102 5 4 (SE) (0.353) (0.307) (0.478) (0.452) P value 1.83e27 0.044 0.680 0.431 S+T+NT Estimate 1.849 20.651 20.566 0.179 74.203 0.089 6 4 (SE) (0.355) (0.309) (0.303) (0.312) P value 1.99e27 0.035 0.062 0.566 S+T+TS+ NT Estimate 1.854 20.620 20.242 20.454 0.272 75.166 0.055 7 5 (SE) (0.356) (0.309) (0.471) (0.456) (0.356) P value 1.85e27 0.045 0.607 0.320 0.444
In bold are highlighted significant values (p ,0.05). See abbreviations inTab 2. AIC, Akaike’s Information Criterion; AICw, Akaike Information Criterion weight; Rank, model rank from the smallest to the largest AIC value; k, number of variables including the intercept.
Conservation activities
Our results generally reinforce a previous study, which found that long-term
conservation efforts have a strong positive association with species conservation
status [
23
]. In this study we show that continuous presence of specific
conservation activities was associated with the lower threat impact level
assessments to PAs.
Law enforcement
Reduced levels of law enforcement are known to expose wildlife populations
within PAs to increased hunting pressure and other illegal activities [
23
,
61
,
62
].
The long-term presence of guards was found to have the strongest negative
relationship with the threat status to of PAs. Continuous law enforcement patrols
were associated with lower impact levels of threats to PAs, but these were of
weaker importance compared to other model variables. A patrol usually consists
of daily scouts, although evidence shows its effectiveness increases with training,
equipment (e.g., guns, patrol vehicles), greater distance covered and with budget
[
33
,
63
]. These latter variables were not included in the analyses, because such
information was difficult to obtain. The number of guards present was not
associated with lower threat impact levels. This may be because in some areas,
what matters is not how many guards are present but how effective they are,
which is likely to be determined by the strength of their motivation, whether they
are well-paid, well-trained and managed, and whether they have the resources to
adequately patrol PAs [
34
,
62
,
63
,
64
]. Lack of data also prevented us from
investigating the potential deterring effects of prosecution. Fines and penalties
vary across countries in Africa depending on both the level of illegality and on
national law. Depending on the seriousness of the crime, violators may be arrested
and handed to local authorities. Firearms, ammunition, snares, pit-saw and
camping materials may be confiscated or destroyed, along with bushmeat, wood
or other resources that have been extracted from the PA [
32
,
34
,
62
,
65
].
Nevertheless, records for penalising poachers are often poor, because wildlife
protection is rarely a national or even local priority [
66
]. Corruption can often be
an additional major problem that tempts poorly paid and resourced park
managers, guards and local authorities to disregard law, thus undermining
effective conservation programmes [
67
].
Tourism and research
Secondary conservation activities such as tourism and research can have indirect
effects for wildlife preservation [
68
]. We found that high impact threat levels were
less prevalent if a PA experienced higher proportions of months when tourism
and research stations were active.
Establishing a causal relation is however difficult. On the one hand, both
activities may play an important role in deterring hunters, thereby creating
‘‘wildlife refugia’’ [
61
,
69
,
70
,
71
], in raising employment opportunities and public
awareness on the value of conservation, therefore favoring lower threat impact
level [
72
]. On the other hand, one could argue that site security with less pressure
from threats may favor the development of both activities, given for instance
higher presence of wildlife that make their viewing easier and attractive to both
tourists and researchers.
The size of a PA had positive relationship on threat impact levels. Past studies
focussing on this variable have demonstrate that PAs with smaller size are more
vulnerable to threats and experience an accelerated habitat loss and wildlife
extinction rates in contrast to large areas [
22
,
73
].
Conclusion and recommendations
Overall, our study highlights deficiencies in the effectiveness of conservation
activities in controlling threats to the wildlife of several PAs across tropical Africa.
Our findings support existing evidence that the majority of African PAs are in a
critical state. At a regional level, East African PAs are under less threats pressure.
In contrast, Central and West African PAs are under significant anthropogenic
pressure, in particular Western PAs where several threatened wildlife species range
in endemic habitat and the investment in conservation management is extremely
low [
74
,
18
]. Among the 12 threats considered, hunting (for commercial and
subsistence purposes) and habitat degradation (agriculture and logging) were the
most intense.
Large mammals and birds are usually among the first animals to be affected by
these threats [
52
,
64
,
75
]. An over-exploitation and destruction of their habitat is
likely to lead them to local and global extinction. Many of these animals are key
for the survival of the ecosystem they inhabit, given their role in seed dispersal
[
32
,
76
,
77
]. Their extinction in tropical forest is likely to cause significant cascade
effects across the trophic web, thus causing secondary or co-extinctions and
consequently severe and irreversible changes to the ecosystem functioning [
78
].
Moreover, this study provides a first comprehensive continent-wide evaluation
of the relative importance of conservation activities against in mitigating threat
impact level for the protection of PAs in tropical Africa. Our findings show how
threat impact level on wildlife in a PA in tropical Africa is negatively influenced by
the continuous presence of conservation activities, such as guards, tourism and
research stations. This leads us to suggest the following priorities for management
decisions: (i) conservation activities should be sustained over the long-term and
that (ii) more sites for research and tourism could be developed as additional
benefits for the protection of wildlife. Such measures are only possible with the
provision of substantial long-term financial support and the full involvement of
local, national, and international stakeholders. Moreover, conservation efforts will
benefit from the training of national and international students and researchers, as
well as the involvement of local communities.
Although our study has not been able to measure an absolute level of impact on
the ground, it is a first quantified assessment of threat levels. An evidence-based
approach can allow quantifying and monitoring the success of such conservation
activities. PAs are one of the key conservation elements to conserve wildlife,
habitats, landscapes, and benefit local communities. Continuous and rigorous
monitoring on the ground is likely to increase the effectiveness of protection
activities over time by aiding adaptive management to reduce threats, to assess
wildlife status, and to improve park management.
Supporting Information
Figure S1. Threats and their impact level (1, 2, 3) in the different countries and
the number of PAs where they occur.
doi:10.1371/journal.pone.0114154.s001
(TIF)
Figure S2. Dendrogram showing the grouping of threats.
doi:10.1371/journal.pone.0114154.s002
(TIF)
Table S1. List of the 98 PAs. PA_ID is the protected area identity code. The
current name of the PAs is not provided due to confidentiality agreements with
some data providers. The code is composed by a two-letter ISO (International
Organization for Standardization) code and by a number (lowest to the highest
value according to their regional location from west to east). The PA size is
expressed per km
2.
doi:10.1371/journal.pone.0114154.s003
(DOC)
Table S2. Questionnaire template on threats impact level affecting biodiversity
within protected areas.
doi:10.1371/journal.pone.0114154.s004
(DOC)
Table S3. Questionnaire template on conservation activities.
doi:10.1371/journal.pone.0114154.s005
(DOC)
Table S4. Field description section on questionnaires related to conservation
activities.
doi:10.1371/journal.pone.0114154.s006
(DOC)
Table S5. Pearson correlations between all conservation activities. (in bold are
correlations with rho.0.50 and p ,0.0001)
doi:10.1371/journal.pone.0114154.s007
(DOC)
Table S6. Stepwise regression results.
doi:10.1371/journal.pone.0114154.s008
(DOC)
Text S1. Additional information on the methods section.
doi:10.1371/journal.pone.0114154.s009
(DOC)
Acknowledgments
We are grateful to William Laurance for his comments to the manuscript and to
Luis Arranz, Jesus Mba Ayetebe, Nsengiyunva Barakabuye and Terese Hart. In
addition, we thank John Fa, one anonymous referee and the editor for their
helpful comments.
Author Contributions
Conceived and designed the experiments: ST. Performed the experiments: ST.
Analyzed the data: ST. Contributed reagents/materials/analysis tools: ST MA-L
KA FA AA CB SB EB TB TMB GC RC CAC TRBD AD JD AE MEN GE TF SG AG
CH JAH JH MH IH TCH LHH BH HSK II SL-DY JL PM PML DM LM PKN AN
SN EN LN ZN-D RO-A BGO C-AP HJR SR OR AR CMS DTO AT YW VS. Wrote
the paper: ST MA-L KA FA AA CB SB EB TB TMB GC RC CAC TRBD AD JD AE
MEN GE TF SG AG CH JAH JH MH IH TCH LHH BH HSK II SL-DY JL PM
PML DM LM PKN AN SN EN LN ZN-D RO-A BGO C-AP HJR SR OR AR CMS
DTO AT YW VS.
References
1. Gibson L, Lee MT, Koh LP, Brook BW, Gardner TA, et al. (2011) Primary forests are irreplaceable for sustaining tropical biodiversity. Nature 678: 378–383.
2. Dirzo R, Raven RH (2003) Global state of biodiversity and loss. Annu Rev Environ Resour 28: 137–167. 3. Laurance WF (1999) Reflections on the tropical deforestation crisis. Biol Conserv 91: 109–117. 4. Sodhi NS, Brook BW, Bradshaw CJA (2007) Tropical conservation biology. Oxford: Blackwell
Publishers Limited. 332 p.
5. Laurance WF, Peres CA (2006) Emerging threats to tropical forests. Chicago: University of Chicago Press. 520 p.
6. Laurance WF, Useche CD, Rendeiro J, Kalka M, Bradshaw CJA, et al. (2012) Averting biodiversity collapse in tropical forest protected areas. Nature 489: 290–294.
7. Mahli Y, Adu-Bredu S, Asare AR, Lewis SL, Mayaux P (2013) African rainforests: past, present and future. Philos Trans R Soc London B 368: 1–10.
8. Chape C, Harrison J, Spalding M, Lysenko I (2005) Measuring the extent and effectiveness of protected areas as an indicator for meeting global biodiversity targets. Philos Trans R Soc London B 360: 443–445.
9. Jenkins CN, Joppa L (2009) Expansion of the global protected area system. Biol Conserv 142: 2166– 2174.
10. Coad L, Leverington F, Burgess N, Cuadros I, Geldmann J, et al. (2013) Progress towards the CBD Protected Area Management Effectiveness targets. PARKS 19: 1–12.
11. Wittemyer G, Elsen P, Bean WT, Coleman A, Burton O, et al. (2008) Accelerated human population growth at protected areas edges. Science 321: 123–126.
12. Newmark WD (2008) Isolation of African Protected Areas. Front Ecol Environ 6: 321–328.
13. Wilkie DS, Bennett EL, Peres CA, Cunningham AA (2011) The empty forest revisited. Ann N Y Acad Sci1223: 120–128.
14. Abernethy KA, Coad L, Taylor G, Lee ME, Maisels F (2013) Extent and ecological consequences of hunting in Central African rainforests in the twenty-first century. Philos Trans R Soc London B 368: 1–11. 15. Isaac NJ, Cowlishaw G (2004) How species respond to multiple extinction threats. Proc R Soc Lond B
271: 1135–1141.
16. DiMarco M, Buchanan GM, Szantoi Z, Holmgren M, Grottolo Marasini G, et al. (2014) Drivers of extinction risk in African mammals: the interplay of distribution state, human pressure, conservation response and species biology. Philos Trans R Soc London B 369: 1–13.
17. Bruner AG, Gullison RE, Rice RE, da Fonseca GAB (2001) Effectiveness of parks in protecting tropical biodiversity. Science 291: 125–127.
18. Craigie ID, Baillie JEM, Balmford A (2010) Large mammal population declines in Africa’s protected areas. Biol Conserv 143: 2221–2228.
19. Oates JF, Abedi-Lartey M, McGraw SW, Struhsaker TT, Whitesides GH (2000) Extinction of a West African red colobus monkey. Conserv Biol 14: 1526–1532.
20. Campbell G, Kuehl H, N’Goran PK, Boesch C (2008) Alarming decline of West African chimpanzees in Cote d’Ivoire. Curr Biol 18: 903–904.
21. Greengrass EJ (2009) Chimpanzees are close to extinction in Southwest Nigeria. Primate Conservation 24: 1–7.
22. Brashares JS, Arcese P, Sam MK (2001) Human demography and reserve size predict wildlife extinction in West Africa. Proc R Soc Lond B 268: 2473–2478.
23. Tranquilli S, Abedi-Lartey M, Amsini F, Arranz L, Asamoah A, et al. (2012) Lack of Conservation effort rapidly increases African great ape extinction risk. Conserv Lett 5: 48–55.
24. Sinclair ARE, Arcese P (1995) Serengeti II: dynamics and management, and conservation of an ecosystem. Chicago: University of Chicago Press. 673 p.
25. Hilborn R, Arcese P, Borner M, Hando J, Hopcraft G, et al. (2006) Effective enforcement in a conservation area. Science 314: 1265–1266.
26. Wilkie D, Carpenter JF, Zhang Q (2001) The under-financing of protected areas in the Congo Basin: so many parks and so little willingness-to-pay. Biodivers Conserv 10: 691–709.
27. Leader-Williams N, Albon SD (1988) Allocation of resources for conservation. Nature 336: 533–535. 28. Blom A (2004) An estimate of the costs of an effective system of protected areas in the Niger Delta –
Congo Basin Forest Region. Biodivers Conserv 13: 2661–2678.
29. Hockings M (2003) Systems for assessing the effectiveness of management in protected areas. BioScience 53: 823–832.
30. Geldmann J, Barnes M, Coad L, Craigie ID, Hockings M, et al. (2013) Effectiveness of terrestrial protected areas in reducing habitat loss and population declines. Biol Conserv 161: 230–238. 31. Blom A, van Zalinge R, Mbea E, Heitko¨ nig IMA, Prins HHT (2004) Human impact on wildlife
populations within a protected Central African forest. Afr J Ecol 42: 23–31.
32. Remis MJ, Kpanou JB (2010) Primate and ungulate abundances in response to multi-use zoning and human extractive activities in a Central African Reserve. Afr J Ecol 49: 70–80.
33. Plumptre AJ, Masozera M, Vedder A (2001) The impact of civil war on the conservation of protected areas in Rwanda. Washington, D.C.: Biodiversity Support Program, World Wildlife Fund Inc. 31 p. 34. Jachmann H (2008) Monitoring law-enforcement performance in nine protected areas in Ghana. Biol
Conserv 141: 89–99.
35. IUCN (2013) IUCN Red List of Threatened Species. Version 2013.2. Available:www.iucnredlist.org. Accessed 19 December 2013.
36. Baayen RH (2008) Analyzing linguistic data. Cambridge: Cambridge University Press. 368 p. 37. Zar JH (1999) Biostatistical analysis. New Jersey: Prentice Hall. 663 p.
38. Buckland ST, Burnham KP, Augustin NH (1997) Model selection: an integral part of inference. Biometrics 53: 603–618.
39. Johnson JB, Omland KS (2004) Model selection in ecology and evolution. Trends Ecol Evol 19: 101– 108.
40. Symonds MRE, Moussalli A (2011) A brief guide to model selection, multimodel inference and model averaging in behavioural ecology using Akaike’s information criterion. Behav Ecol Sociobiol 65: 13–21. 41. R Development Core Team (2010) R: a language and environment for statistical computing. R
Foundation for statistical computing. Vienna: Austria.
42. Bates D, Maechler M (2010) Lme4: Linear mixed-effects models using S4 classes. R package version 0.999375–34.
44. Leverington F, Costa KL, Courrau J, Pavese H, Nolte C, et al. (2010) Management effectiveness evaluation in protected areas. A global study. The University of Queensland, Brisbane: Australia. 192 p. 45. Nasi R, Taber A, Van Vliet N (2011) Empty forests, empty stomachs? Bushmeat and livelihoods in the
Congo and Amazon Basins. International Forestry Review 13: 355–368.
46. Brashares JS, Arcese P, Sam MK, Coppolillo PB, Sinclair ARE, et al. (2004) Bushmeat hunting, wildlife declines, and fish supply in West Africa. Science 306: 1180–1183.
47. Kuehl HS, Nzeingui C, Le Duc Yeno S, Huijbregts B, Boesch C, et al. (2009) Discriminating between village and commercial hunting of apes. Biol Conserv 142: 1500–1506.
48. Redford KH (1992) The empty forest. Bioscience 42: 412–422.
49. Scholte P (2011) Towards understanding large mammal population declines in Africa’s protected areas: a West-Central African perspective. Trop Conserv Sci 4: 1–11.
50. Juste J, Fa JE, De Val JP, Castroviejo J (1995) Market dynamics of bushmeat species in Equatorial Guinea. J Appl Ecol 32: 454–467.
51. Barnes RFW (2002) The bushmeat boom and bust in West and Central Africa. Oryx 36: 236–242. 52. Fa JE, Brown D (2009) Impacts of hunting on mammals in African tropical moist forests: A review and
synthesis. Mamm Rev39: 231–264.
53. Gonedele´ Bi S, Kone I, Bitty AE, Bene Koffi JC, Akpatou B, et al. (2010) Distribution and conservation status of Catarrhine primates in Cote d’Ivoire (West Africa). Folia Primatol. 83:11–23. 54. Henschel P, Coad L, Burton C, Chataigner B, Dunn A, et al. (2014) The lion in West Africa is critically
endangered. PLoS ONE 9: 1–11.
55. Thiollay JM (2007) Raptor declines in West Africa: comparisons between protected, buffer and cultivated areas. Oryx 41: 322–329.
56. Chape S, Spalding M, Jenkins MD (2008) The world’s protected areas. Berkeley: University of California Press.
57. Beier P, Van Drielen M, Knkam B (2002) Avifaunal collapse in West African forest fragments. Conserv Biol 16: 1097–1111.
58. Holbech LH (2005) The implications of selective logging and forest fragmentation for the conservation of avian diversity in evergreen forests of south-west Ghana. Bird Conserv. Int. 15: 27–52.
59. Zimmerman BL, Kormos CF (2012) Prospects for sustainable logging in tropical forests. Bioscience 62: 479–487.
60. Norris K, Asase A, Collen B, Gockowski J, Mason J, et al. (2010) Biodiversity in a forest-agriculture mosaic - the changing face of West African rainforests. Biol Conserv 143: 2341–2350.
61. De Merode E, Inogwabini BI, Telo J, Panziama G (2007) Status of elephant populations in Garamba National Park, Democratic Republic of Congo, late 2005. Pachyderm 42: 52–57.
62. Jachmann H. (2008) Illegal wildlife use and protected area management in Ghana. Biol Conserv 141: 1906–1918.
63. N’Goran PK, Boesch C, Mundry R, N’Goran EK, Herbinger I, et al. (2012) Hunting, law enforcement, and African primate conservation. Conserv Biol 0: 1–7.
64. Keane A, Jones JPG, Edwards-Jones G, Milner-Gulland EJ (2008) The sleeping policeman: understanding issues of enforcement and compliance in conservation. Animal Conservation 11: 75–82. 65. Mubalama L (2010) Monitoring Law Enforcement Effort and Illegal Activity in Selected Protected Areas: Implications for Management and Conservation, Democratic Republic of Congo. PhD Thesis. Ghent University: Belgium. 374 p.
66. Hodgkinson C (2009). Tourists, gorillas and guns: integrating conservation and development in the Central African Republic. PhD thesis. University College London, London: UK. 325 p.
67. Sutherland WJ, Adams WM, Aronson RB, Aveling R, Blackburn TM, et al. (2009) One hundred questions of importance to the conservation of global biological diversity. Conserv Biol 23: 557–567.
68. Terborgh J, Pitman N, Silman MR, Schichter H, Nunez VP (2002) Maintenance of tree diversity in tropical forests. In: Levey DJ, Silva WR, Galetti M, editors. Seed dispersal and frugivory: ecology, evolution and conservation. Wallingfod, UK: CAB International. pp. 1–18.
69. Campbell G, Kuehl H, Diarrassouba A, N’Goran PK, Boesch C (2011) Long-term research sites as refugia for threatened and over-harvested species. Biol Lett 7: 723–726
70. Sommer V, Ross C (2011) Exploring and protecting West Africa’s primates: the Gashaka Primate Project in context. In: Sommer V, Ross C, editors. Primates of Gashaka. Socioecology and conservation in Nigeria’s biodiversity Hotspot. New York: Springer. pp. 1–23.
71. Laurance WF (2013) Does research help to safeguard protected areas? Trends Ecol. Evol. 28: 261– 266.
72. Davenport L, Brockelman WY, Wright PC, Ruf K, Rubio del Valle FB (2002) Ecotourism tools for parks. In: Terborgh J, van Shaik C, Davenport L, Rao M, editors. Making parks work. Washington DC: Island Press. pp. 279–306.
73. Maiorano L, Falcucci A, Boitani L (2008) Size-dependent resistance of protected areas to land-use change. Proc R Soc Lond B 275: 1297–1304.
74. Oates JF (1999). Myth and Reality in the Rain Forest. Berkeley: University of California Press. 338 p. 75. De Merode E, Homewood K, Cowlishaw G (2004) The value of bushmeat and other wild foods to rural households living in extreme poverty in Democratic Republic of Congo. Biol Conserv 118: 573–581. 76. Stoner KE, Vulinec K, Wright SJ, Peres CA (2007) Hunting and plant community dynamics in tropical
forests: a synthesis and future directions. Biotropica 39: 385–392.
77. Wright SJ, Stoner KE, Beckman N, Corlett RT, Dirzo R, et al. (2007) The plight of large animals in tropical forests and the consequences for plant regeneration. Biotropica 39: 289–291.
78. Terborgh J, Estes JA (2010) Trophic cascades: predators, prey and changing dynamics of nature. Washington: Island Press. 488 p.