Contents lists available atScienceDirect
Applied Energy
journal homepage:www.elsevier.com/locate/apenergy
Developing two benchmark models for nearly zero energy schools
Shady Attia
a,⁎, Niloufar Shadmanfar
a,b, Federico Ricci
a,caSustainable Building Design Lab, Dept. UEE, Faculty of Applied Science, Université de Liège, Belgium bDipartimento di Architettura, Ingegneria delle Costruzioni e Ambiente Costruito, Politecnoco Di Milano, Italy cScuola Politecnica, Universita degli studi di Genova, Italy
H I G H L I G H T S
•
Development of two Belgianbench-mark models for nearly Zero Energy Schools.
•
Average energy use intensity perschool (primary and secondary) was
59 and 42 kWh/m2/year.
•
Models validated with four-yearmon-itoring data on energy consumption.
•
Nearly Zero Energy Schools needs arecooling and electricity dominated.
•
Findings on energy needs and usein-tensity are useful in temperate and continental climates.
G R A P H I C A L A B S T R A C T
A R T I C L E I N F O Keywords:
Reference building Nearly zero energy building Energy audit
Energy efficiency Energy use intensity Temperate climate
A B S T R A C T
The aim of this study is to develop an energy performance data set and two building performance simulation benchmark models for high performance schools in Belgium. The study reports the results of an inventory and field survey conducted on nearly Zero Energy Schools (nZES) and Passive House Schools (PHS) constructed after year 2013. An analysis of energy consumption (electricity and natural gas) and a walkthrough survey were conducted during May 2018. The energy consumption analysis was done for the occupancy period of 2015–2018 based on monthly consumption data. Two building performance simulation models are created in EnergyPlus to benchmark the average energy consumption and building characteristics. The validity of the estimate has been further checked against the public statistics and verified through model calibration and utility bill comparison. The paper provides a timely opportunity to evaluate the real performance of nZES, in relation to design
as-sumptions and how schools’ professionals can turn the energy performance gap challenge to their advantage.
Thefindings on energy needs and use intensity are useful in temperate and continental climates.
https://doi.org/10.1016/j.apenergy.2020.114614
Received 26 November 2019; Received in revised form 19 January 2020; Accepted 4 February 2020
Abbreviations: ANN, Artificial Neural Networks BPIE, Building Performance Institute Europe; BMS, Building Management System; CAV, Constant Air Volume; CDD, Cooling Degree Days; CBECS, Commercial Buildings Energy Consumption Survey; CIBSE, Chartered Institution of Building Services Engineers; CO2, Carbon Dioxide;
COP, coefficient of performance; CV(RMSE), Coefficient of Variation of the Root Mean Square Error; DHW, Domestic Hot Water; EPBD, European Energy
Performance of Buildings Directive; EU, European Union; EUI, Energy Use Intensity; GDPR, General Data Protection Regulation; HDD, Heating Degree Days; HVAC, Heating, Ventilation and Air Conditioning; IAQ, Indoor Air Quality; IEQ, Indoor Environmental Quality; MBE, Mean Bias Error; MVHR, Mechanical ventilation with heat recovery; nZEB, nearly Zero Energy Building; nZES, nearly Zero Energy Schools; OCCuPANt, On the Impacts Of Climate Change on the indoor environmental and energy PerformAnce of buildiNgs in Belgium during summer; PC, Personal Computer; PHS, Passive House Standard; PHPP, Passive House Planning Package; PMP,
Platform Masion Passive (Belgium); Pixii, Onafhankelijk Kennisplatform Energieneutraal Bouwen (Belgium); QZEN, Quasi Zero Energie; SHGC, Solar Heat Gain Coefficient;
TABULA, Building Database Typology in the European Union; TMY, Typical Meteorological Year; UK, United Kingdom; USA, United States of America; VAF, Variable Air Flow; WWR, Window to Wall Ratio; ZEBRA 2020, nearly Zero-Energy Building Strategy 2020
⁎Corresponding author at: University of Liège, Faculty of Applied Science, Dept. UEE, SBD Lab: Office +0/542, Quartier Polytech 1, Allée de la Découverte 13A,
4000 Liège, Belgium.
E-mail addresses:[email protected](S. Attia),[email protected](N. Shadmanfar),[email protected](F. Ricci).
0306-2619/ © 2020 Elsevier Ltd. All rights reserved.
1. Introduction
The European Energy Performance of Buildings Directive (EPBD) requires all new buildings (public buildings from 2019) to be nearly zero-energy buildings (nZEB) by 31 December 2020. Already since 31 December 2018, new buildings occupied and owned by public autho-rities should be nZEB. This is a result of a long incremental regulation evolution starting with the EPBD 2010 [1]and ending with the EU Directive 2018/844 of the European Parliament[2]and the Council of 30 May 2018, who amended the Directive 2010/31/EU on the energy performance of buildings and the Directive 2012/27/EU on energy ef-ficiency. The nearly zero or very low amount of energy required should be covered to a very significant extent from renewable sources, in-cluding sources produced on-site or nearby. For the building sector, this implies the large scale deployment of nearly Zero-Energy Buildings (nZEBs). Combining renewable energy and resource efficiency can play an important role in the transition of the European society and economy towards sustainability and carbon neutrality[3].
One of the fastest growing sectors in Europe is educational build-ings. According to Eurostat data (2018), the annual student population growth rate is expected to be around 3 percent until 2050. Before 2050, all member states will need to assure a minimumfloor area growth of 0.5%. This means that at least 4 million square meters of new class-rooms space. Thisfigure represents more than 40,000 new classrooms. All these new classrooms need to be integrated into new schools in addition to the schools that needs to be renovated require innovative energy saving and indoor environmental quality solutions to demon-strate a commitment to reducing climate impacts, lower energy cost and over time save money on energy bills that can be spent on almost 100 million students[4].
Several national and regional governments have a target date of 2021 for every new school to be actively working on becoming energy neutral. Like every European Union (EU) member state, Belgium had to source 20% of its energy from renewable sources by 2020. Therefore, school buildings represent a significant part of the buildings stock. As shown inFig. 1, education buildings are responsible of 1.5 percent of Belgium’s greenhouse gas emissions. In Belgium (2017), almost 3 mil-lion people attend one of the 6000 schools every day. Two regional governments decided to be front runners with nearly zero energy schools (nZES) [5]. In 2008, the Flemish gave the green light to the 'Passive Schools Pilot Project: building schools according to the Passive
House standard spread across all provinces and educational networks in Flanders. This corresponds to a total construction area of 65,565 m2. Herewith, the Flemish Government wanted to anticipate in time the transition to highly energy-efficient school buildings and the strict European regulations that were still being drafted [6]. Similarly, in 2009 the Brussels government passed an order imposing the passive standard on all regional new public buildings by 2010, and on May 3, 2011 adopted new energy target regulation for all new construction (housing, offices and schools) by 2015. The EPBD recast directive im-posed the nearly zero energy standard, and the passive standard be-came an importantfirst step towards achieving the zero energy schools. It was until 2017, when the government of Wallonia, the third region of Belgium, decided to adopt the same approach in Flanders and Brussels Regions.
As a result of those initiatives and projects, the Passive House concept was strongly adopted in Belgium and evolved to be nearly Zero Energy Building concept (BEN-‘Bijna-energieneutraal' and Q-ZEN-‘Quasi Zéro Energie’) [7]. And, between 2013 and 2019, more than 50 new nZES were constructed. However, local governments [8], building professionals and scientist are challenged by how to evaluate those new schools[9]. Several international state agencies seek to build and assure the performance of green healthy schools including, for example, Bel-gium[10], Chile[11], Greece[12]and the Netherlands[13]. nZES are high-tech buildings that try balance the high indoor air quality and comfort conditions while keeping the ultra-low energy use target[14]. The determination of the boundary conditions and design strategies and solutions for those schools remains challenging[15]. In the same time, little effort was made to assess those school buildings and benchmark their performance[13].
The concept of ‘reference building’ has been introduced by the EPBD-recast[1]for the development of a reference building that re-presents the typical and average building of the stock[16]. According to the Commission Guidelines accompanying the Commission Dele-gated Regulation No. 244 (2012) [17], it is recommended that re-ference buildings are established representing the most typical building in a specific category (e.g. type of use and reference occupancy pattern orfloor area or building envelope construction etc.). Several examples of benchmarking studies for education building already exist including the work of Khoshbakht 2018 in Australia[18], Pereira 2017 in Por-tugal[19], Thewes 2014[20]in Luxembourg, Kim 2012 in South Korea [21], Dascalaki. 2011[16], Dimoudi. 2009[22]and Martinopoulos in
Greece[23], and Hernandez. 2008 in Ireland[24]. Yet, none of those studies addressed benchmarking nZES based on a wide-set of building data. Despite the wide use of the Commercial Buildings Energy Con-sumption Survey (CBECS) database in the USA[25]and the TABULA building typology database in EU, there is no database for nZES[26].
Thus, a substantial knowledge gap in reliable benchmark models for high performance schools makes it difficult for policy-makers and building professionals worldwide to evaluate the success of their po-licies and designs[24]. Several European Member states do not have historical data for schools energy performance or benchmark models for evaluating building energy performance[27]. Therefore, the aim of this paper is to understand and characterize the energy performance of nearly zero energy schools by developing a benchmark model. Thefirst objective of this study is to conduct afield survey that reports building characteristics and end use energy pattern and energy cost. The second objective is creating a valid and up-to-date benchmark model of nearly zero energy schools in Belgium. Despite the acknowledged importance of building benchmarks and their validity, in literature[28], so far only limited attention has been paid to establish robust, credible and simple building performance models[29].
By reviewing literature we can distinguish two groups of publica-tions that addressed benchmarking of building’s performance[30]. The first group entails studies that aimed to characterize buildings around clusters of similar performance using advanced clustering analysis methods based on large samples of observations/buildings [31]. For example, Santamouris 2007 used a fuzzy clustering technique to ana-lyze 320 schools in Greece[32]. The examined schools were built be-tween 1979 and 1996 and focused on identified the Energy Use In-tensity (EUI) and indoor environmental quality (IEQ). Gao 2014, proposed a new clustering methodology using a machine learning al-gorithm to classify buildings based on 1964 observation/building sample from the United States of America Commercial Buildings Energy Consumption Survey (CBECS) [33]. The study focused mainly on testing the methodology in comparison to the Energy Star approach. Similarly, Papadopoulos 2018 conducted a cluster analysis of approxi-mately 15,000 properties in New York between 2011 and 2016[34]. Using a learning algorithm two distinct temporal patterns of energy performance for commercial and residential buildings were identified. Also, the study of Hong 2014 belongs to this group one because sta-tistical methods in combination with artificial neural networks (ANN) were used to identify the factor that have significant impact on energy use in schools[35]. However, this study did not perform a clustering analysis. The statistical analysis was performed for approximately 7700 schools and ANN analysis was performed for 465 schools. The study was based on an extremely large sample of schools constructed between 1860 and 2010 in the United Kingdom.
The second group of publications entails studies that aimed to characterize building using general statistical methods. For example, Luo (2017) developed a general statistical method using 24-h electric load shapes of over 2000 small-and medium-sized businesses for benchmarking[36]. The study focused on identifying a representative building load. The load shape benchmarking was thefinal outcome of this study for cooling dominated buildings in California, USA. Similarly, Park (2016) used various statistical techniques based on data collected from 1072 office buildings in South Korea[37]. The results grouped the buildings under six categories. Also, Marrone (2018) created an energy benchmark for educations buildings in Italy through cluster analysis of energy retrofitting[38]. The study was based on 80 refurbished school buildings and focused mainly on renovation measures.
The two groups of publications presented above represent studies that aimed to characterize buildings according to similarity. However, they did not aim to create full descriptions or present building perfor-mance simulation benchmark models. Also, none of the presented stu-dies addressed high performance schools. Despite the study of Santamouris (2007) and Hong (2014)[35]who focused on schools, both studies did not address nZES[32]. Considering the overview of literature, it is clear that are currently no available building simulation benchmark models for nZES.
In this paper, we present two simulation reference models created based on monitoring and analyzing 30 high performance schools in Belgium. Our study approach and methodology is similar to the work of Hernandez (2007)[24], Torcellini (2008)[39], and Attia (2012)[40] aiming to develop two benchmark buildings that represent most of newly built school building stock, representing the climate of Belgium between 2015 and 2018. The reference models are documented and implemented to use with the EnergyPlus energy simulation program. Although the authors are aware of the importance of indoor environ-mental quality issues in nZES buildings, they were not considered in this paper. The indoor environmental quality evaluation of nZES is a large field of investigation that we opted to address separately in a future study. Therefore, this study focuses on benchmarking energy use in high performance schools in Belgium.
In the same time, the paper provides valuable contribution to the new body of knowledge from the international perspective.). The study is useful for cities that are heating dominated such as Brussels, which had 2381 Heating Degree Days (HDD) and 38 Cooling Degree Days (CDD), in 2018[41]. The study provides insights on the energy per-formance discrepancies of nearly Zero Energy Schools in cold and mild temperate climates (Cfb = Temperate oceanic climate) as-well-as continental climates (Dfb = Warm-summer humid continental climate) according to Köppen climate classification (seeFig. 2). Cities falling in those two regions will be able to improve their understanding of the
energy consumption of high performance schools and how they can better monitor and control it. The study results reports a significant change of the nature of energy needs of high performance schools to-wards cooling domination. Therefore, our benchmark can be used in those climates to better compare and verify the energy savings. The aim is to evaluate the market uptake of nZES and provide real performance reference data that can be beneficial for policy and investment man-agers, clients, architects, engineeringfirms and contractors.
2. Methodology
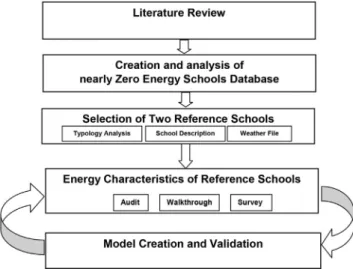
The research methodology is based on creating representative re-ference models for nearly-zero energy primary and secondary schools in Belgium. As shown in Fig. 3, the methodology implemented in this paper followed a mixed approach involving empirical monitoring and modeling techniques. The literature review andfield visits of recently built schools allowed creating a database of nearly-Zero Energy Schools (nZES). The analyses allowed selecting two representative reference schools and determining their energy consumption and characterize their building performance systems and occupant’s behavior. A full energy audit and a three years energy monitoring allowed generating high quality data. This data was then analyzed and used to create two building performance models. The model was calibrated and validated based on the monitored data. The methodology followed in this re-search is similar to other recent international energy modeling and benchmarking studies[40]. The methodology is similar to the approach of Vasconcelos (2015)[42]who defined a reference building for Por-tugal and Pagliano (2016) who developed a reference model for child care centers in Italy[43]. The following sections describe in detail the steps undertaken in this research.
2.1. Literature review
A literature review was conducted including recent international publications that aimed to develop energy performance benchmarks for school buildings. The publications included scientific manuscript that focus on building energy ratings in European schools. The initial Scopus and Web of Science research resulted in more than 40 publications that are relevant to school’s energy efficiency benchmarking. Then, the re-search scope and focus were narrowed to Passive House schools and nZES resulting in 12 reviewed papers. The publication information was used to contextualize the research in the introduction and discussion section.
This was followed by a local literature review, in the Belgian con-text. In Belgium, schools can be categorized under three groups:
•
Schools owned by the communities (Flemish and French speaking);•
Subsidized public schools (subsidies by provinces andmunici-palities);
•
Subsidized free schools (mainly organized by an organization af-filiated to the Catholic Church).The latter is the largest group, both in number of schools and in number of pupils. The review involved collecting data on energy effi-ciency from governmental[44]and non-governmental documents[45] (reports[46], magazines[47], television programs, etc.), from formal interviews and pilot studies[48]. The results of the literature review are presented inSection 1.
2.2. Creation of a data base for nearly Zero energy schools in Belgium The current study follows a cross-sectional study design where in-formation was collected from literature and using a survey. An initial database with forty-eight nZES was created to cover the three geo-graphic regions of Belgium (Brussels, Flanders and Wallonia). The da-tabase included schools that are built after 2013 and comply or exceed
the requirements of the Belgian Passive House Standard (PHS)[49,50]. The Belgian nearly Zero Energy Building concept has different technical requirements compared to the German concept[51]. The PHS requires a highly insulated and airtight envelope (an air permeability of less than of 0,6 vol/h at 50 Pa)[52]with a net heating energy demand and net cooling energy demand≤15 kWh/m2 year[44]. The energy
de-mand for heating and cooling should be calculated using a quasi-steady state calculation method, which is the Passive House Planning Package (PHPP) 2007[53]. The school should include mechanical ventilation with heat recovery (MVHR) [54]. While a zone is considered over-heated when 5 percent of its occupied period, exceeds 25 °C[55] (in-door temperature[15]). The selection criteria involved schools with onsite energy generation system including solar electric and thermal systems and heat pumps. According to the Belgian definition of Passive House, a heat pump is considered as source of renewable energy[56]. The initially screened schools included kindergarten (3–6 year) or pre-primary, primary (6–12 year) and secondary (12–18) schools. The school bidding system or schools delivery process across most of the European member states is based on this classification[57]. The data-base included several details on each school such as the location, con-struction age, occupancy density, measured energy heating and cooling, energy use intensity, energy performance certificate details, measured envelope airtightness, compactness of geometry and construction cost. In this stage, the database was compiled, and missing data was com-pleted through field visits and phone or email communication, for standardization. The data collection and analysis were done in line with the European Union General Data Protection Regulation (GDPR)[58]. Afinal list and complete list of thirty schools was created with a focus on energy efficiency and cost for nZESs for the period from 2015 to 2018. The analysis of the collected data involvedfinding a correlation between the schools’ performances and construction costs in relation to the building performance characteristics.
2.3. Selection of the representative reference schools
According to literature, there are three main approaches to create reference models[16]. Thefirst and the most common approach is to create theoretical reference models based on statistical data of the en-ergy performance or thermal comfort of similar building typologies and functions in similar climates. In this approach, a typical meteorological weatherfile can be used. The second approach is to create a reference model based on one specific and monitored building. This approach is called real reference models. In this approach, a specific weather file needs to be created representing the year the monitoring took place. The third approach is called ideal reference models and seeks to create a reference model based on experts’ estimation of input parameters. The
ideal building model, defined based on experts’ inquiries and assump-tions. In this approach, a typical meteorological weatherfile can be used. Based on the source and type of collected data used modelers can select the type of reference models.
For this study, thefirst modeling approach (theoretical reference models) was selected because the collected data for the thirty nZESs is representative and abundant. Out of forty-eight nZESs schools a stan-dardized database of thirty schools was created. The sample size was narrowed down in relation to the data accuracy and completion. The database represents the school construction technology commonly ap-plied between 2013 and 2019, in the three regions of Belgium. The common building characteristics and performance patterns could be identified, and cross discipline analysis was possible. In this sense, this study followed the same approach found in already several recent in-ternational studied such as the work of Hernandez in the UK [24], Santamouris in Greece[32], Attia in Egypt[40], Beusker in Germany [59]and Gil-Baez in Spain[60].
A typology analysis took place for the thirty schools to select two representative building configurations. Most investigated schools were in urban areas. Plans and forms of thirty school configurations were described and analyzed. Brussels typical meteorological year was se-lected to perform the simulations. A TMY3 derived from 1991 to 2005 period was used (BEL_Brussels.064510_IWEC)[61]. Belgium is a rela-tively small country that covers an area of 30,688 km2. The country falls almost completely within Köppen-Geiger classification (Cfb) of temperature oceanic climate with no dry season and warm summer [62]. A part of the east side falls in the (Dfb) cold climate, but no school was in this part. Belgium is heating dominated with an average of 2941 Heating Degree Days (HDD) and 90 Cooling Degree Days (CDD), be-tween 2014 and 2019 (base temperature 15 °C in the HDD calculation and 24 in CDD calculation) [41]. Overall, the climate in Belgium is mild-cold and humid with significant amount of rainfall during the year. Needless to say, we acknowledge that Köppen-Geiger climate classification is adapted to vegetation for which the rain is most im-portant and may not be best adapted to energy use in buildings. However, it is the most popular and universally used classification method in association with building energy use.
2.4. Energy characteristics of representative schools
Two types of energy audit were conducted for the selected school buildings [63]. An analysis of energy consumption (electricity and natural gas) and a walkthrough survey were conducted during May 2018. The energy consumption analysis was done for the occupancy period of 2015–2018 based on monthly consumption data. This step allowed understanding the building performance and identifying the pattern of use, peak demand and seasonal climate impact. The second type of audit was based on walkthrough visits to identify and char-acterize the energy systems (MVHR, air and water heating systems, heating, ventilation and air conditioning system (HVAC), renewable energy systems, lighting, plug loads and pumps). This was followed by the characterization of the envelope aiming to identify the construction composition, air tightness, window types and solar protection.
After conducting both audits a smart phone-based survey was used to identify the occupancy density and profiles in classrooms based on a seasonal, monthly, weekly and daily level. The survey addresses school teachers and students. The survey sampling was seeking to create in-dicative information on occupancy and a statically representative characterization. The sampling design consists of a random sample. A free and open-source application was used to collect the data and up-load it on a cloud. Once a repetition of the answers pattern was found the request of occupancy information input was stopped. 31 re-spondents completed the questionnaires in May 2018. The collected data was compiled and analyzed to reflect the energy performance of representative and realistic classroom operation situations when the mechanical ventilation, space heating and space cooling are turned on.
It was very important to identify the building automation systems programing functions, control strategies and sensors parameters. Unfortunately, the data on the renewable energy production was in-complete; therefore, it was not included in the results. To facilitate the understanding of the results of the buildings energy characterization, the results were grouped under four major topics, as described below: 2.4.1. Occupancy density and profiles
Data was uploaded into a database that is used to store geo-referenced information, which is then used to analyze occupancy in-formation for the classrooms. Data from all surveyed, quantitative and qualitative sources was analyzed holistically to ensure data integration across all sectors. The annual occupancy schedule has been set based on the Flemish and Walloon 2018–2019 annual teaching schedule because most of the case studies were in this region. The holidays have been subtracted from the occupancy schedule.
2.4.2. HVAC systems and comfort set points
A special section in the energy audit involved characterizing the HVAC systems and energy source. Description of energy-using systems and components included fan, pump, air handling unit, heat recovery unit, etc. The Domestic How Water use (DHW) and consumption was identified from water meters and the delivered water temperatures were measured. The airflow rate of the MVHR system was measured during different moments of the day to estimate the mechanical ven-tilation schedule. Also, the Building Management Systems (BMS) was checked and the required data points for comfort control and man-agement built and connected tofield devices were reviewed. The pro-gramming and set point conditions for air conditioning and boilers were identified.
2.4.3. Lighting load intensity
Lighting of common areas (fire stairs, car parks, corridors, foyers) and classrooms was reviewed and occupancy control was identified. The luminaire type has been described, and it has been supposed that all the lighting equipment in the school were recessed. According to the Lighting Handbook the radiant fraction emitted is equal to 0.37 and the visible fraction to 0.18[64].
2.4.4. Plug load intensity and schedules
An inventory of electrical appliances took place to determine the plug load intensities and their operation schedules. The average class electrical appliances presence was determined based on thefield survey and walkthrough audit. The unit capacity of the continuously plugged appliances and standby power appliances and the average running hours of each appliance were determined with reference to the col-lected survey data and appliance catalogues. To facilitate and unify the communication of plug loads for the estimated model, all appliance powers were summarized under one unit of power density.
2.5. Development of the benchmark models
Two representative simulation models were made based on the previously described selection process and building characterization. The validity of the estimate has been further checked against the public statistics and verified through a model calibration and utility bill comparison.
The simulations have been performed through the dynamic energy modeling software tool EnergyPlus (Version 8.2.0) [65]. Calibration was done for evaluating the goodness of-fit of the school buildings energy models according to ASHRAE Guideline 14[66]. The guideline introduces three basic methods to estimate energy use and savings that result from the efficiency measures: the whole building approach, the retrofit isolation approach and the whole building calibrated simulation approach (calibrated simulation). The latter approach was selected for this study. The ASHRAE Guideline 14 uses two indices to evaluate the
Table 1 List of nearly zero energy schools (primary and secondary). School Building Type Construction Date Surface [m 2] Pupils Occ. Density [m 2/student] Heating Energy Use [kWh/ m 2* year] Cooling Energy Use [kWh/ m 2* year] Energy Use Intensity [kWh/ m 2/year] E-level * Airtightness [n50] Compactness [m 3/m 2] K-level ** Cost [€ ] Cost/area [€/m 2] *** 1 primary 2014 1722 170 10.0 11 6 52 45 0.5 2.03 14 2,564,058 1489 2 primary 2015 1269 115 11.0 11 1 41 48 0.6 2.46 19 1,916,190 1510 3 primary 2014 964 110 8.5 13 9 58 38 0.3 2.11 14 1,842,780 1306 4 primary 2015 412 56 9.0 17 13 69 52 0.5 1.57 18 2,256,410 1538 5 primary 2014 1071 134 8.0 14 8 56 38 0.5 2.20 18 1,522,555 1421 6 primary 2013 560 55 10.5 16 0 54 45 0.5 2.10 15 3,672,925 1580 7 primary 2013 750 100 7.5 13 2 45 49 0.5 1.93 18 1,237,597 1650 8 primary 2014 1225 170 7.2 13 5 59 35 0.4 2.30 13 1,854,013 1513 9 primary 2015 2232 240 9.3 14 1 47 52 0.3 2.33 16 1,663,548 1250 10 primary 2013 700 60 12.0 13 7 57 49 0.6 2.62 16 1,185,000 1430 11 primary 2013 600 60 10.0 12 0 39 49 0.6 1.60 18 774,000 1290 12 primary 2018 8250 900 9.0 10 0 48 28 0.6 1.80 14 12,540,000 1520 13 primary 2016 3550 530 6.7 15 0 50 50 0.5 2.20 18 5,988,000 1687 14 primary 2016 2394 600 4 9 0 32 45 0.5 1.85 18 3,500,000 1460 15 primary 2016 1620 150 10.8 12 0 41 50 0.6 2.40 16 2,100,000 1296 16 primary 2016 2580 250 10.3 14 8 52 50 0.5 1.85 18 3,405,000 1320 17 secondary 2018 3900 1400 2.7 21 9 59 54 0.4 2.25 18 5,772,000 1480 18 secondary 2016 3569 550 6.5 14 2 47 54 0.5 2.49 19 5,389,190 1510 19 secondary 2015 4195 1400 5.0 25 13 65 45 0.3 2.10 16 5,600,325 1335 20 secondary 2015 4200 700 6.0 25 0 63 50 0.5 2.50 17 5,806,350 1650 21 secondary 2016 1200 300 3.5 13 1 61 53 0.5 2.40 17 1,716,000 1430 22 secondary 2014 2180 550 4.0 14 0 41 27 0.5 3.16 14 3,500,000 1605 23 secondary 2014 4395 318 13.8 10 1 38 47 0.3 2.67 12 6,079,647 1383 24 secondary 2015 3863 321 12.0 15 4 42 53 0.6 2.60 21 5,103,550 1321 25 secondary 2017 1025 115 9.0 15 11 59 45 0.5 2.30 14 1,752,635 1709 26 secondary 2015 4395 980 4.5 19 15 51 54 0.5 2.40 23 5,562,355 1265 27 secondary 2014 2755 900 3.1 10 0 32 45 0.5 1.88 13 3,294,089 1200 28 secondary 2019 4500 700 6.4 12 0 48 45 0.6 2.80 25 5,760,000 1280 29 secondary 2018 3200 720 3 14 0 58 45 0.6 2.7 20 10,000,000 1380 30 secondary 2016 8835 750 8 11 0 39 50 0.6 2.0 18 15,000,000 1697 * The E-Level is a Belgian indicator. It represents the energy consumption of a building. It takes into account energy needs for space heating, hot water production, cooling, ventilation and the energy consumption of auxiliaries. The lower the E level, the less energy consuming the building is. The calculation of E-Level takes into account various elements that in fl uence energy consumption including the structure and orientation of the building, thermal insulation, heating, ventilation, air tightness and overheating. ** The K-Level is a Belgian indicator implemented before the introduction of the EPBD to evaluate the envelope ’s energy effi ciency. The K value indicates the overall level of thermal insulation for the entire envelope of a building It takes the heat loss into account through exterior walls, roofs, fl oors and windows. *** The cost does not include the photovoltaic cost.
goodness-of-fit of the building energy model. The Mean bias error, MBE, and the Coefficient of variation of the Root mean square error, CV (RMSE). MBE is a non-dimensional measure of the overall bias error between the measured and simulated data in a known time resolution, and it is usually expressed as a percentage:
= ∑ − ∑ = = MBE m S m ( ) [%] i N i i i N i 1 1 p p (1) where mi(i = 1, 2,…, Np) are the measured data, si(i = 1, 2,…, Np)
are the simulated data at time interval i and Np is the total number of the data values.
CV(RMSE) represents how well the simulation model describes the variability in the measured data. It is defined as:
= ∑= − CV RMSE m m S N ( ) 1 i ( ) [%] N i i p 1 2 p (2) where besides the quantities already introduced in Eq. (1), m is the average of the measured data values. The evaluation of the accuracy of a building energy simulation model is made according to the model’s conformity with the recommended criteria for MBE and CV(RMSE).
According to the ASHRAE Guideline 14, the simulation model is considered calibrated if it has MBE that is not larger than 5%, and CV (RMSE) that is not larger than 15%, when the monthly data are used for the calibration.
In order to get a reliable building energy model, and to increase the accuracy of the estimation of the building’s performance, the models of the schools underwent two subsequent calibrations. The building model wasfirst calibrated on the basis of the building’s measured monthly gas consumption then it was refined in free running with a second cali-bration with respect to monitored hourly indoor air temperatures[43]. In order to identify the independent variables that, at the same time, influence the energy and thermal performances of the building and that are mostly affected by uncertainty, we referred to Hopfe[67]. However, in the present case study of calibration the class sizes arefixed and are not considered as a design variable. The type of windows, the power density of the electric equipment and electric lighting have been pre-cisely quantified with surveys and an energy audit. Hence, they are not sources of significant uncertainty[68], the calibration process focused on testing independent variables that describe airtightness and the oc-cupant density and schedule and the global seasonal efficiency of the heating system.
3. Results
After presenting the results of our nearly zero energy schools in-ventory we describe in detail the two selected reference schools, their energy characteristics and the validation results of the simulation models.
3.1. Database for nearly zero energy schools
Table 1lists thirty selected projects that complied with the Belgian Passive House Standard requirements. The table lists the most im-portant energy performance indicators including occupant density, heating and cooling energy use, energy use intensity and cost. All schools had a conductivity of the envelope (walls, roofs, and ground) equivalent or lower than 0.15 W/m2K and an air permeability of less
than of 0,6vol/h at 50 Pa. The energy performance data represents the yearly average values collection between 2015 and 2018.
3.1.1. Energy use intensity
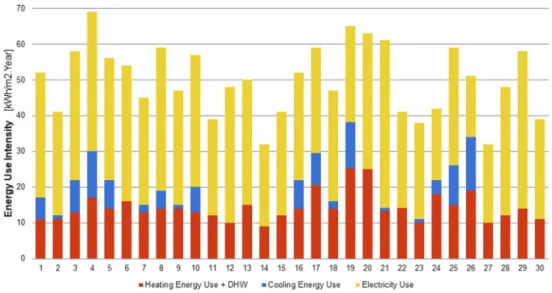
As the survey addressed the billing history of the sample groups, we found average energy use of a typical nZES for heating is 14 kWh/m2/ year, for cooling is 4 kWh/m2/year and the total energy use intensity is
50 kWh/m2/year between 2015 and 2018. As shown inFig. 4, the
schools are heating dominated. The cooling energy use was significant. The audit revealed that schools without cooling energy use had no cooling system or had their cooling systems switched off. Based on Fig. 4 we could conclude that several schools had overheating pro-blems. Regarding the type of energy, the major energy use is electric represented by the blue and yellow color (see legend: cooling energy use and electricity use). Electricity forms almost two-third of the total energy use. This reasons for the high electricity use is mainly due to the mechanical ventilation and plug loads.
3.1.2. Cost
As shown in Fig. 5, the average cost for the thirty investigated project was 1450 euros per square meter. We could notfind a corre-lation between the energy use intensity and cost. The lowest project cost was 1250 euros/m2and the highest was 1709 euros/m2.The
re-sults confirm that the indicated costs per square meter are lower than the average schools constructed in the same period, which is around 1500 euros/m2[69].
3.2. Selected reference schools
Plans and forms of thirty school configurations were analyzed. A replication of the rectangular classroom shape was found across all investigated plans. No specific layout orientation was found dominant or commonly used. Most primary school plans had a compact mass with a two floor and double loaded corridor setting. However, most sec-ondary school plans were less compact. Classes were aligned around double loaded L-shaped or H-shaped corridors with an average of 4 floors.
From the data collected two groups of schools were identified namely primary schools and secondary schools’ typologies. Both typologies had to be distinguished due to the disparity regarding use, floor layout, building configuration, occupancy density and energy performance. Primary schools host pupils aged 6–12 years old and are most of the time low-raised. Secondary schools host pupils aged 12–18 and are most of the time more compact and middle-raised. As shown in –8, two common school typologies were identified and referred to as Typology 1 and 2. For this study, both typologies were selected and identified as representative nZES buildings.
3.2.1. School buildings description
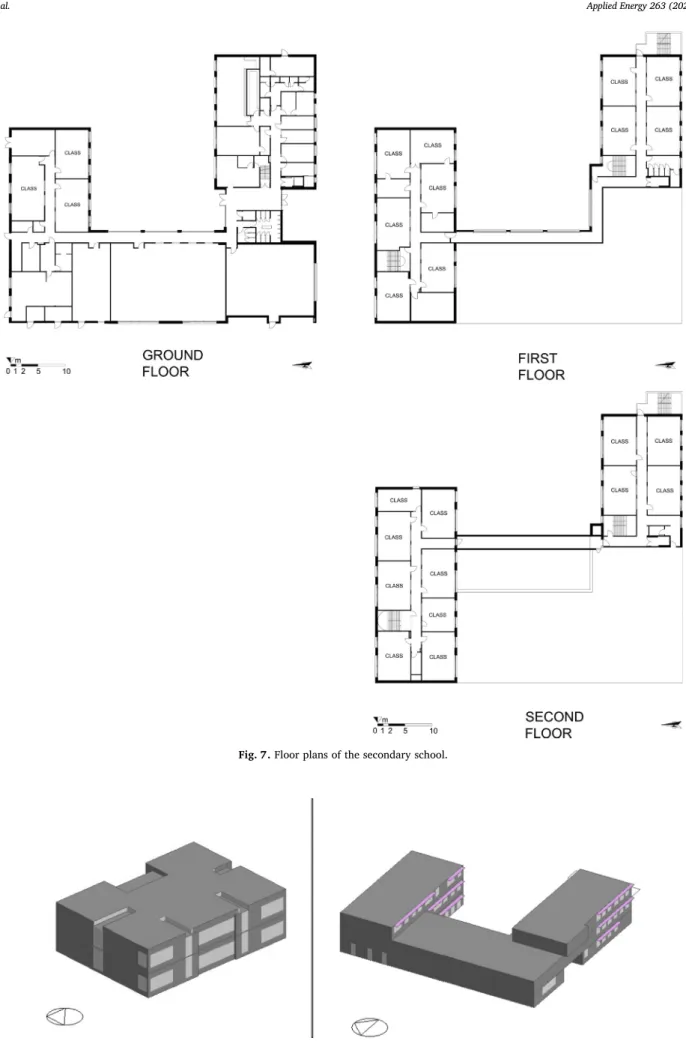
The two school types in Figs. 6 and 7 were found to be re-presentative models for schools in the three regions. Both selected typologies were positioned onflat terrain, without surrounding trees or other obstructions that can cast shade on the building mass. The basic building construction is reinforced-concrete post and column with 0.65 m concrete hollow blocks walls with 30 cm rigid polystyrene pa-nels insulation. Windows are triple-glazed, coated and transparent of a conductivity of 0.8 W/m2K and SHGC as low as 0.5. The total amount
of glass in North and South facades is estimated to be between 25% and 45% of total wall area. There is no solar protection for the facades and most windows have an internal blind. Next, the average occupancy density for both selected typologies was calculated based on the average area and number of students per class room for all investigated schools.Table 2presents the values of average classroom density values for nZES primary and secondary schools in Belgium.
To address the different orientation of the surveyed schools, the benchmark models performance was generated by simulating the building with its actual orientation and again after rotating the entire building 90, 180, and 270°, then averaging the results. This is a best-practice recommended by ASHRAE Standard 90.1 Appendix G [70]. Fig. 5. School construction cost versus energy intensity.
Fig. 7. Floor plans of the secondary school.
Table 3, lists the general description of the sample building and some properties for the construction materials used. The full model char-acteristics description can be found in the resultsSection 3.3. 3.3. Energy characterization of reference schools
The energy characteristics of the two reference schools simulation models are described in this section.
3.3.1. Energy use intensity
As the audit addressed the two selected reference schools, we found average energy use intensity for the reference primary school 59 kWh/ m2/year. For the reference secondary school the average energy use
intensity is 42 kWh/m2/year.Table 4illustrates the average and
var-iance values. According to theTable 4, the secondary schools sample is more widely spread than the sample of primary schools.
3.3.2. Occupancy density and schedules
Tables 5 and 6summarize the holidays and occupation periods use for both schools. Based on available data and our survey, we defined the occupancy period from 7:00 to 18:00 in weekdays while in the weekend the building is considered empty. Results show that the occupation time of a primary or secondary school building is from 08:30 to 16:30. This assumption was made for pupils’ occupancy schedules. School em-ployees’ presence was included in the models during the earlier time slots and later in the afternoon, for office work (teachers, director) or for cleaning (other employees). An absenteeism of 5% is taken into account with an operational schedule of 190 academic days.
As shown inFig. 9, in the opening time of school, only a 10% of the total people are present at the school, i.e. those who are in charge of the
preparation of classrooms, toilets and the other services. Then, around 7:30–8:00, more people start coming, those are teachers, employees or students that arrive earlier from the actual beginning of the lessons. The amount of occupants grows until reaching the maximum around 08:30, which is when all the pupils are in their classroom having lessons. This situation stays steady until 16:30, that’s when the classes are dismissed. From 16:00 to 18:00 there is a gradual occupancy’s decrease. Classed are ended and teachers and other school staff gradually leave the school. Needless to say, a lunch break is assumed daily between 12:00 and 13:00. Both schools are completely empty after 18:00. In primary schools, pupils eat together their home-prepared sandwiches in a common space. In secondary schools, pupils leave the school for lunch. 3.3.3. Internal load intensities (plug load intensity and schedules)
The clothing insulation and metabolic heat production were esti-mated based on NBN-EN 15251[71]and ter Mors. (2011)[72]. The occupant internal heat gains were estimated to be 80 W/pers and the equipment heat gains were estimated to be 1 W/m2. All classrooms
were modeled without computers with a plug load density of 5 W/m2. We assumed that only teachers might have access to PCs, in the class-room, and therefore, it was considered as negligible.
3.3.4. HVAC systems and comfort set points
In both reference schools, mechanical ventilation with heat re-covery is installed. The HVAC system is couple to an air handling unit located in the technical rooms with a Constant Air Volume (CAV) system to provide the minimum amount of fresh air per person of 20 m3/h, according to the school day occupancy schedule. This
venti-lation rate was based on the average Flemish and Walloon EPBD Table 2
Classroom average area and occupancy density in primary and secondary schools.
Primary school Secondary school
Number of classes 10 20
Average class area [m2] 60.4 50.8
Occupancy density (Bruto) [m2/student] 7.2 12 Occupancy density (Netto) [m2/student] 2.5 2.8
Table 3
Building typologies description.
Building description Primary school Secondary school
Shape rectangle U-shape
Number offloors 2 3
Volume 3125 m3 15446 m3
External wall area 866 m2 2705 m2
Roof area 541 m2 1841 m2
Floor area 1225 m2 3863 m2
Windows area 168 m2 536 m2
Glazing U-Value 0.8 triple glazing filled with argon
U = 0.8 triple glazing filled with argon
Exterior wall U-Value 0.20 U = 0.18
Wall surface absorptance 0.7 0.7
Roof U-value (W/m2K) 0.10 U = 12
Ground U value (W/m2K) 0.11 U = 0.11
Floor U-value (W/m2K) 0.287 U = 0.287
Table 4
Average heating, cooling and energy use intensity. School Type Average Heating Energy Demand [kWh/
m2year]
Variance Average Cooling Energy Demand [kWh/ m2year]
Variance Average Energy Use Intensity [kWh/m2 year]
Variance
Primary 14 4.25 5 16.8 59 78.8
Secondary 18 23.7 4 28.1 42 106.3
Table 5
Annual occupancy schedule.
Season Weekdays Saturday Sunday
Season 1 (Feb–Jun) 7:00–18:00 _ _
Summer holiday (Jul–Aug) _ _ _
Season 2 (Sep–Jan) 7:00–18:00 _ _
Table 6
The holidays in the teaching school year (2018–2019) in Belgium.
School holiday Start date End date Week
Christmas holiday 24-12-2018 6/1/2019 52-01
Spring break 4/3/2019 10/3/2019 10
Easter holiday 8/4/2019 22-04-2019 15-17
Summer holiday 1/7/2019 31-08-2019 27-35
Autumn break 28-10-2019 3/11/2019 44
requirements in relation to the activity level and the age of the occu-pant (NBN EN 13799)[73]. The reference case has been modeled using as HVAC template with a CAV. This CAV system consists of a supply air stream of variable temperature and a modulation of the amount of the air that serves a space. The air handling units are controlled by a user profile schedule. An air-to-air heat exchanger is bypassed when the indoor operative temperature is lower than the indoor air temperature. Each class room is pre-ventilated during 1 h before the start of the school. The minimum supply air temperature is 16 °C. The heat re-covery system preheats the air with an efficiency of 75%.
The gas-fired boiler was modeled with an average a Coefficient of Performance (COP) of 0.9 coupled to the hot water loop for heating and sanitary hot water. During the heating period, the rooms’ set point temperature is 20 °C (minimum 16 °C). Both selected schools had a mechanical cooling system and were modeled with a mechanical cooling system (Variable Refrigerant Flow (VRF) system).
3.3.5. Lighting load intensity
Lighting systems had a power consumption of 6 W/m2and was
programmed in EnergyPlus as 2 W/m2per 100 Lux of light level. Then, we used a 300 lx threshold to reach the 6 W/m2. A daylight control
system is coupled to a centrally positioned daylight sensor. The re-quired illuminance of each classroom is specified in NBN EN 12464-1 [74].
3.3.6. Plug load intensity and schedules
3.3.6.1. Simulation model and validation. Two representative simulation models were built taking into account the previously described envelope, occupancy and energy systems and characteristics. As shown inTable 7, the major model input parameter values are listed. The validity of the estimate has been further checked against literature [12], public reports including AGION 2015[44]and 2019 reports[10], the Flemish Ministry of Education[47]and through model calibration [66]and monthly and annual energy use bills[75].
3.3.7. Numerical model calibration
The MBE and CV(RMSE) of monthly energy use for four consecutive years are calculated for both school models and reported inTable 8. The obtained values of both MBE and CV(RMSE) are within acceptable limits of ± 5 and ± 15, respectively[76]. The negative signs in-dicated that the model over predicts the energy consumption on average.
Figs. 10 and 12 show the estimated gas use simulated in both models and the real gas use of both actual buildings. The model cali-bration was done over four years and involved several reviews from peer modelers at the Belgian Passive House Standard not-fprofit or-ganization. All the previous load schedules were included in both models. A good agreement was found in the monthly energy use be-havior and curve shapes between the simulated data and the survey collected data. The box plot upper and lower extremes represents the lowest and highest measured monthly energy use. The upper and lower quartile of the red box includes 80% of the monthly measurements.
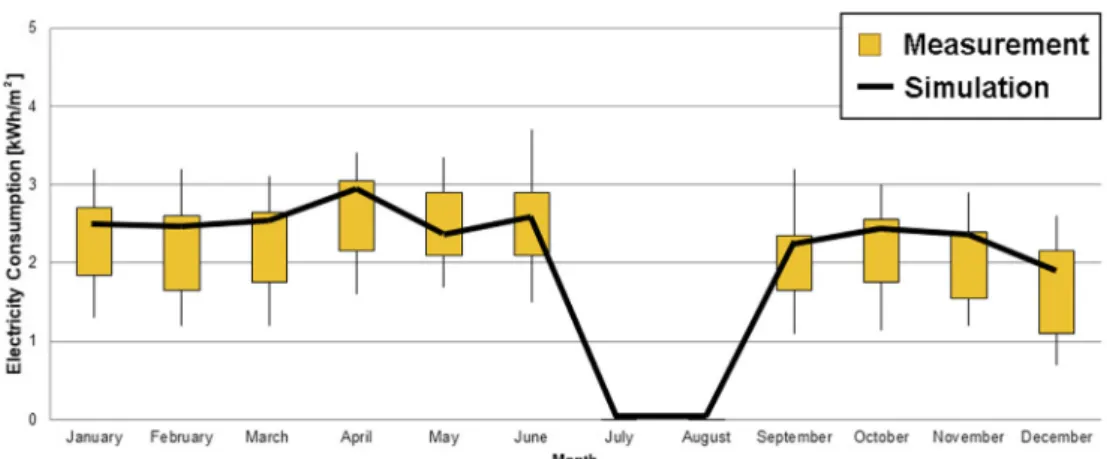
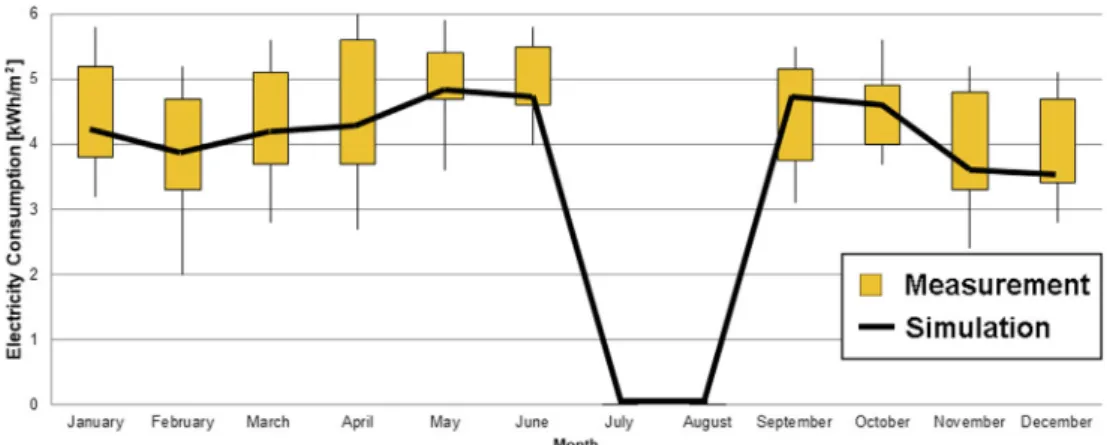
Figs. 11 and 13show the estimated electricity use simulated in both models and the real electricity use of both actual buildings. InFig. 11, the estimated electricity use curve shape is offset towards higher limits than the measured electricity use. InFig. 13, the estimated electricity use curve shape is offset towards lower limits than the measured elec-tricity use. However, a good agreement was found in the monthly electricity use behavior and curve shapes between the simulated data and the survey collected data. The box plot upper and lower extremes represents the lowest and highest measured monthly electricity use. The upper and lower quartile of the red box includes 80% of the monthly measurements.
4. Discussion
In the following section, we will discuss the majorfindings of the study and elaborate on its strength and limitation before elaborating on the implications of the study on practice and research.
4.1. Summary of the mainfindings
For this study, we developed and validated two reference models for nearly Zero Energy Schools (nZES) in Belgium. Both models represent primary and secondary schools recently built in Belgium. Our research methodology combines mixed methods of research involving qualita-tive (e.g., literature review and smart phone base survey) and quanti-tative empirical and modeling (e.g., walkthrough audits, building per-formance simulation, calibration) research. In the recent, years Belgium has been busy supporting projects to construct passive and nZES as a wide policy goal to increase energy performance and sustainability of education facilities. Therefore, benchmarking those newly constructed schools serves as a mechanism to evaluate and assess their real energy performance of buildings over time and share learned lessons. Benchmarking allows characterizing them through reference models in Table 7
Summary of input parameters for both benchmark models after calibration.
Model input measures Primary
school Secondary school Envelope WWR = (%) N22, S45, E35, W28 N30, S25, E15, W,26 Openings [W/m2K] U = 0.78 U = 0.78 Shading coefficient for
glass, SC
0.7 0.7
Solar Heat Gain Coefficient (SHGC) 0.5 0.5 Light transmittance (LT) 0.66 0.66 LSGR(LT/SHGC) 1.4 1.4 Overhangs, projection factor PF (E, W, S) 0 0.83
SGR (blind/screen) Blind 0.5 Blind 0.5 Wall U Value = [W/m2 K] U = 0.107 U = 0.107 Wall surface absorptance, CCF 0.7 0.7 Roof [W/(m2K] U = 0.094 U = 0.094 Air tightness 0.6 0.6 Roof surface absorptance, CCF 0.6 0.6
Ventilation and air conditioning
COP/EER 0.85 0.85
Temperature set point [°C] for heating
18 21
Temperature set point [°C] cooling
25 25
Mechanical ventilation system
VAV Outside air l/s per
person)
5.5 5.5
Air changes per hour 2 2
Heating system Convective Convective Heating fuel Natural Gas Natural Gas Daily operative hours for
ventilation/heating
Occupancy schedule
Occupancy schedule Relative humidity set
point [%]– Adaptive
20–70% 20–70%
Radiant fraction 0.37 0.37
Lighting Visible fraction 0.18 0.18
Installation power density [W/m2]
6 6
Number of people 24 18
Occupancy Average area of the Class 60 51
Density 2.5 2.8
Occupancy schedule SeeFig. 7 SeeFig. 7
Total Average consumption
[kWh/m2/year]
order to enable reliable simulations and future improvement. To summarize the major benchmarking-basedfindings, we list the most important and tangible outcomes of our building performance characterization (seeTable 7):
•
An inventory and database with thirty nZES was created describing the major energy and occupancy performance criteria collected between 2015 and 2018.•
Two new benchmark models for primary and secondary schools were created in EnergyPlus based on the representative building stock performance of nZES and were calibrated based on the ASHRAE BESTEST requirements[76].•
The average energy use intensity of the primary and secondary nZES is 59 kWh/m2/year and 42 kWh/m2/year, respectively.Table 4il-lustrates the average values.
•
In the temperate climate of Belgium (Köppen Cfb: Marine West Coast Climate), the breakdown of the energy use intensity of thirty nZES schools is 28 percent for heating, 8 percent for cooling and 64 percent for electricity energy use (mechanical ventilation, lighting, plug loads and pumps), based onTable 1andFig. 4. The building energy use is dominated by mechanical ventilation.•
The average electricity consumption is mainly a result of mechanical ventilation and the presence of PC’s and video projectors.•
The average energy intensity for cooling and heating is higher than15 kWh/m2/year in many nZES.
•
The average cost for the thirty investigated project was 1450 euros per square meter, as shown inFig. 5, which is in the range ( ± 12) of conventional construction cost (2015–2018) (seeSection 3.2.1).•
Remarkably, the model estimate low heat losses of the envelope dueto compactness, insulation and airtightness. The average building envelope air permeability was less than of 0,54vol/h at 50 Pa and the envelope conductivity was below 0.2 W/m2K. Most schools had concrete hollow blocks walls with rigid polystyrene insulation and external brick leaf.
•
Most windows were triple-glazed with an average conductivity of 0.8 W/m2K, and g-value of 0.5. However, more than 73% of theschools had no external solar protection.
•
Surprisingly, more than 40 percent of the investigated schools didnot have a cooling system nor had their cooling system switched on. Some of the investigated schools had their mechanical ventilation system switched off due to high electricity bills.
•
Nearly Zero Energy Schools needs are cooling and electricity dominated4.2. Strength and limitations of the study
We created two simulation models and validated them with real monthly energy use data for natural gas and electricity for more than three years (2015 and 2018). No previous study, explored this terrain and until this moment there is no single benchmark for nearly Zero Energy Schools that is open-access and validated based on a database of 30 schools with monthly measurements of more than three years. Our work is part of the activities of OCCuPANt project (Impacts Of Climate Change on the indoor environmental and energy PerformAnce of buildiNgs in Belgium during summer) that aims to benchmark the performance of high performance buildings in Belgium. European ex-perts in several organizations including the Buildings Performance Institute Europe (BPIE) explicitly identified the need to create bench-mark models that are validated and that can be used to assess energy use, indoor environmental quality and user interaction in high perfor-mance buildings[56]. Thefindings of the past TABULA project[77] and ZEBRA 2020 (nearly Zero-Energy Building Strategy 2020) project efforts confirm the need to create real reference models for new buildings, as well as old buildings[78].
Benchmark models have a great influence on informing the design decision making during design and building energy use and indoor environmental quality during operation[78]. The implications of en-ergy efficiency on building thermal comfort are severe and climate change can jeopardize many efforts to reduce the cooling requirements and cooling systems[79]. Benchmark models provide greater resources for energy modelers and energy simulation experts and allow to bridge the energy performance gap between operational and designed per-formance[80]. By reviewing the literature inSection 1, we identified a significant interest in renovation of existing schools[13]across dif-ferent climates of the world[81], however, few studies are concerned with new and high performance schools. Therefore, solid performance Table 8
MBE and CV(RMSE) of the monthly energy use of both reference school models from 2015 to 2018.
2016 2017 2018 Average
Statistical indices MBE (%) CV(RMSE) (%) MBE (%) CV(RMSE) (%) MBE (%) CV(RMSE) (%) MBE (%) CV(RMSE) (%)
Reference School 1 Monthly Calibration (Natural Gas) +5 −14 −6 −12 −2 −8 −3 −11
Reference School 1 Monthly Calibration (Electricity) 5 10 3 14 4 12 4 12
Reference School 2 Monthly Calibration (Natural Gas) 3 14 4 10 4 9 4 11
Reference School 2 Monthly Calibration (Electricity) 4 17 5 11 5 11 5 14
analysis can be performed to estimate the future energy performance of new school buildings and help building operators to identify the per-formance discrepancies (energy, comfort, cost) during operation [3]. They can also be useful for sale or rental purposes.
Another benefit of our two benchmark models is to inform regula-tion and the regional EPBD experts. The study succeeded to char-acterize both reference schools in a prescriptive and performance-based way, which allows a better understanding of the schools energy per-formance. For instance, Hernandez (2008) showed that benchmark models for Irish primary schools allowed to comparison with re-presentative building stock performance which was a vital step to change the regulation compliance and certification process[24]. In this context, our paper presents one of the few cross-sectional studies where researchers compile a database for a representative building stock performance of nZES during a specific period of four years. The study is not only valuable in Belgium but findings on energy needs and use intensity are useful in countries with temperate and continental cli-mates. Also, we consulted energy modeling experts and scientist to justify several modeling assumptions for our energy models that we consider as a good start. We know that our benchmark models are not perfect but it should be seen as novel contribution that future re-searcher should build upon and include comfort and air quality data or address in overall the indoor environmental quality.
Needless to say, we only chose to calibrate our model using monthly data for almost four years. We should ideally have tested our models against hourly operative temperature data and investigated the varia-tions in occupancy. We could not have a full access to monitor the operative temperature, humidity, carbon dioxide, occupancy variations or even the solar electric photovoltaic generation for both of our re-ference buildings, until now. We did our best to push the limits of our database and include thirty cases and get a good representative sample
of the nZES building stock performance that can be developed in the future. But we had the advantage to have all building built 2013–2018 with almost the same energy performance requirements.
Another limitation is that we focused mainly on benchmark devel-opment and not on characterizing indoor environmental quality and the correlation between the air quality and energy use intensity. Indoor environmental quality in educational buildings is a versatile topic that gained many attention during the last two decades[82]. The topic does not only address the four major IEQ indicators but involves human perception and occupant interaction with the classrooms environment [83]. Therefore, in this study, indoor temperature and air change rates have been assigned standard and estimated values. In fact, we did not want to provide an evaluation of indoor environmental quality of cur-rent schools; we rather wanted to create two new benchmark models that can be used easily by professionals and researchers in nZES. The benchmark models succeeded to characterize geometry, envelope, oc-cupancy and HVAC systems in direct relation to thermal and energy performance. Future work, should address indoor environmental quality through post-occupancy evaluations in those schools more thoroughly. More importantly, there is a necessity to define the venti-lation rates required in those schools spaces in reventi-lation to the energy losses and the overall efficiency of the mechanical ventilation systems, including heat recovery. Thefindings indicate that most schools’ energy use is electric as a effect of IAQ ventilation. Therefore, future work should portray the adverse effect of IAQ ventilation on energy use in-tensity.
4.3. Implications for the practice and future research
In summary, this study presents two novel benchmark models with good validity to be used to assess energy performance of nZES. Future Fig. 11. Surveyed and simulated monthly gas use of the secondary school.
research should test our building models with the occupant in a wider context and with a large sample of students with respect to indoor environmental quality[84]. More work is also needed to compare our benchmark models results with estimation of the nZEB-tool developed by the PHPP [85]. We expect that the use of multi-zone dynamic si-mulation models would lead to less discrepancy between the assumed modeling input and real occupancy and operation conditions in relation to ventilation systems and air change rates[86].
The implication of our work on practice can lead to revision of the EPBD and Belgian Passive House Standard requirements (PMP and Pixii). Belgium missed several opportunities to develop its own refer-ential rating systems for green and healthy schools. A good example is CIBSE’s TM57 reference for integrated school design [87]. Therefore, very much of lost time and discussions take place when defining green and healthy schools. Also, there are too many fragmented entities that are responsible of schools and education in Belgium (schools owned by the communities, subsidized public schools, and subsidized free schools). As a result, there is a lack of understanding and shared knowledge on best practices of high performance schools design and operation. Our study can contribute to larger initiatives and projects, such as Scholen van Morgen, Scholenbouwen, Gezonde Scholen and Mon Ecole un espace de qualite, by sharing learned lessons and representative performance data for recently construction schools. Comparison can be made during early design stages to assess and evaluate different design assumptions and boundary conditions. As a direct implication of our work, we advise countries with temperate climate in Europe and Worldwide to adopt our benchmark models and refine them accord-ingly to estimate and evaluate the energy performance of nZES, in their context. A project such as TABULA in the EU or Re-energising Wales in the United Kingdom (UK) should be extended beyond residential buildings, therefore, the EU should create databases of building benchmarks similar to the CBECS in the USA[88].
Through this study, we succeeded to characterize Belgian nZES energy efficiency, which can provide insights for European member states[89]. Surprisingly, the dominance of electricity use in all schools emerged as an important factor that was undermined in our initial model creation. Our research provided a detailed characterization of the energy performance gap in recently construction high performance schools. Future research should, extend the focus on breaking down the electricity use under more items and measure their validity and re-levance. We believe that heat gains, lack of solar protection and the air change rates are the most important parameters that influence the en-ergy performance of nZES. Future detailed audit should take place to assess the operation and model assumption of mechanical ventilation systems. Further research and adoption of the same benchmark models would be excellent avenues for further research for further validating and generalizability of the proposed models for nZES design and op-eration.
5. Conclusion
In this study, the energy use intensity and energy use breakdown of thirty nearly Zero Energy Schools (nZES), located in various areas throughout Belgium, is estimated and compared based on a four-year measurement data (2015–2018). Two representative reference models were created and calibrated using EnergyPlus software. Study results indicate that both created reference models have a good validity in assessing the energy performance of nearly Zero Energy Schools built between 2015 and 2018 in Belgium. The models are reliable and con-sistent and can be used by future building energy modelers and experts. The models were calibrated according to ASHRAE Guideline 14 using two indices to evaluate the goodness-of-fit of the building energy model. The Mean bias error, MBE, and the Coefficient of variation of the Root mean square error, CV(RMSE) were used to proof that both model are accurate and valid.
The dominant energy use of electricity in Belgian nZES is mainly related to the intensive use of mechanical ventilation and electric in-stallations. Most of the investigated school succeeded to decrease the energy needs for heating and cooling. However, thermal comfort, which was not investigated in this study, seems to be problematic. The cooing use was significant in a temperature climate such as Belgium and in schools, which are only occupied 27% (in average 2360 h/yearly) of the year. The lack of solar protection for largely glazed facades, the lack of thermal inertia activation due to night cooling blocking (for security reasons) are among the reasons of cooling energy needs increase.
Furthermore, although the contribution of photovoltaic systems is not taken into consideration as the focus was mainly on the building’s energy efficiency, this study highlights that most those schools were built with a similar cost per square meter. The small variance is mainly due to the strict budget control that maintained during the project delivery process. In this context, the study provided valuable insights on the cost.
Finally, the study provides several insights on the reference schools building and systems characteristics. The result confirms the presence of a significant energy performance gap between the early design per-formance assumptions and the real perper-formance. The models can guide school design decisions, operators and school owners about the energy performance and energy use intensity and help them to characterize nearly Zero Energy Schools.
CRediT authorship contribution statement
Shady Attia: Conceptualization, Supervision, Methodology, Writing - original draft, Validation, Writing - review & editing. Niloufar Shadmanfar: Investigation, Software, Data curation. Federico Ricci: Investigation, Software, Data curation.
![Fig. 1. Greenhouse gas emissions of Belgium in 2017 [4].](https://thumb-eu.123doks.com/thumbv2/123doknet/6656109.182037/2.892.122.780.801.1087/fig-greenhouse-gas-emissions-belgium.webp)