Direction des bibliothèques
AVIS
Ce document a été numérisé par la Division de la gestion des documents et des archives de l’Université de Montréal.
L’auteur a autorisé l’Université de Montréal à reproduire et diffuser, en totalité ou en partie, par quelque moyen que ce soit et sur quelque support que ce soit, et exclusivement à des fins non lucratives d’enseignement et de recherche, des copies de ce mémoire ou de cette thèse.
L’auteur et les coauteurs le cas échéant conservent la propriété du droit d’auteur et des droits moraux qui protègent ce document. Ni la thèse ou le mémoire, ni des extraits substantiels de ce document, ne doivent être imprimés ou autrement reproduits sans l’autorisation de l’auteur.
Afin de se conformer à la Loi canadienne sur la protection des renseignements personnels, quelques formulaires secondaires, coordonnées ou signatures intégrées au texte ont pu être enlevés de ce document. Bien que cela ait pu affecter la pagination, il n’y a aucun contenu manquant.
NOTICE
This document was digitized by the Records Management & Archives Division of Université de Montréal.
The author of this thesis or dissertation has granted a nonexclusive license allowing Université de Montréal to reproduce and publish the document, in part or in whole, and in any format, solely for noncommercial educational and research purposes.
The author and co-authors if applicable retain copyright ownership and moral rights in this document. Neither the whole thesis or dissertation, nor substantial extracts from it, may be printed or otherwise reproduced without the author’s permission.
In compliance with the Canadian Privacy Act some supporting forms, contact information or signatures may have been removed from the document. While this may affect the document page count, it does not represent any loss of content from the document.
Université de Montréal
Impact des perturbations anthropiques sur la végétation du complexe de milieux humides des Tourbières:...de-Lanoraie
Par
Marie-Eve Tousignant
Département de sciences biologiques Faculté des arts et des sciences
Mémoire présenté à la Faculté des études supérieures en vue de l'obtention du grade de M.Sc.
en sciences biologiques
Août 2008
© Marie-Eve Tousignant, 2008
... .. ---
---Université de Montréal Faculté des études supérieures
Ce mémoire intitulé:
Impact des perturbations anthropiques sur la végétation du complexe de milieux humides des Tourbières-de-Lanoraie
présenté par Marie-Eve Tousignant
a été évalué par un jury composé des personnes suivantes:
Alain Cogliastro président-rapporteur Stéphanie Pellerin directeur de recherche Jacques Brisson codirecteur de recherche André Bouchard membre du jury
111
Résumé
Ce mémoire VIse à déterminer l'ampleur et la nature de l'impact des perturbations
anthropiques sur la végétation des Tourbières-de-Lanoraie. Principalement composé de
tourbières minérotrophes forestières avec quelques îlots ombrotrophes, ce complexe de
milieux humides fut touché par l'agriculture, le drainage, l'urbanisation et la coupe
forestière. Des analyses multivariées et des corrélations ont permis de départager
l'influence des facteurs anthropiques, environnementaux et spatiaux et de comprendre plus
spécifiquement les conséquences des activités anthropiques sur la composition et la richesse
de la végétation. Les résultats indiquent qu'à l'échelle du complexe, les communautés
végétales se répartissent principalement selon un gradient d'ombrotrophie
-minérotrophie. Sous-jacent à ce gradient, une part significative de la variabilité de la
végétation peut être liée aux perturbations anthropiques, particulièrement dans les
secteurs ombrotrophes. Les perturbations humaines sont reliées à l'augmentation du
couvert forestier et de la richesse et du recouvrement des herbacées, au détriment des
bryophytes et des espèces tourbicoles.
Mots-clés: Perturbation anthropique; Bog; Gradient environnemental; Fen; Composition; Richesse; Partition de la variance.
IV
Abstract
This study alms to characterize the impact of anthropogenic disturbances on the
vegetation of the Lanoraie wetland complex. Mainly composed of minerotrophic
forested peatlands with scattered ombrotrophic zones, this complex has been disturbed
by agriculture, drainage, urbanization and wood cutting. Correlations and multivariate
analyses permit to assess the relative influence of anthropogenic, environmental and
spatial variables as weIl as the consequences of anthropogenic activities in regards to
plant composition and richness. Results indicate that the spatial organisation of plant
communities within the complex follows mainly a minerotrophic ombrotrophic
gradient. Underlying this gradient, a significant part of the vegetation variability can be
related to anthropogenic disturbances, especially in ombrotrophic sectors. Human
activities are associated with the increase of tree coyer and herb richness and coyer as
weIl as with the decrease ofrichness and coyer of bryophytes and peatland species.
Keywords: Anthropogenic disturbance; Bog; Environmental gradient; Fen; Species composition; Species richness; Variation partitioning.
v
Table des Matières
Résumé ... iii
Abstract ... iv
Table des Matières ... v
Liste des Tableaux ... vi
Listes des Figures ... vii
Liste des Annexes ... viii
Remerciements ... ix
Chapitre 1: Introduction générale ... 1
1.1 Facteurs de contrôle des patrons de végétation ... 1
1.1.1 Facteurs environnementaux ... 1
1.1.2 Perturbations ... 2
1.1.3 Spatialité ... 4
1.1.4 Influence relative des facteurs de contrôle ... 5
1.2 Facteurs de contrôle des patrons de végétation dans les tourbières ... 6
1.2.1 Facteurs environnementaux et perturbations naturelles ... 6
1.2.2 Perturbations anthropiques ... 8
1.2.3 Influence relative des facteurs de contrôle ... 9
1.3 Complexe de milieux humides des Tourbières-de-Lanoraie ... Il 1.4 Objectifs du mémoire ... 12
1.5 Organisation du mémoire ... 13
Chapitre 2: Human impact on the vegetation of a large wetland complex ... 14
2.1 Introduction ... 14
2.2 Methods ... 16
2.2.1 Study area ... 16
2.2.2 Sampling and data collection ... 18
2.2.3 Data analysis ... 21
2.3 Results ... 24
2.3.1 Plant species assemblages and control factors ... 24
2.3.2 Species composition and relative influence of environmental, anthropogenic and spatial factors ... 27
2.3.3 Vegetation richness and cover and anthropogenic disturbances ... 31
2.4 Discussion ... 34
2.4.1 Main controls of the vegetation ... 34
2.4.2 Vegetation richness and anthropogenic disturbances ... 36
2.4.3 Species composition and anthropogenic disturbances ... 37
2.5 Conclusion ... 39
Chapitre 3: Conclusion générale ... : ... 41
Bibliographie ... : ... 45
VI
Liste des Tableaux
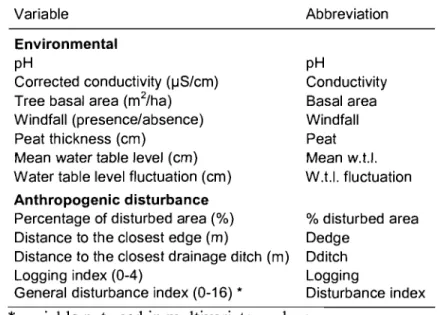
Table I. Environmental and anthropogenic disturbance variables sampled' in each sampling plots in the Lanoraie wetland complex, southem Québec ... 20
Table II. Characterization of the six different plant species assemblages (c1usters) at the Lanoraie wetland complex, southem Québec, obtained by the K-means analysis ... 25
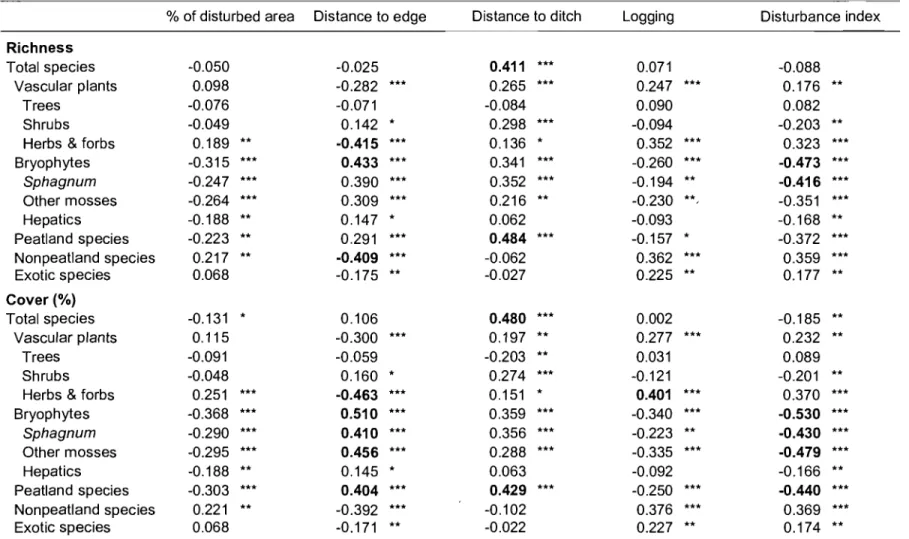
Table III. Correlation between richness and cover of different groups of plant species and anthropogenic disturbance variables at the Lanoraie wetland complex, southem Québec ... 33
vu
Listes des Figures
Figure 1. Location of the Lanoraie wetland complex, southem Québec, Canada and spatial distribution of the Il sampling transect lines ... 16
Figure 2. Distribution of (a) 253 plots at the Lanoraie wetland complex on RDA ordination constrained by (b) environmental and anthropogenic disturbance variables (underlined). Plant species assemblages were obtained by the K-means analysis ... 26
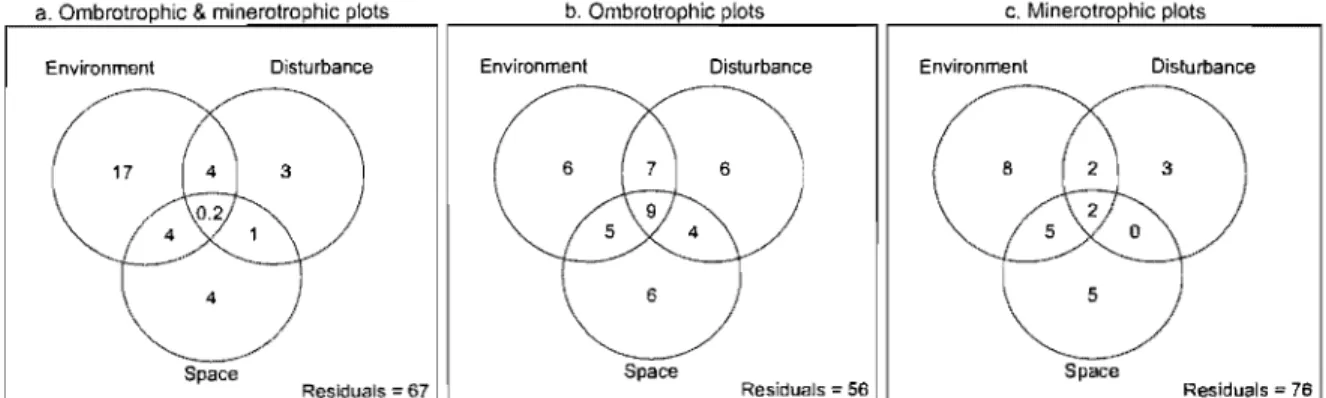
Figure 3. Venn diagrams representing the results of variation partitioning, between the environmental, anthropogenic disturbance and spatial explanatory tables, of vegetation from (a) minerotrophic and ombrotrophic plots combined, (b) ombrotrophic plots and (c) minerotrophic plots in the Lanoraie wetland complex ... 28
Figure 4. RDA of vegetation data sampled in the ombrotrophic plots of the Lanoraie wetland complex, southem Québec, constrained by the environmental and anthropogenic disturbance variables ... 29
Figure 5. RDA of vegetation data sampled in the minerotrophic plots of the Lanoraie wetland complex, southem Québec, constrained by the environmental and anthropogenic disturbance variables ... 31
Vlll
Liste des Annexes
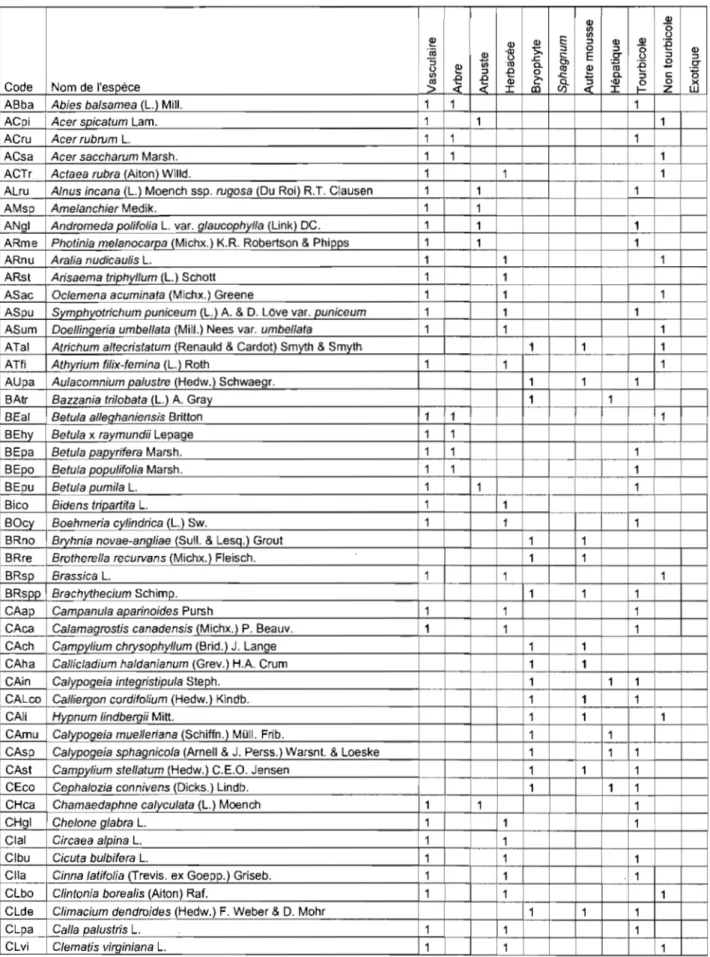
Annexe 1. Code, nom et classification des espèces recensées ... x
Annexe 2. Liste des stations d'échantillonnage ainsi que leurs coordonnées géographiques (X et Y; Nad 1983 UTM 18), statut trophique (bog ou fen) et groupe (selon 1'analyse de K-means) ... xvi
IX
Remerciements
Merci à ma directrice, Stéphanie Pellerin, pour la confiance accordée dans la poursuite de ce projet, sa très grande implication et son optimisme constant. Son soutien et ses suggestions ont joué un rôle primordial dans mon cheminement.
Merci à mon codirecteur, Jacques Brisson. Le regard qu'il a porté sur mes travaux, ses généreux conseils et le partage de son expérience furent très enrichissants.
Merci à Anne Keough, Mélanie Jean, Vincent Laroche, Fannie Mathieu et Mariannick Archambault pour leur coopération essentielle et très appréciée au travail de terrain, dans ce paysage parfois si enchanté, parfois si éreintant.
Merci à Caroline Dubé, ma (si unique!) consoeur de labo, pour la foule de questionnements et réflexions partagés et puisqu'elle a assurément rendu toute cette expérience encore plus agréable.
Merci à Éric Rosa pour les données d'épaisseur de tourbe et ses connaissances concernant les Tourbières-de-Lanoraie.
Merci à messieurs Stuart Hay, Jean Faubert et Robert Gauthier, pour leur collaboration respective dans l'identification de spécimens de plantes vasculaires, de mousses et de sphaignes.
Merci à Stéphane Daigle et Pierre Legendre pour leurs précieux conseils au sujet de
certaines analyses statistiques. '
Merci aux membres du laboratoire Brisson. Ce fut toujours un plaisir de faire partie de cette troupe.
Merci à ma famille, puisqu'elle est toujours là, si compréhensive et soutenante.
Merci à mes amis: meilleure source de bon temps pour se changer les idées.
Merci au ministère du Développement durable, de l'Environnement et des Parcs du Québec pour les autorisations d'accès à la réserve écologique des Tourbières-de-Lanoraie.
Merci aux résidents de la région de Lanoraie pour m'avoir permis d'accéder à leurs propriétés.
Merci à l'aide financière octroyée par l'Institut de recherche en biologie végétale' (bourse Jacques-Rousseau) ainsi que par le Département de sciences biologiques (frais de délégation - étudiants/chercheurs et bourse de fin d'études).
Chapitre 1: Introduction générale
La variabilité spatiale, de la végétation au sein des écosystèmes est la résultante de
nombreux facteurs, reliés par un réseau complexe d'interactions, variant dans l'espace
et dans le temps. Les conditions environnementales sont depuis longtemps reconnues
comme étant les déterminants principaux des patrons de végétation (e.g. Whittaker
1956; Bray & Curtis 1957). L'effet structurant des perturbations sur la composition et la
dynamique spatio-temporelle de la végétation est également reconnu depuis plusieurs
années (White 1979; Pickett & White 1985; Laska 2001). La distribution des espèces
peut aussi suivre une structure spatiale régie par certains procédés biotiques et
abiotiques (Legendre & Fortin 1989). L'écologie du paysage permet l'étude intégrative
de tous ces facteurs (Forman 1995; Turner et al. 2001). L'un des défis futurs de ce
domaine en matière d'écologie végétale consiste à déterminer l'influence relative de
chacun d'eux sur la composition actuelle d'un milieu donné (de Blois et al. 2002a).
Dans le cadre de ce mémoire, les effets relatifs des perturbations anthropiques, des
conditions environnementales et de la spatialité sur la végétation actuelle d'un complexe
de milieux humides du sud du Québec seront analysés.
1.1 Facteurs de contrôle des patrons de végétation 1.1.1 Facteurs environnementaux
Les patrons de végétation sont depuis longtemps reconnus comme étant le résultat de
l'hétérogénéité des conditions environnementales (Whittaker 1956; Bray & Curtis 1957;
Peet 1981; ter Braak & Prentice 1988; Collins et al. 1993; Brown 1994; Villers-Ruiz et
al. 2003). Plusieurs études ont d'ailleurs démontré la grande importance des
caractéristiques édaphiques (e.g. nature du substrat, concentration en nutriments,
topographie) dans l'explication de la richesse ou de la composition spécifique de
2
Bellemare et al. 2005; Jones et al. 2008). À titre d'exemple, Theodose & Bowman
(1997) ont démontré que deux communautés de toundra alpine répondaient
distinctement en abondance et en diversité d'espèces selon différentes disponibilités en
nutriments (N, P, N+P).
La distribution des communautés le long des gradients environnementaux peut
toutefois être affectée par certains procédés biotiques tels que la facilitation et la
compétition interspécifique ou intraspécifique (Grime 1979; Tilman 1982; Pennings &
Callaway 1992; Callaway 1997; Weiher & Keddy 1999; Leathwick & Austin 2001;
Lortie et al. 2004). Par exemple, en examinant les liens entre les espèces de canopée et
les espèces de sous-bois dans les forêts alpines de l'Europe, Michalet et aL (2002) ont
trouvé que certaines communautés distinctes, présentes aux conditions extrêmes d'un
gradient climatique, étaient le résultat d'une différentiation de l'habitat, mais aussi des
effets positifs des espèces de la canopée.
1.1.2 Perturbations
Les perturbations, qu'elles soient d'origine naturelle ou anthropique, jouent un rôle
prédominant dans la dynamique des systèmes naturels et dans la structuration des
patrons de végétation (White 1979; Pickett & White 1985; Laska 2001). Bien qu'il
existe plusieurs définitions du terme «perturbation », elles évoquent généralement
l'altération d'un écosystème, d'une communauté ou d'une population ainsi que la
modification de l'environnement physique et de la disponibilité des ressources, suite à
un événement plus ou moins discret dans le temps (Pickett & White 1985). Ainsi, la
composition floristique d'un site et sa variabilité spatiale proviennent non seulement de
l 'hétérogénéité environnementale mais aussi de la nature, de la fréquence et de
3
Les perturbations d'origine naturelle, telles que le feu, le vent et les infestations
d'insectes, agissent comme processus dominants dans la dynamique et la structuration
de plusieurs écosystèmes (Dayton et al. 1992; Roberts 2004; Jolmson & Miyanishi
2007). Par exemple, dans la forêt boréale, le feu est la perturbation naturelle la plus
importante. Il est à l'origine d'une mosaïque de communautés d'âge, de superficie et de
composition différents (Heinselman 1981; Payette 1992). Parmi les changements de
végétation observés suite à son passage, on peut mentionner l'établissement rapide
d'espèces à reproduction végétative (e.g. Populus tremuloides) ou à cônes sérotineux
(e.g. Pin us banksiana) et la recolonisation tardive des mousses (e.g. Hylocomium
spendens) et des lichens, celle-ci se produisant seulement suite à la fermeture de la
canopée (Heinselman 1981; Bergeron & Dubuc 1989; De Grandpré et al. 1993).
Les perturbations anthropiques sont aujourd'hui omniprésentes et leurs
conséquences peuvent différer en plusieurs points de celles des perturbations naturelles.
Par exemple, les perturbations naturelles favorisent le maintien de l'hétérogénéité du
paysage en raison de leur distribution et de leur fréquence plus ou moins aléatoires
(Grubb 1977). Au contraire, les activités humaines ont pour leur part tendance à
favoriser l'homogénéisation du territoire (Krummel et al. 1987; Turner & Ruscher
1988) puisqu'elles sont très sélectives, affectant certains écosystèmes plus fréquemment
que d'autres, se répartissent selon une logique humaine et touchent de plus grandes
superficies (Mladenoff et al. 1993). Elles causent donc des patrons spatiaux très
distincts des procédés naturels.
Lorsqu'un paysage est intensivement aménagé, les activités humaines peuvent
même altérer ou masquer l'effet des perturbations naturelles et des conditions
environnementales quant au déterminisme des patrons de végétation. Ceci fut démontré
4
White & Mladenoff 1994; Abrams & Ruffuer 1995; Foster et al. 1998; Fuller et al.
1998). Par exemple, Foster et al. (1998) et Fuller et al. (1998) ont montré que la
composition forestière actuelle de plusieurs secteurs de la Nouvelle-Angleterre était
essentiellement le reflet d'anciennes pratiques forestières et agricoles alors que celle des
forêts précoloniales était contrôlée par le climat, le feu et le type de substrat. Un
phénomène similaire a été décrit dans le paysage agroforestier du sud du Québec, où les
activités humaines ont supplanté les perturbations naturelles en fréquence et en
intensité. En conséquence, la composition actuelle de la végétation ne présente que très
peu de ressemblances avec le couvert forestier original (Bouchard et al. 1989; Brisson &
Bouchard 2003) et sa distribution est mieux prédite par l'historique de l'utilisation des
terres que par les conditions abiotiques locales (de Blois & Bouchard 1995, de Blois et
al. 2001).
l.1.3 Spatialité
La majorité des composantes analysées en biologie végétale (plantes, sol, perturbations,
phénomènes de dispersion et de compétition, etc.) possèdent des propriétés spatiales de
diffusion ou d'agrégation (Legendre & Fortin 1989; Leduc et al. 1992; Legendre 1993).
Incorporer « l'espace » aux autres facteurs explicatifs de la végétation permet de déceler
les relations entre les composantes tout en prenant en compte leurs propriétés spatiales.
Ainsi, une part de la variabilité de la végétation peut être expliquée par les variables
spatiales seules (composante spatiale pure) ou conjointement avec d'autres variables
explicatives, lorsque celles-ci sont aussi structurées spatialement (Borcard & Legendre
1994; Legendre & Legendre 1998). À titre d'exemple, Leduc et al. (1992) ont montré
qu'au-delà de l'influence des variables environnementales, la composition de la strate
arborescente d'une forêt du sud du Québec était déterminée par une composante
5
dispersion et de compétition ou encore de la configuration spatiale de facteurs non
inclus dans l'analyse, tels que des conditions environnementales ou l'utilisation passée
du territoire.
1.1.4 Influence relative des facteurs de contrôle
L'intégration des facteurs environnementaux, des perturbations et des composantes
spatiales dans l'explication des patrons de végétation et l'évaluation de leur importance
relative demeurent une pratique relativement marginale. Néanmoins, elle a été utilisée
avec succès dans des régions agroforestières (e.g. de Blois et al. 2002b; Aragon &
Morales 2003; Benjamin et al. 2005) et pour certains milieux humides (e.g. Jean &
Bouchard 1993; King et al. 2004; Alvarez-Cobelas et al. 2008; Givnish et al. 2008). Par
exemple, Jean & Bouchard (1993) ont montré que l'historique des sites et leur
localisation, en plus des variables abiotiques locales (e.g. épaisseur de tourbe, niveau
d'eau), permettaient d'expliquer une fraction significative de la composition végétale
des milieux humides du Lac Saint-François. Une étude réalisée dans les Everglades de
la Floride (King et al. 2004) a également montré qu'une portion significative de la
variabilité de la végétation pouvait être expliquée par la proximité spatiale des stations
d'échantillonnage (i.e. l'espace), et ce, particulièrement dans les zones perturbées. Les
résultats de cette étude suggèrent qu'avec l'augmentation des stress anthropiques sur le
milieu, les facteurs spatiaux prennent de l'importance et atténuent les liens entre la
composition en espèces et les variables environnementales. Enfin, dans les forêts
secondaires de l'Argentine, Aragon & Morales (2003) ont montré que les patrons de
végétation étaient reliés autant à des variables descriptives de perturbations
anthropiques (utilisation des terres, temps depuis l'abandon des terres) qu'à celles
environnementales (altitude, pente) et que toutes étaient significativement structurées
1.2 Facteurs de contrôle des patrons de végétation dans les tourbières 1.2.1 Facteurs environnementaux et perturbations naturelles
6
Les facteurs environnementaux responsables des patrons de végétation au sein des tourbières de l'hémisphère nord ont été largement étudiés (Gorham 1950; Sjors 1950; Sjors 1952; Vitt & Slack 1975; Glaser et al. 1990; Belland & Vitt 1995; Jeglum & He 1995; Wheeler & Proctor 2000; 0kland et al. 2001; Bragazza et al. 2005). Selon ces études, les principaux facteurs responsables des variations floristiques, à l'intérieur des tourbières et entre elles, sont la chimie de l'eau, la disponibilité de nutriments et l'humidité. La chimie de l'eau permet principalement d'expliquer la répartition de la végétation entre les tourbières ombrotrophes (dites pauvres) et les tourbièr~s minérotrophes (dites riches). pH et la conductivité corrigée sont les composantes majeures du gradient chimique (Vitt & Chee 1990; Vitt et al. 1995a) tandis que l'alcalinité et la concentration en cations (surtout Ca2+ et Mg2+) , généralement très corrélées à la conductivité, sont considérées comme de moins bons facteurs explicatifs (Vitt et al. 1995a; Campbell & Rochefort 2001). Pour sa part, l'humidité du substrat tourbeux, principalement régie par la hauteur de la nappe phréatique, est généralement utilisée pour expliquer la répartition des espèces en fonction de la micro topographie de surface (Clymo & Hayward 1982; Hayward & Clymo 1982; Gignac 1992). Il existe en effet une grande différence d'humidité entre les buttes et les dépressions, puisque la nappe phréatique ne suit pas la microtopographie (Andrus et al. 1983). Ainsi, les espèces plus résistantes à la dessiccation auront tendance à être plus abondantes au sommet des buttes alors que les dépressions sont plutôt colonisées d'espèces moins tolérantes.
Un gradient bordure-centre est aussi souvent décrit pour expliquer la répartition des espèces dans les tourbières et principalement des arbres et des arbustes (Sjors 1950;
7
Malmer 1986; Campbell & Rochefort 2001). Il s'agit d'un gradient spatial complexe
puisqu'il comporte de nombreux facteurs de contrôle sous-jacents et que ceux-ci
peuvent varier d'un site à 1'autre (0kland et al. 2001). Il implique principalement des
variables reliées à la morphologie et à l'hydrologie des tourbières. Par exemple, la
nappe phréatique est généralement plus basse et plus fluctuante en bordure des
tourbières ce qui induit une meilleure aération du substrat et favorise la croissance des
arbres et des arbustes. Des changements dans la chimie de l'eau peuvent aussi être
apparents le long de ce gradient, puisque la bordure bénéficie d'un enrichissement causé
par un écoulement du centre vers la périphérie et des milieux minéraux environnants
(Damman & Dowhan 1981; 0kland 1990; Bubier 1991; Bragazza 1999).
Les conséquences des perturbations naturelles, notamment des feux et des
. changements planétaires, sur les écosystèmes tourbeux ont aussi été relativement bien
étudiées. La plupart des études portant sur le feu montre que cette perturbation
occasionne peu d'impacts à long tenue sur la végétation des tourbières, surtout dans les
sites ombrotrophes dominés par les sphaignes (Jasieniuk & Johnson 1982; Foster &
Glaser 1986; Lavoie et aL 2001). Néanmoins, la remise en circulation des nutriments
suivant le passage d'un feu peut favoriser la prolifération, pour une période dépassant
. rarement 20 ou 40 ans, de certaines espèces dont Ledum groenlandicum, Vaccinium
spp., Cladonia spp., Pohlia nutans et Polytrichum spp. (Jasieniuk & Johnson 1982;
Foster 1984; Foster & Glaser 1986; Kuhry 1994; Benscoter et al. 2005; Benscoter
2006). Les feux peuvent aussi favoriser le maintien des tourbières à un stade non
forestier en éliminant les arbres et les arbustes, ce qui entraîne une remontée de la nappe
phréatique et favorise ultimement la croissance des sphaignes (Damman 1977;
Chambers 1997). D'autre part, beaucoup de recherches se sont intéressées à l'influence
8
1999a, 1999b; Ellis & Tallis 2000; Lavoie & Richard 2000; Hendon & Charman 2004).
Des périodes de climat plus chaud et/ou sec ont souvent été associées à la colonisation
d'espèces d'arbre ou à l'expansion de leur couvert (Gear & Huntler 1991; Pilcher et al.
1995; Pellerin & Lavoie 2003). Des études expérimentales ont pour leur part montré
qu'une augmentation de la température associée à une diminution du niveau de la nappe
phréatique causaient une augmentation de l'ordre de 50% du couvert des arbustes et une
diminution similaire du recouvrement des mousses et des herbacées (Weltzin et al.
2000,2003).
1.2.2 Perturbations anthropiques
À l'échelle mondiale, les tourbières sont exposées aux effets de plusieurs activités
humaines, spécialement en Europe, dans le nord des États-Unis et dans le sud du
Canada (Moore 2002). La première conséquence majeure des activités anthropiques est
la perte directe de superficie, surtout par la conversion de surfaces tourbeuses en terres
agricoles ou par 'l'urbanisation. L'exploitation des ressources végétales, comme
l'extraction de la tourbe pour la production de terreau horticole et la coupe forestière,
engendre aussi une dégradation directe du milieu. Enfin, certaines activités humaines
ont une incidence indirecte puisqu'elles agissent par la modification des variables
abiotiques. C'est le cas du drainage, de l'effet de bordure (par la modification de la
matrice environnante), de la pollution atmosphérique et de l'invasion d'espèces
exotiques. Par exemple, il a été démontré que la création de canaux de drainage dans les
tourbières ombrotrophes entraîne généralement une augmentation du couvert forestier,
associée à une diminution du recouvrement des sphaignes (Poulin et al. 1999; Frankl &
Schmeidl 2000; Freléchoux et al. 2000a). Plusieurs études expérimentales ont tenté
d'identifier la distance d'impact du drainage sur le niveau de la nappe phréatique
9
& Roberts 2006). Il a été établi qu'à une distance de 60 m, l'impact du canal de
drainage est toujours assez significatif pour augmenter la croissance des arbres (Roy et
al. 2000) et diminuer le recouvrement des sphaignes (Poulin et al. 1999). Les coupes
forestières sont pour leur part souvent associées à une augmentation d'espèces non
tourbicoles et pionnières de même qu'à une diminution de la richesse des bryophytes
(Chimner & Hart 1996; Roy et al. 2000; Locky & Bayley 2007). Par ailleurs, dans
certaines tourbières en apparence non perturbées, des modifications importantes de la
végétation ont été associées à la pollution atmosphérique. Ce fut le cas en Europe, où la
hausse des dépôts d'azote atmosphérique a engendré la diminution de l'abondance des
sphaignes ainsi qu'une augmentation des plantes vasculaires (Berendse et al. 2001;
Hoosbeek et al. 2002; Gunnarsson et al. 2002).
1.2.3 Influence relative des facteurs de contrôle
Plusieurs études ont tenté de déterminer l'importance relative des facteurs
environnementaux, des perturbations naturelles et des perturbations anthropiques sur la
composition de la végétation des tourbières en utilisant diverses techniques historiques
et paléoécologiques (e.g. Chapman & Rose 1991; Gunnarsson et al. 2002; Pellerin &
Lavoie 2003). Grâce à ce type d'approche, Hendon & Charman (2004) ont suggéré que
les activités humaines n'étaient pas la principale cause des changements de végétation ,
observés dans quelques tourbières ombrotrophes du nord de l'Angleterre, mais qu'elles
ont amplifié une tendance déjà engendrée par le climat. Pour leur part, Pellerin et
Lavoie (2003) considèrent qu'une interaction complexe entre le climat, le drainage et
des feux explique en grande partie l'expansion récente de la forêt dans les tourbières
ombrotrophes du Bas-Saint-Laurent. Tuittila et al. (2007) ont réalisé un exercice
similaire dans une tourbière ombrotrophe de Finlande, en intégrant toutefois une
10
dynamiques végétales des tourbières alors que leurs résultats révèlent que la succession de la végétation de la tourbière étudiée est contrôlée par différents facteurs, dont la succession auto génique (16% de la variance), les perturbations par le feu (entre 9-15%) et l'humidité (entre 26-29%).
À l'opposé, peu d'études ont tenté de quantifier le contrôle respectif des différents facteurs à l'aide des patrons actuels de végétation. À titre d'exemple, Lachance & Lavoie (2004) ont évalué, à l'aide d'analyses multivariées, l'influence relative de plusieurs variables abiotiques et spatio-historiques sur la composition floristique de 16 tourbières ombrotrophes du Bas-Saint-Laurent. Leurs résultats ont montré que les facteurs spatio-historiques étaient responsables de 22% de la variance observée dans les assemblages végétaux, contre 17% pour les facteurs abiotiques. Grâce à une étude similaire effectuée sur une tourbière abandonnée après exploitation (récolte de tourbe) dans la même région, Girard et al. (2002) ont montré que le niveau de la nappe phréatique, l'épaisseur de la tourbe et le pH étaient les principales variables responsables des patrons de régénération de la végétation et que ces variables étaient les mêmes que celles généralement observées dans les tourbières non perturbées. Ils ont donc conclu que même si le site était sévèrement perturbé, les facteurs déterminants de son écologie ne s'étaient pas modifiés. Toutefois, ils mentionnent également qu'une étude reposant uniquement sur les facteurs abiotiques créerait une image incomplète de la situation, car les vari~bles spatiales et historiques sont aussi très importantes puisqu'elles expliquent (seule ou en interaction) 44 % de la variation des espèces végétales. Dans ce cas, les activités humaines n'agiraient pas directement sur les règles d'assemblage des communautés végétales, mais plutôt par le biais d'une forte modification des facteurs abiotiques.
11
1.3 Complexe de milieux humides des Tourbières-de-Lanoraie
Les inventaires récents évaluent qu'il y aurait 170 millions d'hectares de tourbières au Canada, ce qui représenterait environ 17% de la surface terrestre du pays (Gorham 1990) .. Ces tourbières sont essentiellement situées dans les régions boréales et subarctiques (Tarnocai et al. 2005). Alors qu'environ 90% des tourbières du Canada seraient toujours à l'état naturel, la grande majorité des tourbières du sud du pays auraient été détruites, ou seraient sérieusement menacées par l'urbanisation, l'agriculture intensive et la déforestation (Poulin et al. 2004; Warner & Asada, 2006). Au Québec, une situation similaire est observée (Poulin & Pellerin 2001; Poulin et al. 2004).
Le complexe de milieux humides des Tourbières-de-Lanoraie est un cas type de cette situation. Il constitue un des derniers grands milieux naturels terrestres de la grande région métropolitaine de Montréal (Environnement du Québec 2002). Par ailleurs, il est considéré comme un écosystème refuge, car il abrite à la fois des plantes
méridionales et nordiques qui atteignent à cet endroit la limite sud de leur aire de répartition (Poulin & Pellerin 2001; Environnement du Québec 2002). Il présente donc un intérêt évident dans le contexte de la diversité écologique régionale.
D'origine deltaïque, le complexe des Tourbières-de-Lanoraie constitue les vestiges d'anciens' chenaux du fleuve Saint-Laurent que la végétation a peu à peu comblés (Environnement du Québec 2002). Il est maintenant composé d'une série de milieux humides plus ou moins indépendants les uns des autres, d'où son appellation de complexe de milieux humides. Ces milieux humides sont essentiellement des tourbières minérotrophes avec quelques îlots ombrotrophes, mais aussi des marais et marécages (Robillard 1998). De nature essentiellement forestière, le complexe comporte aussi des étendues plus ouvertes. On y trouve donc un continuum de milieux ombrotrophes et
12
minérotrophes de même que de milieux ouverts et forestiers. S'ajoutent à cette
mosaïque de paysages, différents degrés de perturbations. En effet, il a subi au cours des
dernières décennies, d'importantes pressions d'origine anthropique. Il a d'ailleurs été
estimé qu'environ 27% (21 km2) de la superficie totale du complexe tourbeux aurait été sévèrement perturbé d'une manière ou d'une autre par les activités humaines (Tardy &
Pellerin 2006). Les principales perturbations sont le drainage, l'exploitation forestière et
la fragmentation par plusieurs voies de circulation et lignes de transport électrique.
Néanmoins, ce pourcentage est sans contredit sous-estimé, puisqu'il a été évalué
essentiellement à partir des perturbations visibles sur des photographies aériennes prises
en 2005. De plus, au cours des derniers siècles, le complexe a été isolé dans une matrice
agricole et urbaine. À l'opposé, certaines portions semblent intègres, particulièrement
les secteurs ombrotrophes. La pérennité de quelques uns de ces secteurs est protégée
grâce notamment à la présence de la réserve écologique des Tourbières-de-Lanoraie,
une zone de 415 ha (environ 4% du complexe), propriété du gouvernement du Québec
depuis 1994.
Le complexe de milieux humides des Tourbières-de-Lanoraie représente donc
une rare opportunité de confronter la variabilité des conditions environnementales à
celle des perturbations anthropiques dans l'explication de la distribution actuelle de la
végétation.
1.4 Objectifs du mémoire
L'objectif général de cette étude est de comprendre l'impact des perturbations
anthropiques sur la végétation du complexe de milieux humides des
Tourbières-de-Lanoraie.
Les objectifs spécifiques sont de :
l3
(2) Analyser l'influence relative des perturbations anthropiques, des conditions environnementales et des composantes spatiales sur la végétation.
(3) Comprendre les effets spécifiques des perturbations anthropiques sur la composition, la richesse et le recouvrement de la végétation.
Dans un premier temps, ces objectifs seront abordés à l'échelle de l'ensemble du complexe et ensuite, pour les portions minérotrophes et ombrotrophes séparément. Enfin, les résultats obtenus permettront de soulever certaines avenues possibles quant à la gestion à long terme de cet écosystème.
1.5 Organisation du mémoire
Le premier chapitre du mémoire est l'introduction générale présentée précédemment. Le second chapitre, rédigé sous forme d'article, constitue le corps du mémoire. Une conclusion générale est présentée au chapitre 3. Les données ont été placées en annexe à la fin du mémoire.
Il est à noter que le chapitre deux sera soumis pour publication avec comme auteurs Marie-Eve Tousignant, Stéphanie Pellerin et Jacques Brisson. Le premier auteur (Marie-Eve Tousignant) a effectué l'échantillonnage, le traitement et l'analyse des données ainsi que la rédaction du manuscrit. Stéphanie Pellerin a élaboré et supervisé les travaux de recherche, corrigé et commenté le manuscrit. Jacques Brisson a corrigé et commenté le manuscrit.
Chapitre 2: Human impact on the vegetation of a large wetland complex
2.1 Introduction
The patterns of distribution, abundance and richness of plant species in heterogeneous
landscape is controlled by several and diverse factors, such as environrnental conditions,
natural disturbances, anthropogenic activities or space, that are acting at different
temporal and spàtial scales. One of the major challenges facing plant ecologists in a
landscape perspective is to quantify the relative strength of these factors (de Blois et al.
2002a). The direct and indirect effects of natural and anthropogenic factors on forest
ecosystems have been weIl studied in North America (e.g., Meilleur et al. 1994;
Motzkin et al. 1999; Donohue et al. 2000) and elsewhere (e.g., Zimmerman et al. 1995;
Aragon & Morales 2003; Kaniewski et al. 2007). For instance, it has been demonstrated
that human disturbances have altered, even obscured, the natural conditions (e.g.
climate, soil) and dynamics of eastem North America forests and led to significant
changes in forest type distribution (White & Mladenoff 1994; Abrams & Ruffner 1995;
Foster et al. 1998; Fuller et al. 1998). Similar results have been observed in
mountainous ecosystems of Turkey where the present composition and distribution of
upland vegetation are mainly determined by human activities, while physical factors
such as substrate, elevation and slope are of secondary importance (Kaniewski et al.
2007). Ruman activities differ in frequency and intensity from natural disturbances and
may engender novel biotic responses, disrupt existing relationships between the biota
and the environrnent and result in significant shifts in community composition and
dynamics (Mladenoff et al. 1993; Foster et al. 1997; Franklin et al. 2000).
Despite the fact that wetlands are more threatened than any other ecosystem type
worldwide, factors influencing their composition, structure and dynamics are only
15
Ecosystem Assessment 2005). Natural factors controlling vegetation gradients among
and within ombrotrophic and minerotrophic peatlands of northern hemisphere are weIl
understood (e.g., Sj6rs 1952; Vitt & Slack 1975; Malmer 1986; Glaser et al. 1990; Vitt
& Chee 1990; Jeglum & He 1995; Wheeler & Proctor 2000; 0kland et al. 2001; Kutnar
& MartinCic 2003; Gignac et al. 2004; Bubier et al. 2006). Furthermore, numerous
studies have addressed the specifie effects of one anthropogenic disturbance, su ch as
drainage (e.g., Laine et al. 1995a; MaIson et al 2008) or logging (e.g., Anderson et al.
2007; Locky & Bayley 2007), on the vegetation of peatlands. On the other hand, a
limited number of studies have assessed the respective influence of environmen:tal
factors as weIl as past and present anthropogenic factors on modem vegetation of
peatlands and other wetlands (Jean & Bouchard 1987; Jean & Bouchard 1993; Girard et
al. 2002; Pellerin and Lavoie 2003; Lachance & Lavoie 2004; Johnston et al. 2008).
However, none have investigated simultaneously the effect of different human activities
on different peatland types and the way such disturbances may overlay more stable
patterns of vegetation related to environmental gradients.
In this study, we aimed to understand the impact of several anthropogenic
disturbances on the vegetation of a large wetland complex of southern Québec. This
complex is mainly composed of ombrotrophic (bogs) and minerotrophic (fens)
peatlands and has been threatened by numerous anthropogenic activities. Our specifie
objectives are to 1) identify the main vegetation patterns and their control factors,
2) ana1yze the relative influence of anthropogenic, environmental and spatial factors on
the vegetation and 3) understand the relation between anthropogenic disturbances and
species composition, richness and cover. Correlations and multivariate analyses were
used to assess the vegetation heterogeneity and its main control factors at the broad
2.2 Methods 2.2.1 Studyarea
16
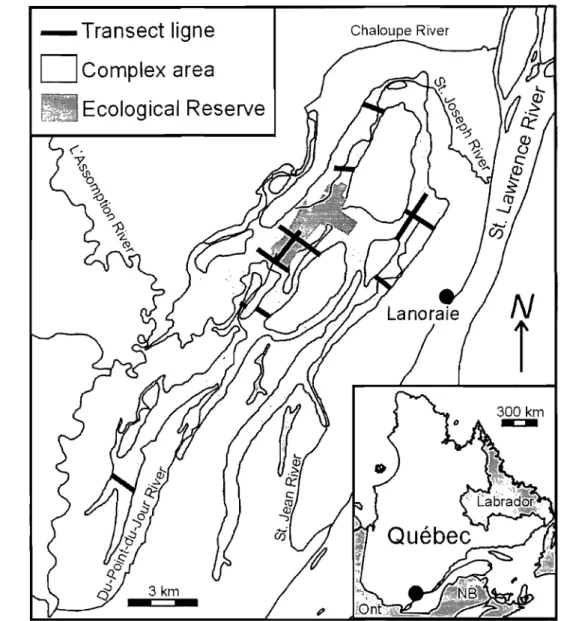
The Lanoraie wetland complex is located 40 km northeast of Montreal, on the north
shore of the St. Lawrence River, southem Québec, Canada (73°20'W, 46°00'N) and
co vers an area of 76 km2 (Fig. 1). The complex, inherited from the St. Lawrence River
palaeochannels, lays over low permeability clayey sÎlts of the Champlain Sea bordered
by the Lanoraie region terrace sands (Rosa & Larocque 2008). On mesic and xeric sites,
the regional forest is characterized by Acer saccharum, Betula papyrifera, Abies
balsamea, Tilia Americana, Tsuga canadensis and Pinus strobus (Ansseau et al. 1996).
The regional climate is humid continental with a mean annual temperature of 6°C. The
mean temperatures in January (coldest month) and July (warmest month) are -12 and
21°C, respectively. The mean annual precipitation averages 1006 mm, 22% of which
faUs as snow (Environment Canada 2002).
The complex is mainly composed of forested fens dominated by Acer rubrum,
Alnus incana ssp. rugosa and Ilex verticillata while Brachythecium mosses are
widespread on the ground layer. Scattered areas of forested and open bogs are also
present. Open bogs are characterized by a weIl developed pattern of hummocks and
hollows and are dominated by ericaceous shrubs and Sphagnum mosses. Swamps and
-
Transect ligne
D
Complex area
Ecological Reserve
17N
l
Figure 1. Location of the Lanoraie wetland complex, southem Québec, Canada and spatial distribution of the Il sampling transect hnes.
The Lanoraie wetland complex has approximately a 400 years history of
anthropogenic disturbances and is increasingly threatened by human activities
(Environnement Québec 2002; Tardy & Pellerin 2006). Since the beginning of the
European settlement of the Lanoraie region (ca 1630-1660), the complex has been used
for wood gathering. Coniferous stands have been intensively harvested, and especially
Thuya occidentalis trees that were used for posts and fences. During the 19th and 20th
centuries, several areas have been converted to agriculture and fragmented by the
18
the most recent mapping of the complex, approximately 18% (14 km2) of the site has
been permanently lost, mainly due to agriculture, housing development and peat
extraction, while 10% (7 km2) ofthe remaining areas has been recently logged (Tardy &
Pellerin 2006). However, the examination of historica1 aeria1 photographs (1933-1979)
also indicates that most of the complex areas, and especially the minerotrophic sectors,
have been disturbed by tree cutting during the past century (Tousignant & Pellerin,
unpul:5lished data). Furthermore, approximately 200 irrigation reservoirs or drainage
ditches have been created at the margins and within the complex (Tardy & Pellerin
2006). Unforested bogs as well as most of the open swamps located near the St. Joseph
River remain mostly untouched by human activities. Finally, the
Tourbières-de-Lanoraie Eco10gical Reserve (4.15 km2) was established in 1994 by the Québec' s
government to prote ct the largest open bog area of the complex. To ensure the
protection of other portions of the complex, approximately 4 km2 have also been
acquired by the Société de protection des terres humides, a nongovernmental agency.
2.2.2 Sampling and data collection
Eleven transect lines, ranging from 250 to 2500 m, were established throughout the
complex using digitized aerial photographs (2005) and forestry maps (Fig. 1). They
were distributed to capture the principal vegetation (bog vs. fen) and disturbance
(i.e. inside and outside protected areas) gradients. Transect lines are starting at least 5 m
from the complex limits. Sampling plots (5 x 5 m) were placed 50 m apart along
transects, except for the transect crossing the homogenous bog section of the Eco10gical
Reserve where the spacing was 100 m. Only plots located on anorganic deposit of at
least 30 cm where sampled. A total of 253 plots were surveyed during the summers of
19
Vegetation
A point-intercept sampling method was used to estimate the relative cover of each plant
species within each sampling plot (Bonham 1989). More precisely, six equidistant lines
of five met ers (1 m interval) were established. Along each of these lines, we recorded
aU vascular plants, mosses and liverworts touching the projection of a vertical rod
placed at six equidistant positions (N
=
36 points). The percentage of points where aspecies was observed represents its relative cover. Species nomenclature follows the
PLANTS Database (USDA & NRCS 2008).
Environmental conditions
Since the composition and structure of peatland plant communities are influenced by
many local environmental variables, we investigated sorne of the main parameters
known to regulate peatland vegetation (Table 1). We measured the lowest and highest
water table level at each plot from hoUows or excavated wells in early June and at the
end of August 2007. These dates of sampling were chosen following Rosa and
Larocque (2008) who measured water table levels during four years and showed that the
highest water table levels occurred in late Mayor early June while the lowest water
table levels are recorded at the end of August. Because water levels were meàsured with
positive values above the surface and negative values below the surface, a
transformation was made by adding the highest value to aU data so that the lowest level
below the surface equals zero. For analyses, the difference (indicating the fluctuation)
and the mean of the two values were used. Two water samples (25 ml) were also taken,
from hoUows or wells, in polyethylene bottles and stored at 4 oC until analyses. The
water pH and electrical conductivity were later measured in the laboratory. Conductivity
values were adjusted to 25 oC and corrected for the concentration of hydrogen ions
20
Penetrating Radar (Rosa et al. In press). We also measured the diameter at breast height
(dbh) of each tree (dbh 2: 1 cm) located in each plot to calculate the tree basal area. Tree
basal area was used as an indicator of the importance of tree coyer and shading. Finally,
the presence/absence ofwindfall was visually determined.
Table 1. Environmental and anthropogenic disturbance variables sampled m each sampling plot in the Lanoraie wetland complex, southem Québec.
Variable
Environmental
pH
Corrected conductivity (IJS/cm)
Tree basal area (m2/ha)
Windfall (presence/absence) Peat thickness (cm)
Mean water table level (cm) Water table level fluctuation (cm)
Anthropogenic disturbance
Percentage of disturbed area (%) Distance to the closest edge (m)
Distance to the closest drainage ditch (m) Logging index (0-4)
General disturbance index (0-16) *
Abbreviation pH Conductivity Basal area Windfall Peat Mean w.t.I. W.t.I. fluctuation % disturbed area Dedge Dditch Logging Disturbance index
*
variable not used in multivariate analysesAnthropogenic disturbances
The degree of anthropogenic disturbances for each plot was assessed usmg five
variables (Table 1). First, in the vicinity of each sampling plot, we noted any
woodcutting evidence, such as stumps or wood debris. These observations were coupled
with the analysis of aerial photographs (1933, 1979, 1997 and 2004) to estimate the
level of harvesting according to five categories of percentage of tree removed, i.e.,
0: 0 %,1: 1-25%,2: 26-50%, 3: 51-90%,4: 91-100%. For old cut areas (>50 years), the
percentage of tree removed was estimated only from aerial photographs. Because most
of these areas are now recolonized by trees, the logging index was reduced by one
category. AlI other anthropogenic variables were measured in a geographic information
21
(inc1uding drainage ditches, housing development, cultivated and cut areas, etc.) (Tardy
& Pellerin 2006) and aerial photographs. The distance separating each sampling plot
from the nearest drainage dit ch and edge were measured. Here, the term edge refers to
the linear transition between the wetland complex and other natural habitats, cultivated
fields or linear infrastructures (e.g., road, power line right-of-way and railroad). The
percentage of disturbed area (irrigation reservoirs, cultivated and logging areas, power
lines rights-of-way, etc.) within a buffer zone of 25 m radius from the middle of each
plot was also estimated. Finally, a general disturbance index was calculated, taking into
account equally the four disturbance measures (index ranging between 0 and 16). Only
in order to calculate this index, each disturbance were c1assified into five categories
(except logging, which is already into categories); drainage ditch and edge distances:
0: >200 m, 1: 200-101 m, 2: 100-51 m, 3: 50-26 m, 4: 26-0m and percentage of
disturbed area: 0: 0%,1: 1-25%,2: 26-50%, 3: 51-75%,4: 75-100%.
Spatial components
To take into account the spatial structure of the vegetation data and of the explicative
variables, a spatial matrix was generated with the geographical coordinates (X, Y) of
each sampling plot and with the third-degree polynomial function of the centered
coordinates (Legendre & Legendre 1998). These ni ne spatial variables (X, Y, XY, X 2,
y 2, X 2 Y, Y 2X , X 3 Y, Y 3 X) allow not only the detection of linear but also the quadratic
and cubic distributions of the data (Borcard et al. 1992).
2.2.3 Data analysis
AlI multivariate analyses were performed in the R Software (R Development Core
Team 2006), with a modified vegetation matrix; rare species (occurring in less than two
plots) were removed and a Hellinger's transformation was applied to account for the
22
Plant species assemblages and control factors
Vegetation data were classified and ordinated to identify the major assemblages of
species and to determine the factors related to the major axes of variation in the
vegetation. To identify plant species assemblages, a K-means non-hierarchical
partitioning analysis was performed using 250 random starting configurations. The most
characteristic species of each assemblage were then identified using IndVal indicator
species analysis. This method assesses the degree of specificity (uniqueness to a
particular group) and fidelity (frequency of occurrence within a particular group) of
species in groups defined a priori (Dufrêne & Legendre 1997). Probabilities identifying
significant indicator species were corrected by Holm's procedure for multiple testing
(Holm 1979). The main factors linked to vegetation heterogeneity were determined by a
redundancy analysis (RDA) of the vegetation data constrained by environment and
disturbance variables. The significance of the model was assessed using a permutation
test with 999 randomized runs. In addition, a forward selection procedure, with 999
random permutations, was performed to quantify the significance of each variable in
explaining vegetation gradients.
Species composition and relative influence of environmental, anthropogenic and spatial factors
Variation partitioning through multiple RDAs (Borcard et al. 1992; Borcard &
Legendre 1994) was conducted to evaluate the relative influence of environmental,
anthropogenic disturbance and spatial variables on the variation of vegetation. The
significance of the adjusted bimultivariate redundancy statistics (R;; Peres-Neto et al.
2006), was tested using permutation analysis of the raw data (Legendre & Legendre
1998).
According to the results obtained by this analysis as weIl as by the previous
23
plots; pH being the main factor responsible of this partition. This strong minerotrophic
-ombrotrophic gradient within the vegetation of the complex impedes the detection of
the influence of other variables. To overcome this problem, supplemental RDAs and
variation partitioning analyses were done on the species composition of bog and fen
plots separately following the method described above. Bog and fen sampling plots
were distinguished using pH values (pH :S 4.6 = bog; pH > 5.5 = fen) and a K-means
non-hierarchical partitioning analysis. Eighty plots were c1assified as bog and 173 as fen
(see Annexe 2).
Vegetation richness and cover and anthropogenic disturbances
Spearman's non-parametric correlations were used to evaluate the relationship between
anthropogenic disturbance variables and richness and cover of groups of species.
Species groups were distinguished in regards to life form (tree, shrub, herb and forb,
Sphagnum, other moss and hepatic), habitat preferences (peatland vs. nonpeatland
species) and origin (native vs. exotic species) (see Annexe 1). Species obligate,
occasional or facultative to peatlands (bog and fen) were c1assified as peatland species
while native or exotic species not normally observed in peatlands were c1assified as
nonpeatland species. Species habitat preferences follow Bouchard & Hay (1976),
Gauthier (1980), Bouchard et al. (1990), Vitt et al. (1988), Marie-Victorin (1995), Crow
& Hellquist (2000a, b), Garneau (2001) and Faubert (2007), while species origin was
identified using Marie-Victorin (1995) and Lavoie & Saint-Louis (c. Lavoie,
unpublished data). Habitat of sorne species remained uncertain; the y were not used for
these analyses. Richness and cover of the different groups of species were calculated
from the raw vegetation matrix. Correlations were done using JMP 7.0.1 (SAS Institute
24
2.3 Results
A total of 289 taxa were recorded throughout the 253 plots, inc1uding 213 vascular
species (23 trees, 48 shrubs, 142 herbs and forbs) and 76 bryophyte speCles
(16 Sphagnum, 50 other mosses, 10 hepatics) (see Annexe 1). Among them, 149 are
considered as typical peatland species, 90 as nonpeatland species and 10 as exotic
specles.
2.3.1 Plant species assemblages and control factors
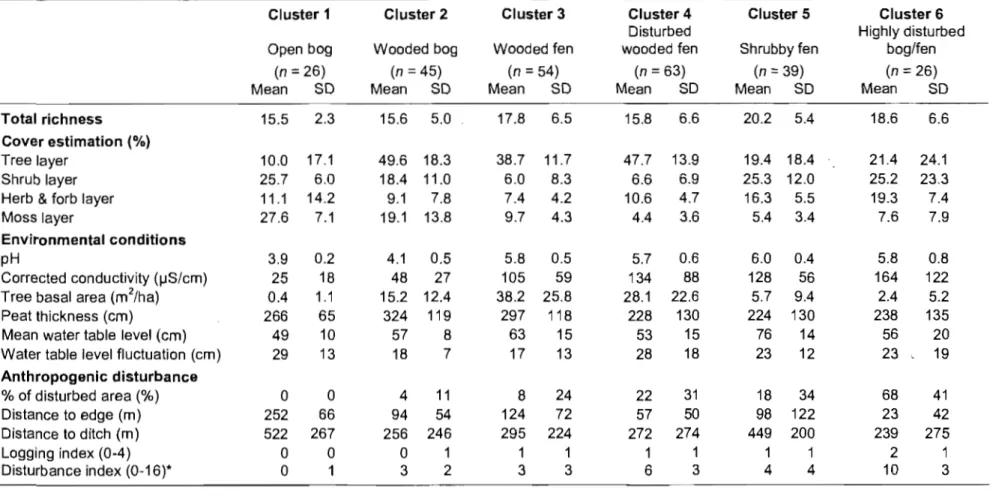
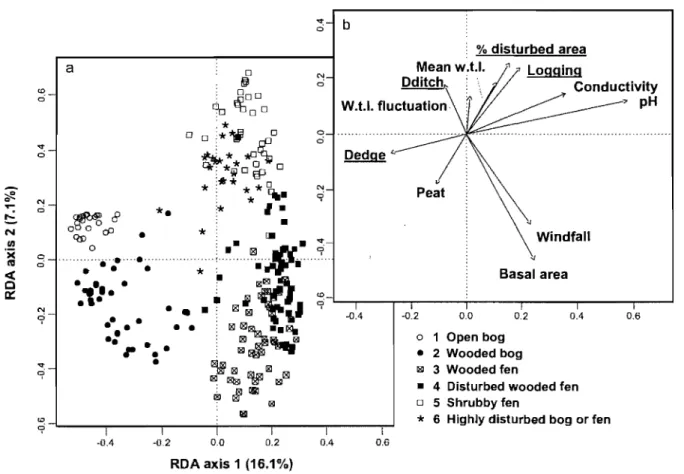
Six plant species assemblages (or c1usters) were recognized by the c1uster analysis
partitioning the plots based on vegetation data (Table II). These data constrained by
environmental and anthropogenic disturbance variables were explained at 32% (Fig. 2).
pH and corrected conductivity were the variables with the highest correlation with the
first RDA axis (r
=
-0.94 and -0.58). The second axis is mainly correlated with the tree25
Table II. Characterization of the six different plant species assemblages (clusters) at the Lanoraie wetland complex, southem Québec, obtained the K-means
Cluster 1 Cluster 2 Cluster 3 Cluster 4 Cluster 5 Cluster 6
Disturbed Highly disturbed
Open bog Wooded bog Wooded fen wooded fen Shrubby fen bog/fen
(n = 26) (n = 45) (n ::: 54) (n = 63) (n ::: 39) (n :::: 26)
Mean SD Mean SD Mean SD Mean SD Mean SD Mean SD
Total richness 15.5 2.3 15.6 5.0 17.8 6.5 15.8 6.6 20.2 5.4 18.6 6.6
Cover estimation (%)
Tree layer 10.0 17.1 49.6 18.3 38.7 11.7 47.7 13.9 19.4 18.4 21.4 24.1
Shrub layer 25.7 6.0 18.4 11.0 6.0 8.3 6.6 6.9 25.3 12.0 25.2 23.3
Herb & forb layer 11.1 14.2 9.1 7.8 7.4 4.2 10.6 4.7 16.3 5.5 19.3 7.4
Moss layer 27.6 7.1 19.1 13.8 9.7 4.3 4.4 3.6 5.4 3.4 7.6 7.9
Envitonmental conditions
pH 3.9 0.2 4.1 0.5 5.8 0.5 5.7 0.6 6.0 0.4 5.8 0.8
Corrected conductivity (IJS/cm) 25 18 48 27 105 59 134 88 128 56 164 122
Tree basal area (m2/ha) 0.4 1.1 15.2 12.4 38.2 25.8 28.1 22.6 5.7 9.4 2.4 5.2
Peat thickness (cm) 266 65 324 119 297 118 228 130 224 130 238 135
Mean water table level (cm) 49 10 57 8 63 15 53 15 76 14 56 20
Water table level fluctuation (cm) 29 13 18 7 17 13 28 18 23 12 23 19
Anthropogenic disturbance % of disturbed area (%) 0 0 4 11 8 24 22 31 18 34 68 41 Distance to edge (m) 252 66 94 54 124 72 57 50 98 122 23 42 Distance ta ditch (m) 522 267 256 246 295 224 272 274 449 200 239 275 Logging index (0-4) 0 0 0 1 1 1 1 1 1 1 2 1 Disturbance index (0-16)* 0 1 3 2 3 3 6 3 4 4 10 3
<0 ci
...
ci .-. èfi!. N....
ci!S
N III ';( 0 l'li ci«
CI cr: N '9...
'9 <0 9 a ~ 8*.
ooou(jJ Qs:) • o*
: :.
.
' ' ' ' ' ' ' ' ' ' ' ' ' ' ' ' . ' ' ' ' . ' ' " " " " , , , " " , , ' ,• •• •
• '1 •.1· ·
••••
-DA 1 -0,2 0,0•
0,2 RDA axis 1 (16.1%) N ci o ci DA b -004 1 0,6 26 % disturbed areaMean
w.u.
~ " LoggingDditch~ Conductivity -0,2 0,0 0,2 o 1 Open bog • 2 Wooded bog ~ 3 Wooded fen 004
• 4 Disturbed wooded fen o 5 Shrubby fen
*
6 Highly disturbed bog or fen" pH
0,6
Figure 2. Distribution of (a) 253 plots at the Lanoraie wetland complex on RDA ordination constrained by (b) environmental and anthropogenic disturbance variables (underlined). Plant species assemblages were obtained by the K-means analysis,
Cluster 1 (open bog) is characterized by typical open bog vegetation with low
pH and corrected conductivity. Indicator species induded Polytriehum strietum,
Sphagnum mosses (mainly S. rubel/um and S. magellanieum) and ericaceous shrubs
species (Rhododendron eanadense, Chamaedaphne ealyeulata, Ledum groenlandieum
and Kalmia polifoUa). Cluster 2 (wooded bog) shares many indicator species and
physicochemicai properties with Clusterl, but has a higher tree basal area and a thicker
peat deposit. Furthermore, plots in Cluster 2 are Iocated doser to drainage ditch than
plots in Cluster 1. Indicator species not shared with Cluster 1 induded Pleurozium
sehreberi, Pieea mariana, Larix laricina and Dieranum undulatum. Cluster 3 (wooded
fen) contains mînerotrophic sites characterized by a high tree basal area and a thick peat
deposit. This plant species assemblage is usually found in plots slightly disturbed by
27
Brachythecium spp., Picea mariana and Rhizomnium appalachianum have the highest
indicative value for this cluster. Cluster 4 (disturbed wooded fen) is characterized by the
abundance of me sic forest species (mainly Acer rubrum, Betula alleghaniensis, A.
balsamea and Dryopteris spinulosa), by the lowest bryophyte cover and by a high mean
disturbance index. The mean corrected conductivity and fluctuation of water table level
are relatively high. These plots usually surround those from cluster 3 and are located
closer to margin. Cluster 5 (shrubby fen) has the highest mean species richness and is
characterized by an important shrub cover and wet conditions (elevated water table). It
also has the lowest mean peat thickness and tree basal area. Sorne of these plots are in
riparian areas adjacent to streams where sites may have been affected by beaver
activities. Ilex verticillata, Alnus incana ssp. rugosa, Osmunda rega lis , Rubus
pubescens and Onoclea sensibilis are the principal indicator species. Cluster 6 (highly
disturbed bog or fen) is mainly composed of minerotrophic plots with sorne highly
disturbed bog plots. Important herb and forb cover and low tree basal area are
characterizing this plant species assemblage. This cluster is usually found adjacent to
margin. Most of the indicator species in Cluster 6 (Calamagrostis canadensis, Solidago
rugosa, Impatiens capensis, Galium triflorum, Populus tremuloides and Spiraea alba
ssp. latifolia) are nonpeatland species.
2.3.2 Species composition and relative influence of environmental, anthropogenic and
spatial factors
According to the RDA (Fig. 2) and variation partitioning do ne with the complete
vegetation dataset (Fig. 3a), the majority (75%) of the variation explained (33%) can be
ascribed to environmental variables, mainly to pH but also to conductivity and tree
basal area. Additional analyses for ombrotrophic and minerotrophic plots revealed
28
a. Ombrotrophic & minerotrophic plots b. Ombrotrophic plots c, Minerotro hic plots
Environment Dislurbance Environment Disturbance Environment Disturbance
Space Space
~ ____________ ~R~e~$id~u~als~=~6~7 ~ ____________ ~R~e=sid~ua=ls~=~5~6 ~ ____________ ~R~e=sid~u=als~=~7~6
Figure 3. Venn diagrams representing the results of variation partitioning, between the environmental, anthropogenic disturbance and spatial explanatory tables, of vegetation from (a) minerotrophic and ombrotrophic plots combined, (b) ombrotrophic plots and (c) minerotrophic plots in the Lanoraie wetland complex. The fractions, representing
R;,
are expressed as percentages.Ombrotrophic plots
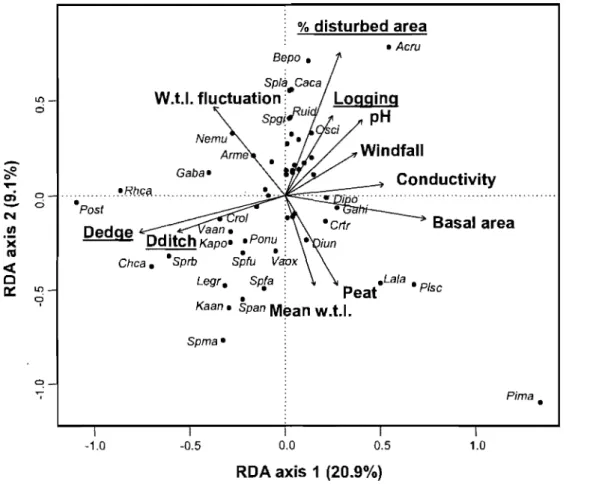
Environmental and anthropogenic disturbance variables explain together 47% of the
variation in the vegetation composition ofthese plots (Fig. 4). The first axis, explaining
21 % of the species data, is highly correlated with tree basal area (r 0.79), distance )
from the edge (r -0.8]) and distance from a drainage ditch (r = -0.60). This axis
represents a gradient from drained wooded plots to open undisturbed plots. The second
axis, explaining 9% of the species data, is mainly correlated with the percentage of
disturbed area (r -0.79). This axis depicts the transition between undisturbed bog
sectors characterized by true ombrotrophic species such as Sphagnum magellanicum,
Kalmia angustifolia and S. angustifolum to disturbed bogs characterized by the presence
of shade-intolerant hardwood (Acer rubrum and Betula populifolia) and more
, minerotrophic species such as Spiraea alba ssp. latifolia, Calamagrostis canadensis and
Osmunda cinnamomea. Also following the second axis, true ombrotrophic species are
...
1.0 cien
_ 0 ci N U) >( C'U <Cc
r::t: 1.0 9 % disturbed area Bepo. Splâ.Caea W.t.1. fluctuation: Nemu Arme spg~J?Ui • Aeru Conductivity roi .Dedge aan. : Basal area
Dditch Kapo • •
. .
Ponu :.
Chea. ·Sprb Spfu vaUx
Legr. Spfa ~ .Lala • Pl
• . : Peat sc
Kaan. Span Mèan W.t.1. Spma·
Pima.
-1.0 -0.5 0.0 0.5 1.0
RDA axis 1 (20.9%)
29
Figure 4. RDA of vegetation data sampled in the ombrotrophic plots of the Lanoraie wetland complex, southem Québec, constrained by the environmental and anthropogenic disturbance variables (underlined). W.U fluctuation and logging are considered non-significant variables using the forward selection procedure (p ~ 0.05). Species must be considered as vectors. Less correlated species have been taken off to c1arify the diagram. See Annexe 1 for species codes.
The first three explanatory variables selected by the forward selection procedure,
are an human disturbance variables: distance from an edge (F= 13.71, P 0.001),
percentage of disturbed area (F = 6.61, P = 0.001) and distance from a drainage ditch
(F= 7.18, P = 0.001). basal area (F = 4.98, P = 0.001) is the environmental
descriptor with the largest influence on plant species. Logging and fluctuation of water
table level have been considered non significant components of the model (P > 0.05).
They were however kept in the analysis for comparison with the minerotrophic sites.
Variance partitioning through environmental, anthropogenic disturbance and