1
Evaluation of the efficiency of an experimental biocover to reduce BTEX
1emissions from landfill biogas
23 4
Abderrahim Lakhouit1,2, Waldir N.Schirmer3,Terry R. Johnson4, Hubert Cabana1 and 5
Alexandre R.Cabral2,* 6
1Environmental Engineering Laboratory, Department of Civil Engineering, Université de 7
Sherbrooke, Sherbrooke, Quebec, Canada. 8
2Geoenvironmental Group, Department of Civil Engineering, Université de Sherbrooke, 9
Sherbrooke, Quebec, Canada. 10
3Department Environmental Engineering, Universidade Estadual do Centro-oeste, 11
Paraná, Brazil. 12
4Groundwater Protection Program, Waste Management Inc., Suite 202J, 3701 Shoreline 13
Drive, Wayzata MN 55391, USA. 14 15 16 17 *Corresponding Author: 18
Alexandre R. Cabral, ing.,Ph.D
19
Department of Civil Engineering
20
Université de Sherbrooke
21
2500, boul. de l'Université Sherbrooke (Québec), Canada, J1K 2R1
22
Tel : 819-821-7906, Fax : 819 821-7974
23
E-mail : [email protected]
24
Lakhouit, A., Schirmer, W.N., Johnson, T.R., Cabana, H. and Cabral, A.R. (2014). Evaluation of the efficiency of an experimental biocover to reduce BTEX emissions from landfill biogas. Chemosphere, 97, 98-101.
2
Abstract:
25
Landfill emissions include volatile organic compounds (VOCs) and, particularly,
26
benzene, toluene, ethyl-benzene and xylene isomers (collectively called BTEX). The
27
latter are the most common VOCs found in landfill biogas. BTEX affect air quality and
28
may be harmful to human health. In conjunction with a study aiming to evaluate the
29
efficiency of passive methane oxidizing biocovers, a complementary project was
30
developed with the specific goal of evaluating the reduction in VOC emissions due to the
31
installation of a biocover. One of the biocovers constructed at the Saint-Nicéphore
32
(Quebec, Canada) landfill site was instrumented for this purpose. The total BTEX
33
concentration in the raw biogas ranged from 28.7 to 65.4 ppmv, and the measured
34
concentration of BTEX in biogas emitted through the biocover ranged from below the
35
limit of detection (BLD) to 2.1 ppmv. The other volatile organic compounds (OVOC)
36
concentration varied from 18.8 to 40.4 ppmv and from 0.8 to 1.2 ppmv in the raw biogas
37
and in the emitted biogas, respectively. The results obtained showed that the biocover
38
effectiveness ranged from 67 to 100% and from 96 to 97% for BTEX and OVOC,
39
respectively.
40 41 42
Key words: biogas, biocover efficiency, landfill, volatile organic compounds 43
3
1. Introduction
44
Landfill biogas (LFG) is produced under anaerobic conditions by the biodegradation
45
of the waste materials (Chiriac et al., 2007). The composition of LFG varies significantly
46
both spatially and temporally but generally includes 40 to 45 vol% CO2, 55 to 65 vol%
47
CH4, and minor quantities of organic alcohols, aromatic hydrocarbons, halogenated
48
compounds, sulfur compounds, etc. LFG typically includes numerous volatile organic
49
compounds (VOCs) (Durmusoglu et al., 2010; Rasi et al., 2011), which are formed in
50
landfills as intermediary or final products of microbial or abiotic degradation processes
51
(Chiriac et al., 2007; Rasi et al., 2011).
52
Common VOCs found in LFG are benzene, toluene, ethyl-benzene and xylene
53
isomers (Durmusoglu et al., 2010), commonly referred as BTEX. The BTEX compounds
54
form an important group of VOCs because of their deleterious effect on the tropospheric
55
chemistry and due to their neurotoxic, carcinogenic and teratogenic properties (Allen et
56
al., 1997; Durmusoglu et al., 2010). The VOC concentrations in LFG range from 0.2 to
57
4500 mg m-3 and their concentration range depends on the age, quantity, quality and
58
origin of the waste - which can vary from one landfill cell to another, as well as on the
59
climatic conditions prevailing in the area where the landfill is installed (Durmusoglu et
60
al., 2010).
61
One promising biotechnology to attenuate landfill surface emissions is to install a
62
biocover over the site (Hrad et al., 2012). Although a significant body of literature exists
63
about the reduction of methane emissions from landfills with such technology (Scheutz et
4
al., 2009), few studies (e.g. Scheutz et al., 2008; Durmusoglu et al., 2010) have focused
65
on VOC removal by biocovers.
66
2. Materials and Methods
672.1. Description of the Experimental Passive Methane Oxidizing Biocovers 68
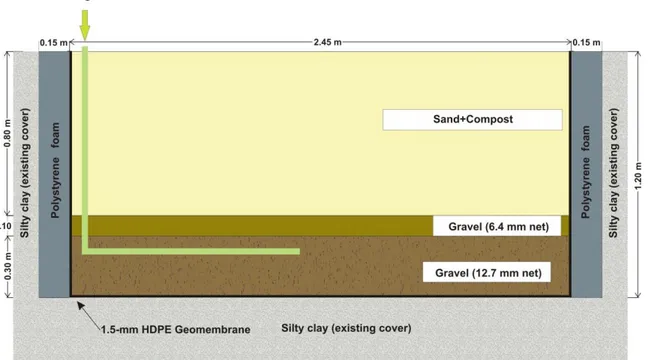
The experimental biocover (Fig. 1) was constructed in 2006 within an existing final
69
cover of the Saint-Nicéphore (Quebec, Canada) landfill in an area where the waste mass
70
was approximately 5 yr old. This biocover is 2.75 m wide, 9.75 m long and 1.2 m deep
71
and is composed of the following layers, from bottom up: i) a 0.3 m layer of 12.7 mm
72
clean gravel, whose role is to distribute the biogas as uniformly as possible; ii) a 0.1 m
73
transitional layer of 6.4 mm gravel; and iii) a 0.8 m substrate layer. The substrate
74
consisted of a mixture of five volumes of compost (before sieving through a 12 mm
75
industrial sieve) and one volume of coarse sand. The biocover was fed to the gravel layer
76
from a dedicated biogas well at a controlled flow rate. The biogas loading during the
77
monitoring campaign was approximately 7 L min-1.
78
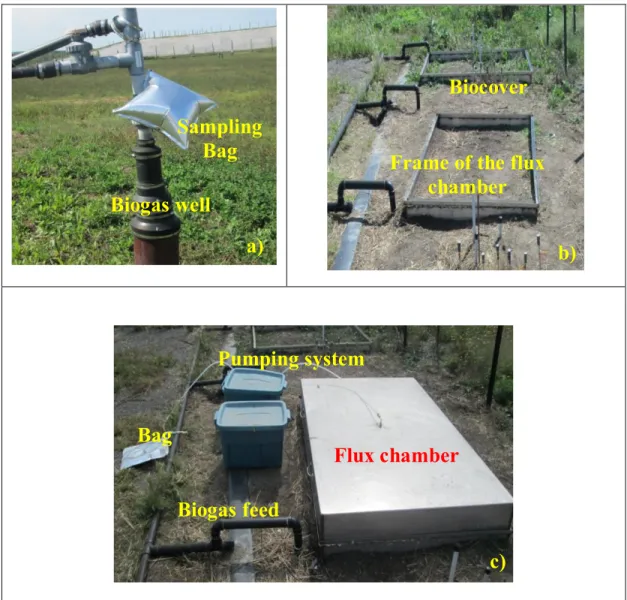
2.2. Biogas sampling 79
Ten sampling campaigns took place from August 14, 2012 through September 10,
80
2012. For each sampling campaign, a 10 L sample of raw biogas was collected from a
81
biogas collecting well into Tedlar bags (Fig. 2a). In order to collect the emitted biogas, a
82
260 L rectangular steel flux chamber was used (Fig. 2c). The flux chamber is 1.8 m (L),
83
1.2 m (W) with a height of 0.12 m. The chamber was mounted on a metal frame that was
84
inserted to a depth of 0.1 m into the biocover (Fig. 2b). A peristaltic pump was used to
85
collect 10 L samples from the flux chamber into the Tedlar bags. The peristaltic pump
5
flux rate was adjusted to a value equal to the methane surface flux, which was measured
87
as part of the activities of another on-going project.
88
2.3. Analytical equipment 89
A solid-phase micro-extraction (SPME) fibre (Carboxen/PDMS, 85 µm, Supelco,
90
Bellefonte, PA, USA) was used to extract and concentrate VOCs from the biogas
91
collected at Saint-Nicéphore landfill site. The SPME method has been frequently
92
employed to identify VOCs from various sources (Davoli et al., 2003; Kleeberg et al.,
93
2005; Capelli et al., 2012).
94
For the identification and the quantification of VOCs, a GC-MS (G1800A,
Hewlett-95
Packard, Agilent Technologies, Mississauga, ON, Canada) equipped with an electron
96
ionization detector and an HP-5 MS fused-silica column (30 m X 0.25 mm id., 0.25 mm
97
film thickness, Hewlett-Packard, Agilent Technologies, Mississauga, ON, Canada) was
98
used. The analyses were conducted in full-scan mode over an m/z range of 50 to 450 amu.
99
Calibration curves were prepared from 5 concentrations for each BTEX compound, each
100
time using triplicates. The detection limit was (in ppbv): 1.8, 38.1, 4.1 and 24.5 for
101
benzene, toluene, ethyl-benzene and xylene, respectively. The total BTEX and the other
102
volatile organic compound (OVOC) concentrations were expressed in terms of “toluene–
103
equivalent” (Chiriac et al, 2011). The performances of the biocover were evaluated in 104
terms of BTEX and OVOC removal efficiency (RE, %) and its associated elimination
105
capacity (EC, g m-3 h-1).
106
3. Results and discussions
1076
The BTEX concentrations in the raw biogas ranged from below the limit of detection
108
(BLD) to 21.9 ppmv (Table 1). Xylene exhibits the highest value, followed by toluene,
109
and ethylbenzene. In the emitted biogas, the BTEX concentration is in the range of BLD
110
to 1 ppmv (Table 1) and the highest value (1 ppmv) was obtained for toluene. Xylene and
111
ethylbenzene concentrations varied within a narrow range of concentrations (0.5 to 0.7
112
ppmv). Benzene was not detected in either raw biogas or emitted biogas. In addition to
113
BTEX compounds, OVOCs were quantified in the raw and in the emitted biogas. A
114
summary of the OVOC concentrations is presented inTable 1. Over the sampling period, 115
the OVOC concentrations ranged from 18.8 to 40.4 ppmv in the raw biogas, and from 0.8
116
to 1.2 ppmv in the emitted biogas. The total BTEX concentration ranged from 28.7 to
117
65.4 ppmv in the raw biogas, and from BLD to 2.1 ppmv in the emitted biogas.
118
Results of the RE to reduce VOC emissions are given in Table 2. The RE in reducing
119
biogas emissions ranged from 67 to nearly 100% for BTEX, and from 96 to 97% for
120
OVOCs. The associated EC ranged from 0.5 to 0.9, from 0.1 to 0.5 and from 0.7 to 1.2
121
mg m-3 h-1 for toluene, ethylbenzene and xylene, respectively. For OVOC, EC was in the
122
range of 0.9 to 1.9 mg m-3 h-1.
123
The high rates of RE to reduce VOC emissions obtained can be influenced by a
124
number of factors such as: i) the moisture and the temperature in the biocover, ii) the soil
125
pH (Lu et al., 2002), and iii) the organic nutrients available in the biocover soil (Lu et al.,
126
2002). The organic matter content indicates the presence of nutrients for bacterial growth
127
(e.g. Ait-Benichou et al., 2009). In our biocover, organic matter content equal to 20%
128
go.m/gdry soil. It was reported that a biofilter composed of natural packing materials like
7
compost demonstrated better performance in VOC removal compared to soil amendment
130
(Cho et al., 2009).
131
During the sampling period, the atmospheric temperature at the Saint-Nicéphore
132
landfill site varied from 13 to 28 °C. Over the same period, the soil temperature at 10 cm
133
in the biocover ranged from 30 to 35 °C. According to Cho et al. (2009) the suitable
134
temperature to remove BTEX in biofiters ranged from 23 to 33 °C.
135
The BTEX biodegradation reaction is inhibited in acidic environments (Hunt et al.,
136
1998). According to Lu et al (2002), biofilter efficiency to remove BTEX is greater than
137
80% when pH was in the range of 7.5 to 8. In this study, the pH value of the biocover
138
was equal to 7.2 ± 0.1.
139
Over the sampling period, the degree of water saturation (Sr) of the biocover was
140
measured at a depth of 10 cm and it was under 80%. These values are still lower than the
141
value beyond which the air within the pores of the substrate become occluded (i.e. Sr
142
85%) (Nagaraj et al., 2006). According to He et al. (He et al., 2008) and to Ait-Benichou
143
et al. (Ait-Benichou et al., 2009), the high values of the Sr of the biocover can be
144
attributed to the water-retention capacity of the organic matter rich substrate (compost).
145
When the value of Sr is below 13%, methanotrophic bacteria become inactive (Humer
146
and Lechner, 1999).
147
4. Conclusions
148Our results showed that the biocover installed on the landfill of Saint-Nicéphore is
149
effective reducing VOC emissions into atmosphere. It can be concluded that the biocover
8
represents an interesting biotechnology to reduce VOC emissions from landfill sites into
151
the atmosphere. To facilitate a better understanding of biocover VOC removal efficiency
152
from landfill sites, it would be of interest expanding our knowledge regarding: i) the
153
methanotroph count at the vertical profiling of biocover; ii) estimation of RE at different
154
vertical levels of the cover soil; iii) the vegetation effect on RE to reduce VOC emissions
155
from landfill; and iv) the relationship between methane oxidation and VOC removal by
156
the biocover.
157
Acknowledgments
158This study was supported by a Cooperative Research and Development Grant from
159
NSERC (Canada) and Waste Management (grant # CRD 379885–08). The invaluable
160
help of Jean-Guy Lemelin and Serge Bérubé for their technical support must be
161
acknowledged.
162
9
References
164
Ait-Benichou, S., Jugnia, L.-B., Greer, C.W., Cabral, A.R., 2009. Methanotrophs and
165
methanotrophic activity in engineered landfill biocovers. Waste Manag. 29,
166
2509-2517.
167
Allen, M.R., Braithwaite, A., Hills, C.C., 1997. Trace organic compounds in landfill gas
168
at seven U.K. waste disposal sites. J. Environ. Sci. Technol. 31, 1054-1061.
169
Capelli, L., Sironi, S., Del Rosso, R., Bianchi, G., Davoli, E., 2012. Evaluating the
170
dispersion of toxic odour emissions from complex sources. J. Environ. Sci.
171
Health. Part A Toxic/Hazard. Subst. Environ. Eng. 47, 1113-1122.
172
Chiriac, R., Carre, J., Perrodin, Y., Fine, L., Letoffe, J.-M., 2007. Characterisation of
173
VOCs emitted by open cells receiving municipal solid waste. J. Hazard.
174
Mater. 149, 249-263.
175
Cho, E., Galera, M.M., Lorenzana, A., Chung, W.-J., 2009. Ethylbenzene, o-xylene, and
176
BTEX removal by Sphingomonas sp. D3K1 in rock wool-compost
177
biofilters. Environ. Eng. Sci. 26, 45-52.
178
Davoli, E., Gangai, M.L., Morselli, L., Tonelli, D., 2003. Characterisation of odorants
179
emissions from landfills by SPME and GC/MS. Chemosphere 51, 357-368.
180
Durmusoglu, E., Taspinar, F., Karademir, A., 2010. Health risk assessment of BTEX
181
emissions in the landfill environment. J. Hazard. Mater. 176, 870-877.
182
He, R., Ruan, A., Jiang, C., Shen, D.-S., 2008. Responses of oxidation rate and microbial
183
communities to methane in simulated landfill cover soil microcosms.
184
Bioresour. Technol. 99, 7192-7199.
10
Humer, M., Lechner, P.P., 1999. Alternative approach to the elimination of greenhouse
186
gases from old landfills. Waste Manag. Res. 17, 443-452.
187
Hunt, M.J., Borden, R.C., Barlaz, M.A., 1998. Determining anaerobic BTEX decay rates
188
in a contaminated aquifer. J. Hydrol. Eng. 3, 285-293.
189
Kleeberg, K.K., Liu, Y., Jans, M., Schlegelmilch, M., Streese, J., Stegmann, R., 2005.
190
Development of a simple and sensitive method for the characterization of
191
odorous waste gas emissions by means of solid-phase microextraction
192
(SPME) and GC-MS/olfactometry. Waste Manag. 25, 872-879.
193
Lu, C., Lin, M.-R., Chu, C., 2002. Effects of pH, moisture, and flow pattern on
trickle-194
bed air biofilter performance for BTEX removal. Adv. Environ. Res. 6,
99-195
106.
196
Nagaraj, S., T., Lutenegger, J., A., Pandian, S., N., Manoj, M., 2006. Rapid estimation of
197
compaction parameters for field control. Geotech. Test. J. 29, 497-506.
198
Rasi, S., Läntelä, J., Rintala, J., 2011. Trace compounds affecting biogas energy
199
utilisation - A review. Energ. Convers. Manage. 52, 3369-3375.
200
Scheutz, C., Bogner, J., Chanton, J.P., Blake, D., Morcet, M., Aran, C., Kjeldsen, P.,
201
2008. Atmospheric emissions and attenuation of non-methane organic
202
compounds in cover soils at a French landfill. Waste Manag. 28, 1892-1908.
203
Scheutz, C., Kjeldsen, P., Bogner, J.E., De Visscher, A., Gebert, J., Hilger, H.A.,
Huber-204
Humer, M., Spokas, K., 2009. Microbial methane oxidation processes and
205
technologies for mitigation of landfill gas emissions. Waste Manag. Res. 27,
206
409-455.
207 208
Figure captions
Fig. 2 Equipment to collect raw and emitted biogas a) Tedlar bags, b) metal frame, and c) flux chamber
a)
Sampling
Bag
Biogas well
Frame of the flux
chamber
b)
Biocover
c)
Biogas feed
Bag
Pumping system
Flux chamber
Table captions
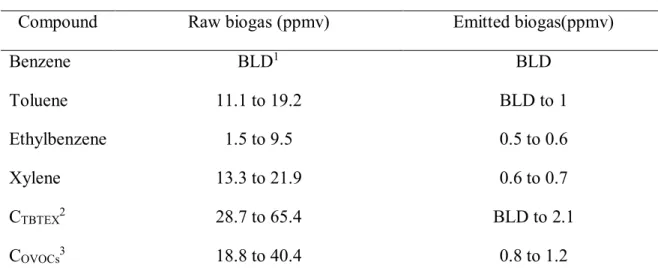
Table1 VOC concentrations range in LFG during the sampling period
Compound Raw biogas (ppmv) Emitted biogas(ppmv)
Benzene BLD1 BLD Toluene 11.1 to 19.2 BLD to 1 Ethylbenzene 1.5 to 9.5 0.5 to 0.6 Xylene 13.3 to 21.9 0.6 to 0.7 CTBTEX2 28.7 to 65.4 BLD to 2.1 COVOCs3 18.8 to 40.4 0.8 to 1.2
1= Below the limit of detection; 2= Total BTEX concentration; 3= Other volatile organic
compoundsconcentrations; BTEX excluded.
Table 2 Efficiency and elimination capacity of the biocover
Compound Biocover EC* (mg m-3 h-1) Efficiency (%)
Benzene N.A. N.A.
Toluene 0.5 to 0.9 95 to 100
Ethyl-benzene ~0.1 to 0.5 67 to 94
Xylene 0.7 to 1.2 95 to 97
OVOCs** 0.9 to 1.9 96 to 97
* = Elimination capacity;N. A. = Not applicable; ** = Other volatile organic compounds (BTEX excluded)