Explorative metabarcoding of Abies balsamea L. Mill.
endomycobiota
Thèse
Julien Ponchart
Doctorat en sciences forestières
Philosophiæ doctor (Ph. D.)
Explorative metabarcoding of
Abies balsamea L. Mill. endomycobiota
Thèse
Julien Ponchart
Sous la direction de :
Louis Bernier, directeur de recherche
Jean Bérubé, codirecteur de recherche
Résumé
L’étude des champignons endophytes, ainsi que celle des autres composants du microbiote des plantes, a fortement bénéficié du développement des techniques de séquençage à haut débit à la fin des années 2000. Ces progrès technologiques ont notamment permis la popularisation du métabarcoding, une approche servant à identifier les composants de la biodiversité et d’étudier leur distribution au sein d’échantillons environnementaux grâce à leur contenu en ADN. L’abondance des données produites, ainsi que la standardisation de la préparation des échantillons permises par ces techniques de séquençage ont modifié en profondeur la perception de l’ampleur de la diversité fongique. Cependant, les préceptes de l’endophytologie fongique restent majoritairement dictés par les études basées sur les mises en culture bien qu’elles ne parviennent, comme l’ont démontré les études moléculaires, qu’à récolter une partie de la diversité fongique. Les techniques de séquençage à haut débit ne sont pas sans biais elles aussi puisqu’elles tendent à majorer les estimations de la biodiversité même avec les analyses les plus poussées. Les objectifs principaux de cette thèse étaient tout d’abord de développer une approche analytique rigoureuse afin d’estimer de façon conservatrice la biodiversité associée aux données issues du pyroséquençage 454; puis, de développer une meilleure compréhension de la structure de l’endomycobiote des arbres en milieu forestier tout en remettant en question les conclusions des études basées sur les mises en culture.
La surestimation de la biodiversité est essentiellement liée à la conservation de séquences erronées qui participent à la formation du nombre important de singletons et doubletons généralement observés avec les techniques de séquençage à haut débit. Trois sources d’erreurs prédominent: la formation de chimères, la substitution de nucléotides lors de l’amplification et les erreurs de séquençage. Nous avons posé l’hypothèse que la sélection d’un sous fragment du code-barres moléculaire fongique, basée sur des propriétés particulières, pourrait si ce n’est identifier formellement ces séquences comme erronées, du moins limiter leur effet sur l’estimation de la biodiversité. Le fragment que nous avons considéré se compose du résidu de la petite sous-unité ribosomique (pSSU) situé à la suite de l’amorce ITS1F, et de l’espaceur transcrit interne 1 (ITS1). Nous avons montré qu’utiliser ce fragment pour analyser les données permet d’améliorer la sensibilité de la détection des chimères. La substitution de nucléotides ainsi que les erreurs de séquençage sont des phénomènes rares, et les séquences erronées sont donc faiblement représentées et relativement similaires à des séquences réelles et abondantes. Nous avons donc posé l’hypothèse qu’inclure le pSSU, dont la variabilité est plus faible que celle de l’ITS1, puisse étouffer l’impact de ces erreurs. Les séquences potentiellement erronées ont été regroupées avec les séquences réelles et abondantes dont elles déviaient, permettant ainsi de réduire la formation des singletons et des doubletons. Suite à cela, nous avons donc développé une méthode afin d’extraire directement le fragment pSSU-ITS1 des amplicons du code-barres fongique.
À partir de l’endomycobiote d’un unique sapin baumier que nous avons analysé afin d’évaluer notre traitement de données dans notre premier chapitre, nous avons observé qu’utiliser le fragment pSSU-ITS1 en lieu et place de seulement l’ITS1 n’affecte pas les conclusions sur la structure de la communauté des champignons endophytes. Bien qu’il faille le considérer dans le cadre d’un échantillonnage limité, nous avons évalué, semble-t-il pour la première fois, l’ampleur de la diversité des champignons endophytes recueillis dans un arbre à un moment donné et extrapolé cette richesse à 2 536 ± 73 mOTUs. Nous avons confirmé dans notre second chapitre que les champignons endophytes présentent une certaine spécificité de tissu puisque
l’endomycobiote des branches de sapins baumiers se divise selon le type de tissu considéré plutôt que de former une entité ubiquitaire uniformément répartie dans l’ensemble des branches. Enfin, dans notre dernier chapitre, nous avons montré que les mécanismes impliqués dans la colonisation de la plante hôte par les champignons endophytes se révèlent d’une complexité et d’une dynamique plus importantes que le processus d’accumulation passive suggéré par les études basées sur les mises en culture: les quatre dernières cohortes d’aiguilles de sapins baumiers que nous avons étudiées présentaient une diversité relativement conservée, mais des communautés différentes.
Abstract
As for the studies of other members of the plant microbiota, fungal endophytology has vastly benefited from the development of High Throughput Sequencing techniques in the late 2000s. This technological progress has notably allowed for the popularization of metabarcoding, i.e. a DNA-based approach to identify biodiversity components from environmental samples and study the community composition and distribution. The massive production of data, and the standardization in the sample preparations associated with such methods, have deeply modified the perception of the extent of the fungal biodiversity. Yet fungal endophytology precepts remain largely inherited from culture-dependent methods which have been shown to yield a more fractioned portion of the biodiversity than the molecular-based approach, as many fungi are not amenable to standard culturing. HTS techniques are not without drawbacks either as they tend to inflate the biodiversity estimates even with state of the art analysis. The main goals of this thesis were first to develop a more rigorous approach to analyse data obtained from 454 pyrosequencing, one of the original HTS techniques, in order to estimate conservatively the biodiversity; and then to develop a better understanding of the structure of forest trees endomycobiota and challenge earlier conclusions based on culture-dependent methods.
Inflation of the biodiversity is mostly due to remaining undetected erroneous sequences partially forming the large number of singletons and doubletons generally observed with HTS based studies. Three sources of error are significant: PCR chimeras, PCR single base substitutions, and sequencing error. Here we hypothesized that the selection of a sub-region of the fungal barcode displaying particular characteristics might, if not formally assess erroneous sequences as such, at least limit their impact on the estimation of the diversity. We thus considered a fragment composed of the partial ribosomal small sub-unit immediately following the ITS1F primer in addition of the ITS1 sub-locus (pSSU-ITS1). We showed that basing the analysis on the pSSU-ITS1 fragment enhances the sensitivity of chimera detection. As PCR single base substitutions and sequencing errors remain rare events, spurious sequences are rare too and somewhat similar to true abundant sequences. We hypothesized that the presence of the pSSU, whose variability is lower than that of the ITS1 sub-locus, might buffer these errors. Putative rare spurious sequences were grouped with the true abundant sequences they deviated from, thus reducing the proportion of singletons and doubletons. We then developed an approach to readily extract this pSSU-ITS1 fragment from fungal ITS amplicons.
We observed from the endomycobiota of a single balsam fir that we produced to test our data treatment in the first chapter that considering the pSSU-ITS1 fragment did not alter the conclusions on the structure of the fungal endophytic community from ITS1 analysis. While it has to be considered with appropriate reservations due to the limited sampling, we also estimated, for the first time to the best of our knowledge, the extent of the fungal endophyte biodiversity harboured by a single tree at a precise time with an extrapolation of 2 536 ± 73 mOTUs. In the second chapter on the endomycobiota present in the different tissue types of balsam fir branches, we confirm that some tissue specificity is exhibited by fungal endophytes as our results suggest that the aerial endomycobiota of balsam fir trees might be fractioned in distinct communities depending on the tissue types. Finally, in the third chapter, we reveal that the mechanisms of colonization of the host plant by fungal endophytes might be more complex and dynamic that the suggested passive accumulation hinted by culture-dependent methods. The last four cohorts of needles from balsam fir sampled displayed relatively similar diversities, but harboured distinct communities.
Table of contents
Résumé ... ii
Abstract ... iv
Table of contents ... v
List of figures ... viii
Figures ... viii
Supplementary Figure... ix
List of tables ... x
Tables ... x
Supplementary Table ... xi
List of abbreviations, acronyms ... xii
Acknowledgements... xvi
Preface ...xviii
Introduction... 1
1. Endophytism: definition and distribution ... 1
2. Fungal endophyte classes ... 2
3. Colonization through space and time ... 4
4. Assessing fungal diversity ... 6
5. Balsam fir in the context of global change ... 8
6. Scope of the thesis. ... 9
Chapter 1 SSU to the rescue: conserving the original partial SSU fragment ahead of the ITS1 sub-locus enhances the detection of putative chimeras and limits the formation of possibly spurious taxa in fungal metabarcoding ... 10
1.1 Résumé ... 11
1.2 Abstract ... 12
1.3 Introduction ... 13
1.4 Materials and Methods ... 15
1.4.1 Sampling and sample preparation ... 15
1.4.2 DNA extraction and library construction ... 16
1.4.3 Bioinformatic analyses ... 17
1.4.4 Ecological analyses... 19
1.5 Results ... 20
1.5.2 Community analysis ... 22
1.6 Discussion ... 24
1.7 Conclusion ... 28
1.8 Acknowledgements ... 29
1.9 References ... 29
Chapter 2 Diversity, community composition and structure of the endomycobiota of balsam fir trees (Abies balsamea [L.] Mill) as a function of tissue type ... 45
2.1 Résumé ... 46
2.2 Abstract ... 47
2.3 Introduction ... 48
2.4 Materials and Methods ... 50
2.4.1 Sample preparation, DNA extraction, PCR amplification, and sequencing ... 50
2.4.2 Data processing and statistical analyses ... 52
2.5 Results ... 54
2.6 Discussion ... 56
2.7 Conclusion ... 60
2.8 Acknowledgements ... 60
2.9 References ... 61
Chapter 3 Endomycobiotas of the last four cohorts of Abies balsamea needles display relatively similar diversities but different compositions... 80
3.1 Résumé ... 81
3.2 Abstract ... 82
3.3 Introduction ... 83
3.4 Materials and Methods ... 85
3.4.1 Sample preparation, DNA extraction, PCR amplification, and sequencing ... 85
3.4.2 Data processing and statistical analyses ... 86
3.5 Results ... 89 3.6 Discussion ... 91 3.7 Conclusion ... 94 3.8 Acknowledgements ... 95 3.9 References ... 95 Conclusion...112
1. Stringent data analysis. ...113
3. Time of exposure ...115
4. Limits ...115
5. Perspectives ...116
List of figures
Figures
Figure 1.1: Organization of ribosomal genes and target regions of 5’ extremity oligonucleotide for 5.8S.
Colours in the close-up of the beginning of the 5.8S indicate the frequency of the most common nucleotide among the aligned fungal sequences...34
Figure 1.2: Species accumulation curves (solid lines) and bootstrap estimates (long-dashed lines) of species
richness for ITS1 sub-locus based standard analysis (red) and pSSU-ITS1 fragment based analysis with the ITS3a-ITSx combination (blue). Dotted lines represent the 95% confidence intervals...35
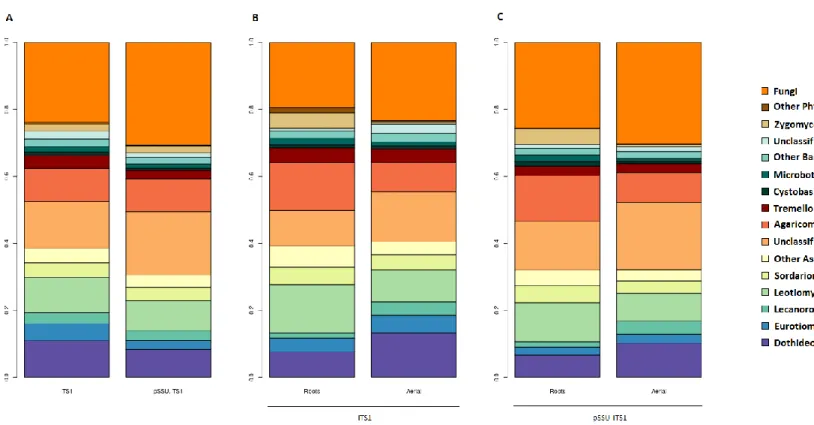
Figure 1.3: Relative abundance plots of fungal endophyte communities associated with the whole tree (A) by
plant system based on the ITS1 sub-locus standard analysis (B) and the pSSU-ITS1 fragment (C)...36
Figure 1.4: Results of diversity (A, B) and evenness (C, D) analyses between the root and the aerial systems
based on the ITS1 sub-locus standard analysis (A, C) and the pSSU-ITS1 fragment (B, D). Different letters on the top of the box plots represent significant differences after Kruskal-Wallis test or after ANOVA test with p ≤ 0.05...37
Figure 1.5: Non-metric multidimensional scaling (nMDS) plots of endophytic fungal communities, showing the
differences in community composition between the root system (brown circles) and the aerial system (needle samples: open green triangles, remaining aerial samples: closed green triangles) for the standard analysis based on the ITS1 sub-locus (A) and the pSSU-ITS1 fragment (B). One-way analysis of similarity (ANOSIM) indicates significant differences (P < 0.05) in community composition between the root and aerial systems. The Jaccard index was used to quantify community similarity for nMDS and ANOSIM...38
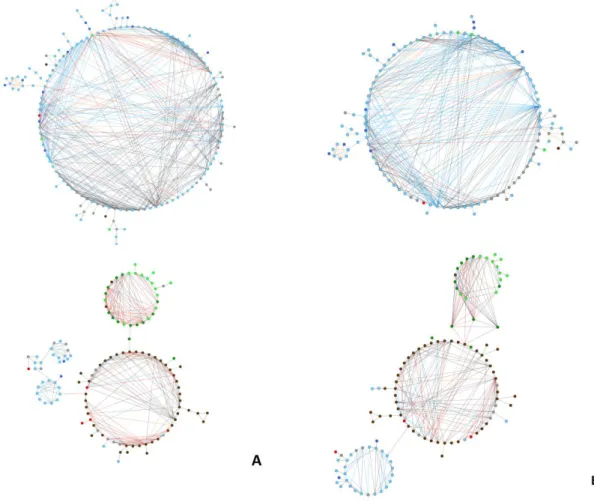
Figure 1.6: mOTUs co-occurrence networks displaying a root module and an aerial module for the standard
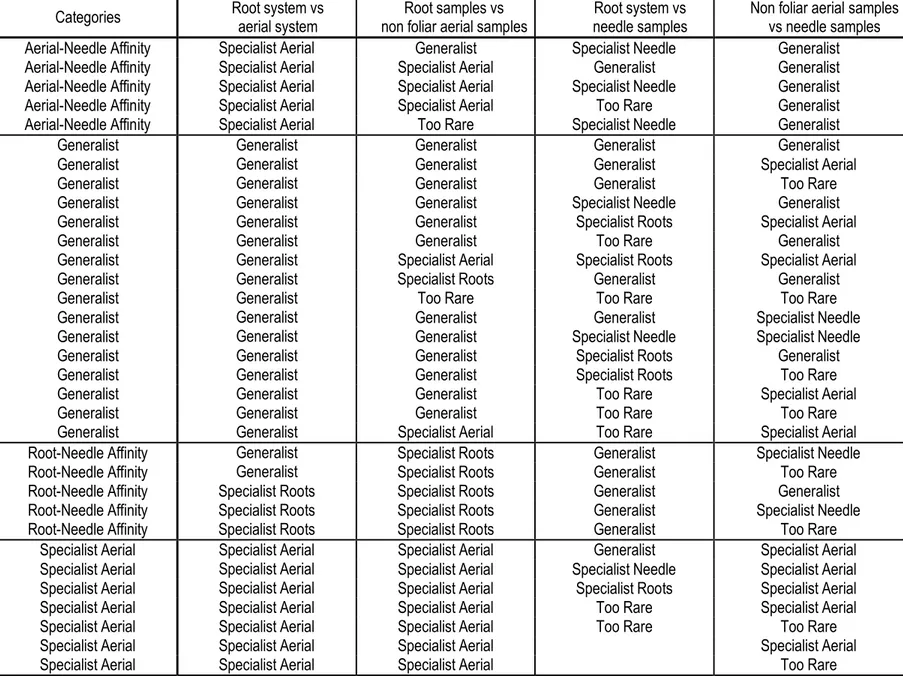
analysis based on the ITS1 sub-locus (A) and the pSSU-ITS1 fragment (B). Brown nodes represent root specialists, light blue aerial specialists, and light green needles specialists. Dark blue nodes represent aerial-needle affinity, and dark green root-aerial-needle affinity. Red nodes represent generalist taxa, and grey non habitat preference assigned. Grey edges were used when at least one of the nodes was assigned only to the kingdom level, blue edge only to Ascomycota, plum only to Basidiomycota, orange when both nodes were assigned to the same class, and red when both nodes were assigned to different classes. Pairwise Spearman’s rank correlations were considered if ρ > 0.6, and P-value < 0.01...39
Figure 2.1: Results of diversity (A, B) and evenness (C, D) analyses results among the stands (A, C) and
tissue types (B, D). Different letters on the top of the box plots represent significant differences after Kruskal-Wallis and DSCF tests or after ANOVA and Tukey tests with p ≤ 0.05...68
Figure 2.2: Non-metric multidimensional scaling (nMDS) plots of endophytic fungal communities, showing the
differences in community composition among the stands (open circles for Laverdière 01, closed circles for Laverdière 02, open triangles for La Chute 01, closed triangles for La Chute 02) and the tissue types (green for needles, purple for buds, brown for bark, yellow for wood). One-way analysis of similarity (ANOSIM) indicates significant differences (P < 0.05) in community composition both among the stands and the tissue types. The Jaccard index was used to quantify community similarity for nMDS and ANOSIM...69
Figure 2.3: Relative abundance plots of fungal endophyte communities by stand (A) and tissue type
(B)...70
Figure 2.4: mOTUs co-occurrence network displaying two main modules. Nodes colour represents taxonomy
assignment (as defined for Figure 2.3). Pairwise Spearman’s rank correlations were considered if ρ > 0.6, and P-value < 0.01...71
Figure 3.1: Species accumulation curves (solid lines) and bootstrap estimate (long-dashed lines) of species
richness for the full dataset. Dotted lines represent the 95% confidence intervals...101
Figure 3.2: Results of diversity (A, B) and evenness (C, D) analyses results among stands (A, C) and needle
cohorts (B, D). Different letters on the top of the box plots represent significant differences after Kruskal-Wallis and DSCF tests or after ANOVA and Tukey tests with p ≤ 0.05...102
Figure 3.3: Non-metric multidimensional scaling (nMDS) plots of endophytic fungal communities, showing the
differences in community composition among the stands (A) (circles: Laverdiere 01, squares: Laverdiere 02, triangles: La Chute 01, diamonds: La Chute 02) and needle cohorts (B) (circles: current year, squares: 1-year-old, triangles: 2-year-1-year-old, diamonds: 3-year-old). One-way analysis of similarity (ANOSIM) indicates significant differences (P < 0.05) in community composition both between the stands and the tissue types. The Jaccard index was used to quantify community similarity for nMDS and ANOSIM...103
Figure 3.4: Relative abundance plots of fungal endophyte communities by stand (A) and needle cohort
(B)...104
Figure 3.5: mOTUs co-occurrence network displaying two main modules. Pairwise Spearman’s rank
correlations were considered if ρ > 0.6, and P-value < 0.01...105
Supplementary Figure
Figure S2.1: Species accumulation curves (solid lines) and bootstrap estimate (long-dashed lines) of species
richness for the full dataset (A) and for each tissue type (B) (Needles: green, Buds: purple, Bark: brown, Wood: yellow). Dotted lines represent the 95% confidence intervals...79
List of tables
Tables
Table 1.1: Influence of ITS extraction methods, fragment used for chimera detection, and for
clustering...40
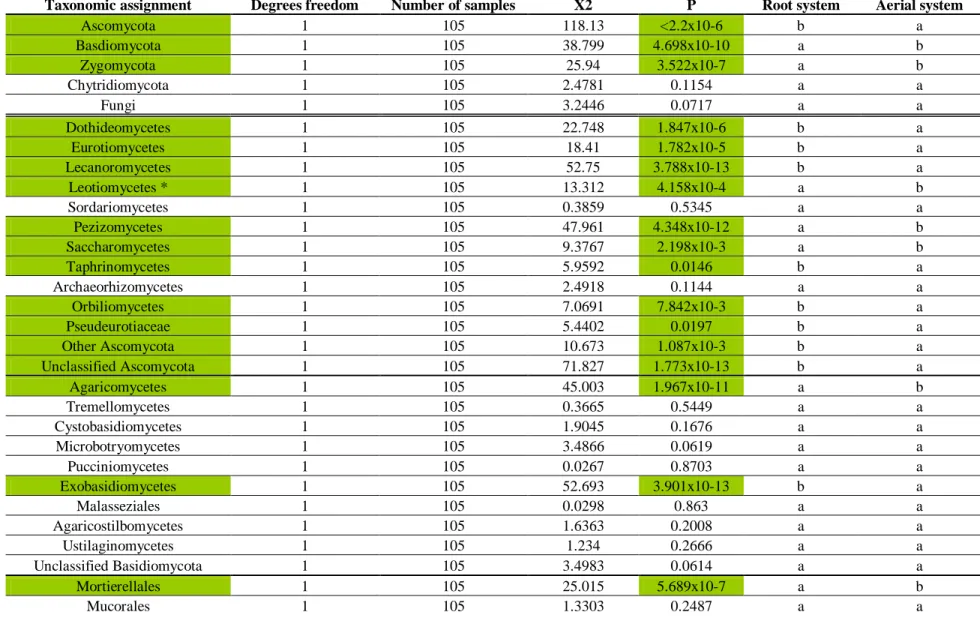
Table 1.2: Kruskal-Wallis tests of the average relative abundance of fungal phylum and classes between the
root and aerial systems for the standard analysis based on the ITS1 sub-locus. Significant differences (p ≤ 0.05) are highlighted in green. Alphabetical order follows decreasing values. * indicates data were subjected to ANOVA test instead of Kruskal-Wallis test...41
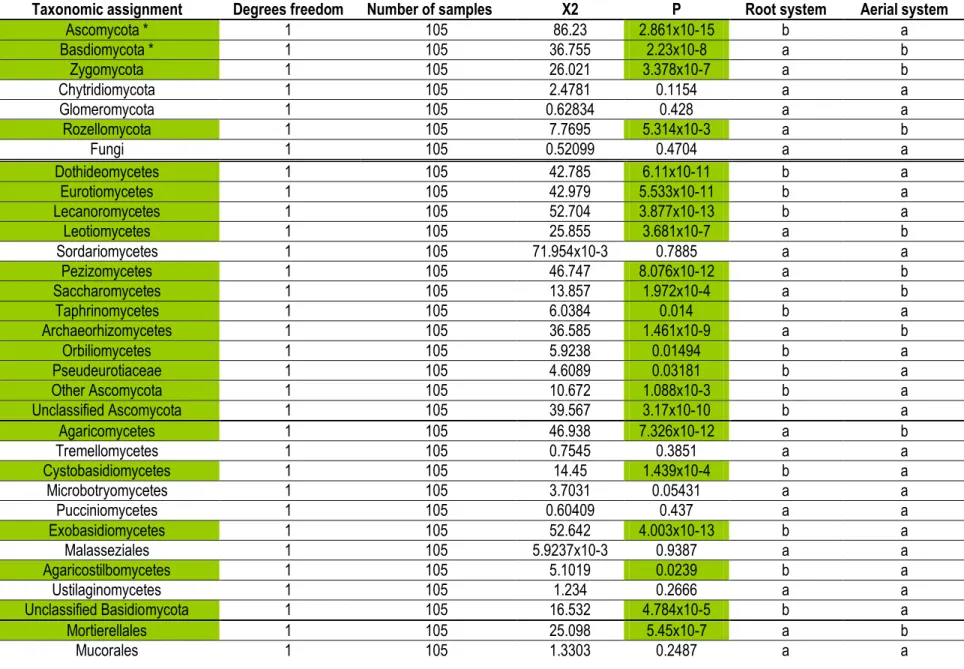
Table 1.3: Kruskal-Wallis tests of the average relative abundance of fungal phylum and classes between the
root and aerial systems for the pSSU-ITS1 fragment based analysis. Significant differences (p ≤ 0.05) are highlighted in green. Alphabetical order follows decreasing values. * indicates data were subjected to ANOVA test instead of Kruskal-Wallis test...42
Table 2.1: Characteristics of Forêt Montmorency sites sampled in August 2012...72 Table 2.2: Analyses of diversity (Fisher's alpha), evenness (Pielou's evenness), and similarity (ANOSIM using
Jaccard index). Richness and evenness values are based on 100 sub-samplings. Values for the community are based on the sub-sampling displaying less dissimilarity among groups (smaller R value). Significant effects are highlighted in green p-value ≤ 0.05...73
Table 2.3: Results of PERMANOVA with 999 permutations of the Jaccard dissimilarities for fungal mOTU
community structure (DF, degrees of freedom; SS, sum of squares; MS, mean sum of square; F, pseudo-F by permutation)...74
Table 2.4: Kruskal-Wallis and Dwass Steele Critchlow Fligner tests of the average relative abundance of
fungal phylum and classes among the stands (A) and tissue types (B). Significant differences (p ≤ 0.05) are highlighted in green, or yellow if the DSCF could not distinguish the effect due to low abundance. Alphabetical order follows decreasing values. * indicates data were subjected to ANOVA and Tukey tests instead of Kruskal-Wallis and DSCF tests...75
Table 3.1: Characteristics of Forêt Montmorency sites sampled in August 2012...106 Table 3.2: Results of PERMANOVA with 999 permutations of the Jaccard dissimilarities for fungal mOTU
community structure (DF, degrees of freedom; SS, sum of squares; MS, mean sum of square; F, pseudo-F by permutation)...107
Table 3.3: Kruskal-Wallis and Dwass Steele Critchlow Fligner tests of the average relative abundance of
taxonomic assignments among stands (A) and needle cohorts (B). Significant differences (p ≤ 0.05) are highlighted in green. Alphabetical order follows decreasing values. * indicates data were subjected to ANOVA and Tukey tests instead of Kruskal-Wallis and DSCF tests...108
Supplementary Table
Table S1.1: Combination of CLAM tests results to attribute categories to mOTUs present in needle
List of abbreviations, acronyms
°C degree Celsius
% percentage
$ US dollar
A. b Abies balsamea
ANOSIM analysis of similarities
ANOVA analysis of variance
Bp basepair
BSA bovine serum albumine
DF degrees of freedom
DSCF Dwass Steele Critchlow Fligner
DNA deoxyribonucleic acid
dNTP desoxyribonucleotide triphosphate
h hour
ha hectare
HMMs hidden Markov models
HTS high throughput sequencing
Hz hertz
ITS internal transcribed spacer
km, m, cm, mm kilometre, metre, centimetre, millimetre km2, mm2 square kilometre, square millimetre
LCA lowest common ancestor
m.a.s.l. metres above sea level
mg, μg milligram, microgram
MID multiplex identifier
Min minute
mM millimolar
mOTU molecular operational taxonomic unit
MS mean sum of square
Myr million year-old
NCBI national center for biotechnology information nMDS non-metric multidimensional scaling
PCR polymerase chain reaction
PERMANOVA permutational multivariate analysis of variance pSSU partial small sub-unit
RNA ribonucleic acid
rRNA ribosomal ribonucleic acid
S Svedberg unit
sd standard deviation
sec second
SLP single-linkage preclustering
SSU small sub-unit
To Herbert Copeland & Robert Whittaker for
booting Fungi out of the Plant Kingdom
The truth is, most of us discover where
we are heading when we arrive
Acknowledgements
First of all, I like to thank my director, Dr Louis Bernier. I realise it might not have been evident to inherit a half-way through Ph.D student at a Christmas party. I am grateful for your help and advices transitioning from lab work to actually writing this dissertation.
I am also thankful to my co-director, Dr Jean A. Bérubé. You made me think of going for a doctorate in the first place and provide me with the opportunity to do so. I appreciate the confidence you show in me to complete this study.
I am immensely grateful to Dr Elizabeth A. Arnold. My visit to your laboratory remains for me the highlight of my Ph.D. I am thankful for your teachings, advices and kindness. You made me realize I may not be completely out of place in a laboratory.
To my folks, there is no word to match your unbounded support which led me to here and now. You have gotten me back on my feet since as long as I can stand, and likely more often in the past years than when I was a toddler. I can’t but hope to prove myself worthy of such a love.
To my sister, Dr Pauline “Geeeorges” Ponchart, the best sibling I could have wished for (I do apologize for that biting accident in the late 1980s by the way). Let’s face it, this all started with you explaining me about nucleosides, nucleotides, nucleic acids and amino acids (which also explain my reservation to ask you to teach me anything nowadays).
I sincerely thank Dr Jana U’Ren. I appreciate the time you took both to discuss about data treatment and teach me ecological analysis without which, the following chapters would be limping. Your mentorship allowed me to step up my game.
In all fairness, I could not not mention Patrick N. Gagné (well actually I could, it has been done before). You allowed me to almost immediately test couple of ideas I had thanks to the scripts you developed for me, bypassing the maddening and long process to learn computer talk (which I reserve for the upcoming months). I am extremely grateful to the Centre for Forest Research and its bursary service which allowed me to present my work in different congresses, but also to go to the University of Arizona for an internship.
Due to the time frame of this project, a myriad of people have contributed either professionally or socially to my well-being. From the Laurentian Forestry Centre, I like to thanks the 2.24 alumni: Agathe Vialle, Franck Stephani, Guillaume Nicolas, Sylvie Carles and Karl Lundén (as well as Julie Godbout if the wifi signal is strong enough). From the same building I also thank Marie-Josée Bergeron, Amélie Potvin, Josyanne Lamarche, Nicole Lecours and Julie Dubé. The move to the Institute of Integrative Biology and Systems was made easy thanks to Martha Nigg, Hélène Vignaud, Éléonore Durand, Marine Vautier but also Sébastien Gérardi, Julien Prunier and Jérôme Laroche. Special thanks to the Jouven-Bleuvre, for either making me run a semi marathon (Clara), or teaching me forestry on site (Jean Marc). I apologize for stealing Watson when you were on holidays.
I also would like to thank Sophie-Anne Landry and Stéphanie Boivin from the “administrative” office of the faculty of forestry for their kindness and patience, and also the program director André Desrochers for allowing me non-unique last session.
The last though goes for old Ph.D students who might have lost their footings along the way. I can’t advice you enough to read “South” from Sir Ernest Shackleton, it will do the rest...
Preface
The following thesis is organized in three scientific papers written in English and edited correspondingly with the recommendations of the Faculté des études supérieures et postdoctorales (FESP) of Laval University. It is enclosed by a general introduction and a conclusion both written in English.
The first paper, SSU to the rescue: conserving the original partial SSU fragment ahead of the ITS1 sub-locus
enhances the detection of putative chimeras and limits the formation of possibly spurious taxa in fungal metabarcoding, is to be submitted to Methods in Ecology and Evolution. The co-authors are Louis Bernier and
Jean A. Bérubé.
The second paper, Diversity, community composition and structure of the endomycobiota of balsam fir trees
(Abies balsamea [L.] Mill.) as a function of tissue type, is to be submitted to Frontiers in Microbiology. The
co-authors are Louis Bernier and Jean A. Bérubé.
The last paper, Last four cohorts of Abies balsamea needles display relatively similar diversities but different
endomycobiotas, is to be submitted to Fungal Ecology. The co-authors are Louis Bernier and Jean A. Bérubé.
I am the first author for each paper. I was responsible for the experimental designs, sampling, laboratory work, bioinformatics processing of genetic sequences, statistical analysis of data, and editing.
Introduction
1. Endophytism: definition and distribution
For a long time, the definition of the term “endophyte” attributed to De Bary (1866) (Arnold 2008) did not exceed its etymology, with “endo-” meaning within, and “-phyte” meaning plant; an endophyte was thus an organism living within a plant. Hence, this definition was mostly restricted to a location. Nowadays endophytes are microorganisms that live all or part of their life cycle within plants without causing any apparent damage or symptom to their host (Petrini 1991; Wilson 1995; Schultz & Boyle 2005). In addition to the location, this definition thus provides the effect of the interaction/association on the plant health status as not eliciting symptoms of disease. These two aspects seem to be the only properties endophytes have in common. Interestingly, the definition of endophytes differs from that of epiphytes which only mentions the position on the surface of plant. Endophytes do not belong to a restricted number of taxonomic ranks, nor do they exhibit similarities in their process of colonization. Furthermore, they display a wide range of functions. From this lack of homogeneity, it seems apparent that rather than describing a type of organisms, the term endophyte actually characterizes the transient or extended part of the life cycle of microorganisms that live within plants when they are not causing any apparent damage or symptom to their host. According to this definition, both latent pathogens and dormant saprotrophs are then considered as endophytes as they are present within the plant at a time of their life cycle when they are not triggering apparent symptoms on their hosts (Osono 2006; Saikkonen 2007; Newton et al., 2010; Boberg et al., 2011). Endophytes are most likely to be involved in neutral, commensalism, and mutualism interactions for instance. While the term applies mostly to both bacteria and fungi, the focus hereby will only be placed on the latter kingdom.
Endophytism is a long established association between Plants and Fungi (>400Myr) and is thought to have contributed to land conquest by plants, alongside with mycorrhizae (another Plant/Fungi association) (Krings et al., 2007; Rodriguez et al., 2009). Among fungi, endophytism is exhibited by an hyperdiverse group of species whose richness was estimated to 0.5 - 1 million species (Sieber 2007; Bills 1996). It represents a non negligible portion of the 2.2 - 3.8 million estimated species composing the fungal kingdom (Hawksworth & Lücking, 2017). Furthermore, endophytism is also widespread among plants as every plant sampled was found to harbour fungal endophytes, and it is generally considered that they are virtually found in every plant (Petrini 1986; Saikkonen et al., 1998; Rodriguez et al., 2009). It thus implies that not only this association is recovered from every major lineage of land plants, from grasses to non vascular plants, fern and allies,
conifers, and angiosperms, but also that it is retrieved from all terrestrial ecosystems (both natural and agro-ecosystems), occurring in different biomes, from the tropics to the tundra (Arnold & Lutzoni, 2007; Rodriguez et al., 2009). Endophytism is not limited to terrestrial ecosystems as it is also observed among aquatic plants (Sandberg et al., 2014). Despite the abundance of plant species colonized and the diversity of fungal endophytes, not all fungi are found within each plant. Mechanisms of recruitment of the community of fungal endophytes (endomycobiota) and even of colonization are not yet fully understood. But far from constituting random associations, fungal endophytes appear to show a specificity to their host species and sometimes even to a particular genotype of such host species (Ahlholm et al., 2002; Balint et al., 2013; Rajala et al., 2013). It also has to be noted that a certain seasonal variation of the composition of the endomycobiota is observed (Osono & Mori 2005; Guo et al,. 2008; Osono 2008) suggesting a dynamic process in the recruitment and survival of this community, possibly subject both to the environment but also to the already settled endophyte species.
2. Fungal endophyte classes
Traditionally, fungal endophytes are separated in two main groups based on phylogeny and life history traits. While the clavicipitaceous endophytes are likely the most studied group, they only represent a small number of phylogenetically related ascomycetous species confined to the clavicipitaceae family in the hypocreales order (Rodriguez et al., 2009). These clavicipitaceous endophytes are also restricted to some cool- and warm-season grasses present in both northern and southern hemispheres (Bischoff & White, 2005; Rodriguez et al., 2009). The particular attention they receive relies on their significant agricultural impact. Following the discovery by Bacon (Bacon et al., 1977; Porras-Alfaro & Bayman, 2011) that clavicipitaceous endophytes of pasture grasses were toxic to cattle, an estimated cost of $600 million a year to the livestock industry was attributed to the associated toxicity syndromes (Hoveland, 1993; Porras-Alfaro & Bayman, 2011). This is to be linked with one functional trait of clavicipitaceous endophytes: conferring enhanced resistance of host plants to herbivory either from insect feeding or mammalian herbivores (Rodriguez et al., 2009) usually resulting from the production of chemicals, notably alkaloids. Similarly these endophytes may confer disease resistance either by production of antifungal compounds, stimulation of plant defences, or simply trophic competition with pathogens (Rodriguez et al., 2009). Other potential functional roles include increase of plant biomass, as well as enhanced tolerance to abiotic stresses such as drought and metal contamination. The latter rely notably on the development of an extensive root system, increasing the area that can be prospected for both soil moisture and nutrients (Rodriguez et al., 2009). Clavicipitaceous endophytes represent a relatively more accessible model to study endophytology as the colonized plants usually harbour one dominant fungal isolate/genotype
(Wille et al., 1999; Rodriguez et al., 2009). The infection is also systemic, typically occurs in the intercellular spaces within the plant shoots, and transmission is primarily vertical (inherited) (Rodriguez et al., 2009). The infested plants also display a lower diversity of tissue, are less expanded in size, and more readily cultivable for experiments than woody plants. Yet, examining native plants under natural conditions is of uttermost importance as the endophytes-conferred benefits appear to be influenced notably by host genotype and environmental conditions, and might be missed in controlled experiments.
Nonclavicipitaceous endophytes represent a highly diverse polyphyletic group of species and the vast majority of fungal endophytes (Rodriguez et al., 2009), and are therefore the focus of this study. They mostly belong to the Dikarya sub-kingdom, and more particularly to the Ascomycota phylum. They are also the most widely distributed among plant lineages and across the globe. As for clavicipitaceous endophytes, they have been shown to confer to their host fitness benefits such as biotic and abiotic stress tolerance, improved nutrient uptake and increased growth and yields (Rodriguez et al., 2009). Rodriguez et al. (2009) separated them provisionally into three functional groups, mostly based on host colonization and transmission. Non-clavicipitaceous endophytes belonging to the first group colonize roots, stems, and leaves, and are able to form extensive infections within the intercellular spaces. Transmission is often vertical (inherited), but horizontal transmission is also observed. They are of most importance as they may be required for the normal development of some plants (Garbary & Macdonald, 1995; Rodriguez et al., 2009). Members of the second group are restricted to the root system and more often referred to as dark septate endophytes due to their display of darkly melanized septa. They may colonize both inter- and intracellular spaces (Rodriguez et al., 2009). They are found worldwide and are prevalent in high-stress environments (Rodriguez et al., 2009). They are especially associated with fine roots of conifers in boreal and temperate forests but not restricted to these plants nor habitats. They overall show a large host range and/or a lack of host specificity (Rodriguez et al., 2009; Jumpponen & Trappe 1998; Mandyam & Jumpponen 2005). Their transmission is considered to be horizontal and possibly originating from the soil fungal community. Finally, the last group of non-clavicipitaceous endophytes is confined to the above-ground plant tissues. Members of this group are hyperdiverse and display an extremely high diversity within individual host tissues, plants and populations (Rodriguez et al, 2009). They are likely to be the group containing most of the fungal endophytes biodiversity. They form highly localized infections of an estimated area of 2 mm2 within inter-cellular spaces as observed in
leaf tissue (Lodge et al., 1996; Arnold et al., 2000; Rodriguez et al., 2009). They are horizontally transmitted. Due to sampling strategies employed in the work presented thereafter, this last category of non-clavicipitaceous endophytes is likely to contain most of the species retrieved.
3. Colonization through space and time
Little is known about the mechanisms involved in the horizontal transmission of the endomycobiota. The environment seems to play a key role, notably as a source of inoculum. Environmental conditions, such as high relative humidity, might also influence favourably the colonization (Arnold & Herre, 2003; Rodriguez et al., 2009). Colonization is considered to be passive and to happen through the natural openings of the plant such as the stomata and the lenticels, but also via lesions and wounds (Johnston et al., 2006; Saikkonen 2007), and remain confined to the intercellular spaces. Microscopy studies do not reveal the establishment of any particular structures (Deckert et al., 2001; Johnston et al., 2006). However, colonization is not random, and differences both in diversity and composition exist between the endophytic- and the epiphytic communities (Santamaria & Bayman, 2005; Osono 2008). This suggests mechanisms of selection or recruitment of the endomycobiota from the plant. This is reinforced by the apparent host specificity of certain endophytes as mentioned earlier, specificity that might extend to a particular host genotype (Ahlholm et al., 2002; Balint et al., 2013; Rajala et al., 2013). Yet, the colonization is far from being homogeneous, notably due to the fact that infections are highly localized (Lodge et al., 1996; Arnold et al., 2000; Rodriguez et al., 2009). Variations in the environmental conditions, even at a micro-scale, also appear to influence the composition of the community recruited. Within the same trees, Unterseher et al. (2007) showed that some species of fungal endophytes prefer the shaded lower forest canopy to the sunny upper canopy. The latter is considered less stable with shorter periods of moisture on the leaf surface, broader fluctuation in temperatures, and possible higher UV radiation intensity. Schematic representation of leaf colonization by fungal endophytes shows a densely packed mosaic of diverse endophyte species (Lodge et al., 1996; Rodriguez et al., 2009). Differences also exist between the different parts of the leaf with distinct communities observed between the petiole and the blade (Hata & Futai 1996; Hata & Sone 2008).
Disparities in fungal endophyte distribution are not only observed across space but also along time. Within the same trees, seasonal variations in both diversity and composition of the endophytic community are usually observed (Osono & Mori 2005; Guo et al., 2008; Osono 2008). It is conceivable that plants are continuously exposed to an airborne inoculum whose composition evolves during the year, resulting in successive waves of colonization allowing additional endophytic species to settle and/or to replace part of the community established previously. As for the mechanisms of recruitment of the endomycobiota in itself, the dynamics and the evolution of its composition along time are far from being understood. Yet there is a delay in the
assemblage of the endomycobiota since endophytic infection is virtually null following the flushing of the foliage (confirming the horizontal transmission), whereas epiphytic colonization is almost immediate (Hata et al., 1998; Osono & Mori 2005; Guo et al., 2008; Osono 2008). As mentioned earlier, environmental factors such as precipitations and temperature (Cordier et al., 2012) may influence the efficiency of fungal endophytes to colonize plant tissues. These factors are also subject to variations along the year with different patterns depending on geographical position. The effect of time on the endomycobiota is difficult to evaluate. It is usually considered that the density of infection tends to increase with tissue age (notably for the foliage). Yet it has been shown that rather than being linked directly with the absolute age of the tissue, the density of infection in plants is more likely to be influenced by the duration of exposure to the environment (Arnold & Herre, 2003). Variation along time of tissue properties such as water or phenolics content (Hatcher 1990, Unterseher et al., 2007), and physiological changes might also alter the plant properties as an ecological niche and affect in turn the endomycobiota. The settled community of fungal endophytes might also modify in a similar way the habitat conditions to develop a less hostile environment (Hata et al., 1998). Again, the paucity of studies on this particular subject makes it difficult to precisely understand the interactions between the plant and its endomycobiota. But it also has to be noted that the fact that endophytes do not trigger symptoms on their host does not imply the absence of defense reactions from the plant, and endophytism is sometimes referred to as a balanced antagonism (Schulz et al., 1999). The switch between endophytic and pathogenic lifestyles may also result in a more aggressive colonization of the host, suggesting that the plant contains in some way the development of fungal endophytes (Eaton et al., 2011).
Part of the difficulty of studying interactions between the endomycobiota and its host lays on the fact that infections are highly localized, overall heterogeneous, and that they involve a community of hundreds of fungal endophyte species whose composition changes over time. This task is made even more difficult as fungal endophytes are not the only kind of organisms associated with plants. Fungal endophytes are indeed part of a larger entity, the plant microbiota which includes all the microorganisms, such as bacteria, fungi, protists and viruses, which are associated both superficially and internally with the plant. Overall, the plant microbiota plays key roles in different aspects of host metabolism and physiology, improving fitness, enhancing nutrient acquisition, but also providing resistance to pathogens and/or stress tolerance (Friesen et al., 2011; Bulgarelli et al., 2013, Hardoim et al., 2015). Its role also extends to a broader scope than its host as it may also influence plant community structure and ecosystem functioning (Porras-Alfaro & Bayman 2011; Rout 2014; Laforest-Lapointe et al., 2017). Increasingly, the approach underlying plant microbiota studies (and microbiota studies in general) is to include all components over all the taxonomic kingdoms involved, in order to decipher the interactions network. Such an approach will unarguably lead to a better understanding of the role of the
different members of the plant microbiota. For instance, one of the most cited examples of endophytic fungus benefiting its host is Curvularia protuberata which was originally thought to confer thermotolerance to its host
Dichanthelium lanuginosum, allowing both of them to grow at high soil temperature in Yellowstone National
Park (Redman et al., 2002). It has since been shown that it is actually an endohyphal virus, found within
Curvularia protuberata, that conferred heat tolerance (Marquez et al., 2007). As the plant microbiota is
composed of a myriad of microorganisms interacting both with the plant and among themselves (not to mention with the environment), deciphering such a complex network of interactions is a daunting task for which not every laboratory is equipped for. Yet, a contribution to that aspect might be to evaluate the composition and distribution of a particular subset of the plant microbiota, i.e. the endomycobiota.
4. Assessing fungal diversity
As mentioned earlier, estimates of the fungal diversity ranges from 1.5 million species (Hawksworth 1991) to 5.1 – 6 million (O’Brien et al., 2005; Blackwell 2011; Taylor et al., 2014), with more recent work refining this estimate to 2.2 – 3.8 million species (Hawksworth & Lücking, 2017). With only ca. 120 000 species described (Hawksworth & Lücking, 2017), the dimension of the fungal kingdom remains widely unknown with > 95% the species being undescribed. Turning to plants, notably the endomycobiota which is thought to be composed of 0.5 to 1 million species (Sieber 2007; Bills 1996), should thus allow a better grasp of that hidden diversity. Early days of endophytology relied on microscopy (De Bary 1866) but most knowledge on the subject comes from culture-dependent studies, notably from the works of G. C. Carroll, F. E. Carroll, O. Petrini, P. J. Fisher, J. K. Stone, and D. Wilson in the late 1970s and 1980s. Identifications were then based on morphotypes with the limitation that not every specimen sporulated in culture, the lack of sexual structures depriving scientists of useful informations to assess the nomenclature. The use of a molecular DNA-based approach to discriminate species quickly arose to complement morphotyping (Gardes & Bruns, 1991) and has somewhat superseded the culture-dependent approach during the last decade, notably due to the development of High Throughput Sequencing (HTS) techniques (Margulies et al., 2005). This concept of using DNA to identify species is far from being specific to fungal endophytes and is known as barcoding (Hebert et al., 2003). It facilitates the identification of microscopic organisms whose features may be difficult to observe, but also of macroscopic organisms at an early lifestage for instance, when not every character may be fully developed to allow species diagnosis. Different loci or groups of loci are targeted depending on the type of organism. Briefly, the concept relies on the fact that different species will contain different sequences of the barcode regions, and that ideally, every member of the same species will display the same sequence (or at least that interspecific variation
always exceeds intraspecific variation). Concerning the fungal kingdom, the official barcode is the nuclear ribosomal internal transcribed spacer (ITS) (Schoch et al., 2012, but in use for two decades beforehand).
The nuclear ribosomal transcribed spacer is a multi-copy (60 to 220 repeats (Cassidy et al., 1984; Russel et al., 1984)), tripartite segment, roughly 550-base pairs long, which is easily amplified by the Polymerase Chain Reaction (Nilsson et al., 2008). Nilsson et al. (2008) found the weighted average of intraspecific ITS variability across the kingdom Fungi to be 2.51% with a standard deviation of 4.57 (based on 4 185 fully identified fungal species). This variability differs among the different phyla ranging from 1.96% (standard deviation of 3.73) for the Ascomycota, to 7.46% (standard deviation of 4.14) for the Glomeromycota. It has to be noted that while this is of tremendous importance and extremely informative, it remains that this work is based on a relatively low number of fungal species (4 185 species) and that it will deserve a revision as data for such evaluation become available. Due to the existence of this intraspecific ITS variability, and in order to allow an effective use of barcoding for species identification, it is necessary to record every version of the ITS for each species. Yet such a level of completion is far from being achieved as of the 120 000 formally recognised species, only 34 878 are represented in Genbank (Hawksworth & Lücking, 2017). If initiatives such as UNITE (Koljalg et al., 2004) intend to develop an ITS reference database for fungal species, availability of ITS data remains at best fragmentary. Inclusion of the ITS barcode sequences in the description of species may prove to be useful in order to improve the level of completion of ITS reference database, but with around 1 800 fungal species newly described per year, reaching such goal may prove to be fastidiously long. Benefits of such an approach may also exceed species identification by barcoding to simplification of the nomenclature, allowing the removal of unnecessary synonymy. While Hawksworth (1991) mentioned a 2.5:1 level of synonymy, we found for fungal species associated with Abies balsamea (L.) Mill., the host on which this study was based, a 10.9:1 synonymy ratio (or 549 fungal species and a total of 5 994 synonyms). A “one species = one name” approach combined with listing the different versions of the barcode should thus prove useful for a better determination of the organism considered.
Barcoding is not limited to species identification (i.e. determining a name). For instance, it is also used to evaluate patterns of distribution even for species that may neither have their ITS sequences referenced nor be part of the minority of species described. The concept of molecular Operational Taxonomic Units (mOTUs), which act as a proxy for species, relies on forming groups of sequences based on a similarity threshold. It bypasses the shortcoming due to the low level of completion of the ITS reference database. While inherent to molecular based approach, it may be applied to both culture- and culture-independent methods. For the former
it may confirm that each morphotype represents a single species, while for the latter it forms the basis of observations. In the case of culture-independent methods, the term metabarcoding is usually preferred. Typically, metabarcoding involves the collection of environmental samples (mostly tree branches in the studies reported in this thesis, but may be as diverse as water sampling from lakes or even dust from a cabin), global DNA extraction, specific amplification of the barcode sequences, and sequencing. Development of the HTS techniques in the late 2000s has contributed to massively popularize metabarcoding studies as they permit sequencing millions of amplicons simultaneously. Before the development of HTS, a cloning step was necessary to segregate the amplicons and Sanger sequencing was performed one sequence at a time, thereby limiting the sequencing depth allowed per sample. While the massive amount of data is certainly a benefit, development of HTS is also accompanied by the production of shorter sequences that do not cover the full length of the fungal barcode. As mentioned earlier, the nuclear ribosomal Internal Transcribed Spacer is a tripartite segment composed of the rapidly evolving ITS1, the highly conserved 5.8S, and the moderately to rapidly evolving ITS2 (Nilsson et al., 2008). Studies based on HTS techniques have thus targeted either the ITS1, or the ITS2 sub-locus, with a preference for ITS1 as it displays on average a variability exceeding that of ITS2 (Nilsson et al., 2008) and may be more represented in nucleotidic databases. As with the full length fragment, intra-specific variability exists, and since mOTUs are formed based on a similarity threshold, it has to be stressed that no single value can perfectly delimit every species. A compromise of either 95 or 97% of similarity is usually employed and broadly accepted for studying global patterns of distribution and organisation of the biodiversity. The metabarcoding approach is even credited with being the major source for discovering novel fungal taxa (Hawksworth & Lücking, 2017).
5. Balsam fir in the context of global change
Balsam fir (Abies balsamea [L.] Mill.) is an important constituent of the boreal forest of eastern North America and the second most common species in Quebec after black spruce (Picea mariana Mill. B.S.P.). Consultation of the fungus-host database (Farr & Rossman, 2016) in the early days of this project showed a higher number of fungal species associated with balsam fir than with black spruce. The species displays sensitivity to climate change, and predictions show that it could disappear from about 20% of its distribution range (established on the 1961 – 1990 period), and remain present in less favourable conditions in about 40% of this area (Périé et al., 2014). This may favour the establishment of deciduous pioneer tree species such as white birch and aspen (Price et al., 2013). Those modifications in the distributions of tree species will likely be accompanied by long-term changes in the fungal community (Price et al., 2013). Such environment, with an expected increase of both abiotic and biotic stresses notably due to the progressive influence of climate change on boreal forests,
may represent an extremely alluring opportunity to study fungal endophytes and the possible evolution in the composition of the community recruited to face these environmental challenges. The increasing pressure of climate change on boreal forests may also lead to a better understanding of the functional roles of some members of the endomycobiota. Recording the biodiversity of the endomycobiota may also be considered in the context of conservation biology, in order to evaluate the dimension of the fungal kingdom before the possible disappearance of some of these species.
6. Scope of the thesis.
The main purpose of this Ph.D project is to develop a better understanding of the structure of forest trees endomycobiota using High Throughput Sequencing techniques and to challenge earlier conclusions based on culture-dependent methods. The work described in the thesis is structured in three chapters focusing on (1) the selection of a sub-fragment of the nuclear ribosomal Internal Transcribed Spacer to perform metabarcoding studies; (2) the effect of tissue type on the diversity and composition of the endomycobiota within branches; (3) the influence of the time of exposure to the environment on the diversity and composition of the endomycobiota of different needle cohorts.
Chapter 1 SSU to the rescue: conserving the
original partial SSU fragment ahead of the ITS1
sub-locus enhances the detection of putative
chimeras and limits the formation of possibly
spurious taxa in fungal metabarcoding
Julien P. Ponchart1,§, Louis Bernier1,2, Jean A. Bérubé3.
1 Centre for Forest Research, Université Laval, Québec, Qc, Canada
2 Institute for System and Integrative Biology (IBIS), Université Laval, Québec, Qc, Canada
3 Laurentian Forest Centre, Canadian Forest Service, Natural Resources Canada, Québec, Qc, Canada § Corresponding author: Julien P. Ponchart, email: julponchart@gmail.com
1.1 Résumé
Dans cette étude, nous avons évalué les avantages de conserver le fragment de pSSU précédant le sous-locus ITS1 chez les champignons. Nous avons montré que sa présence améliore la sensibilité de la détection des chimères (par un facteur 30) et limite la formation de singletons (-38%) et de doubletons (-22,7%), réduisant ainsi la diversité extrapolée (-21,9%). Nous avons développé une alternative au logiciel ITSx pour extraire plus facilement notre fragment d’intérêt (pSSU-ITS1) à partir d’amplicons fongiques. Notre approche, basée sur la détection d’un motif unique (ITS3a), présente une efficacité similaire à celle d'ITSx dans la détection de séquences fongiques non seulement à partir de notre jeu de données mais également pour la base de données de référence d’ITS fongiques (UNITE v7.1). Les analyses écologiques effectuées sur le sous locus ITS1 ou le fragment pSSU-ITS1 révèlent un patron similaire dans la structure de la communauté de l'endomycobiote d'un individu de sapin baumier.
1.2 Abstract
High throughput sequencing (HTS) techniques have brought new insights into the scale of diversity and distribution of the plant microbiota, including endophytic fungi. However, such data sets often contain a large number of singletons and doubletons for which it is hard to differentiate sequencing artefacts from biological reality. In the absence of a complete, high quality reference database, no firm solution exists to determine whether these singletons and doubletons represent members of a rare biosphere or spurious taxa. Here, we hypothesized that the selection of a particular sub-region of the fungal barcode might reduce their formation. The aim of this study was to evaluate if (1) conserving the original 5’ extremity of the fungal amplicons, usually the partial fragment of the ribosomal small sub-unit (pSSU) immediately adjacent to the ITS1F primer ahead of the ITS1 sub-locus, impacts the detection of chimeras; (2) as the pSSU displays a lower variability, its inclusion in addition to the ITS1 sub-locus might also buffer the variation due to putative sequencing errors, and reduce the formation of those singletons and doubletons; (3) performing ecological analyses based on pSSU-ITS1 leads to similar conclusions on the community structure as analyses based on ITS1. For this study we analysed the fungal endophytic community (endomycobiota) of a single individual of Abies balsamea (L.) Mill. based on 108 samples distributed among both the aerial and root systems. We first show that conserving the pSSU ahead of the ITS1 sub-locus enhances the sensitivity of chimera detection (30 fold rate increase) while limiting the formation of singletons (-38%) and doubletons (-22.7%) and reducing thus the overall observed and extrapolated diversity (-20.8, and -21.9%, respectively). We then develop an alternative approach to the commonly used ITSx software to readily extract our fragment of interest (pSSU-ITS1) from fungal amplicons, based on the detection of a single pattern (ITS3a). We show that our ITS3a-based approach presents a similar efficiency to ITSx in detecting fungal sequences not only from our dataset but also for the fungal ITS reference database (UNITE v7.1). Finally, we demonstrate that ecological analyses performed on either ITS1 or pSSU-ITS1 fragment reveal a similar pattern in the community structure of the endomycobiota of a single balsam fir tree.
1.3 Introduction
With the development of High Throughput Sequencing (HTS) techniques, DNA metabarcoding studies have improved our understanding of the extent and distribution of biological diversity. These methods have been applied successfully in domains ranging from the human (Hamady & Knight, 2009) and plant microbiotas (Jumpponen & Jones, 2009), to marine ecosystems (Leray & Knowlton, 2015), soil ecosystems (Buée et al., 2009; Yoccoz et al., 2012), air (Fröhlich-Nowoisky et al., 2009; Yamamoto et al., 2012), and indoor environments (Amend et al., 2010), with recent extensions to conservation purposes (Ji et al., 2013; Thomsen & Willerslev, 2015). However, such approaches are limited to determining associations rather than interactions as they can only detect the presence of organisms and cannot differentiate living from dead cells, although complementation with RNA metabarcoding might discriminate the “active” biodiversity (Stecher et al., 2016).
Metabarcoding approaches are not without drawbacks and methodological artefacts also exist. They originate from three main sources of errors: PCR chimeras, PCR single base substitutions, and sequencing errors (Quince et al., 2011). If PCR linked errors are independent of the HTS (no effect on the incidence frequency), their impact (i.e. the number of sequences concerned) is exacerbated by the large amount of data produced. Sequencing errors, on the other hand, are inherent to the HTS employed. While most of these issues have been addressed (Quince et al., 2009; Huse et al., 2010; Quince et al., 2011; Schloss et al., 2011), and even with state of the art analysis, estimates of the biodiversity based on metabarcoding approaches are globally considered to be inflated. This is notably due to remaining erroneous sequences putatively forming undetected chimeras (Deiner et al., 2016) and a large proportion of singletons and doubletons (Tedersoo et al., 2010; Unterseher et al., 2011; Lindahl et al., 2013; U’Ren et al., 2014). Whereas some of these less represented molecular Operational Taxonomic Units (mOTUs) compose the “rare biosphere”, others were shown to be spurious variants of more frequent mOTUs (U’Ren et al., 2014).
Assigning singletons and doubletons to one or the other categories mentioned above is impossible in the absence of a complete, high quality reference database. The lack of such database is notably worth mentioning for the fungal barcode, the nuclear ribosomal internal transcribed spacer (ITS) (Schoch et al., 2012). With ca. 120 000 species described from the 2.2 – 3.8 million species (Hawksworth & Lücking, 2017), > 95% of the fungal diversity remains unknown, and only about 30% of the described species are referenced molecularly by their barcode region in the GenBank database (Hawksworth & Lücking, 2017), and ca. 14% in the fungal reference database Unite (Koljalg et al., 2005). If remaining erroneous sequences may not be
unquestionably identified as such, their impact might be limited by exploiting their proprieties: sequences with errors are likely to be rare, and they should be similar to a true abundant sequence (Quince et al., 2011). For the chimeras, acknowledgement of the mechanisms involved in their formation might improve their detection. In both cases, the attentive consideration of the ITS sub-region to be used for fungal metabarcoding studies might partially lift the uncertainty of the spurious nature of some rare mOTUs.
Selection of a ITS sub-region has to be considered as HTS techniques used for metabarcoding studies can not reach the ca. 450-800 bp of the fungal barcode. It is notably the case for 454 pyrosequencing whose particularity is to generate intermediate length reads (Margulies et al., 2005), i.e. the sequencing is randomly interrupted before reaching the 3’ extremity of the amplicons. As the chimera detection exploits the sequence abundances (Quince et al., 2009), the ITS1 sub-locus (which tends to be favoured over the ITS2 as it generally displays a higher variability (Nilsson et al., 2008)) is extracted in order to increase the accuracy of these abundances. This lead to the removal of the original 5’ extremity of the amplicons, usually the partial fragment of the ribosomal small sub-unit (pSSU) immediately adjacent to the widely used ITS1F primer (Gardes & Bruns, 1993). The formation of chimeras happens when a partially amplified sequence fragment during one cycle of the PCR serves as primer for a different sequence in the following cycle (Quince et al., 2011). Chimera detection is performed on sequences which do not display the original extremities of the amplicons. The absence of these short conserved extremities during chimera detection might thus impair the process.
The extraction of the ITS1 sub-locus is also performed as the less variant flanking regions may distort the sequence clustering and/or may skew the similarity searches for taxonomic affiliation (Nilsson et al., 2010) depending on the length of the residual portions left. But despite being more conserved than the ITS1, the SSU remains variable enough to prevent the use of pattern matching to remove it (Nilsson et al., 2010). Considering a pSSU-ITS1 fragment as a potential sub-barcode allows also the selection of a segment with properties similar to those of the full length ITS. The ITS contains in its middle the highly conserved 5.8S which constitutes about one third of the global length of the barcode region (Yang et al., 2018). The pSSU immediately following the ITS1F is ca. 50bp and represents about one quarter of the pSSU-ITS1 length. It should thus decrease the overall variability and allow to use the same similarity threshold as with the full-length ITS barcode. As the accuracy of nucleotide assignment decreases with the progression of the elongation (Margulies et al., 2005), keeping the original 5’ extremity of the sequences might also allow to buffer the sequencing errors, more likely to occur towards the 3’ extremity.
The aim of this study was to examine the potential advantages of using a pSSU-ITS1 fragment over the ITS1 sub-locus as a sub-region of the ITS for metabarcoding studies employing HTS techniques. This approach was tested on the fungal endophytic community (endomycobiota) of a single individual of Abies balsamea (L.) Mill. from which 108 samples distributed among both the aerial and root systems were analyzed. We first tested the effect of conserving the pSSU as original 5’ extremities of the fungal amplicons on the detection of chimeras, hypothesizing that its removal might impede the process. Secondly, we determined the effect of conserving the less variable pSSU in front of the ITS1 sub-locus on the clustering into mOTUs, notably on the proportion of singletons and doubletons formed. Thirdly, we developed an alternative to the ITSx software (Bengtsson-Palme et al., 2013) to readily extract the pSSU-ITS1 fragment, and evaluated its efficiency compared to ITSx to detect fungal sequences from the ITS reference database UNITE. Last, we performed a range of ecological analyses including diversity, community composition and correlation-based network analysis to infer if metabarcoding studies based on pSSU-ITS1 resulted in observations different from those obtained by standard ITS1 sub-locus analysis.
1.4 Materials and Methods
1.4.1 Sampling and sample preparation
Sampling was performed in September 2013 at the Montmorency forest, ca. 70km north of Quebec-City. Abies
balsamea is the dominant tree species in the area and covered more than 75% of the 4.7 ha study plot. The
tree selected had no visible damage or symptoms of disease, was situated at 762 m.a.s.l. (47°19.489’ N - 71°05.627’ W), about 11 meters tall, and its age was evaluated to 25-30 years. Branches were collected at six different heights (2 m, 3 m, 4 m, 5.5 m, 6.5 m, and 7.5 m) from two opposite sectors. Two tree-ring cores (0.5 cm in diameter) were also collected from the trunk at five different heights (0.2 m, 1.2 m, 2.2 m, 3 m, 4 m) orthogonally of each other. Roots were sampled from 30 cm under the soil surface and priority was given to the thinner portion of the root system including rootlets (i.e., only roots ≤ 5cm in diameter were kept). Due to the complexity of interconnected root networks, only two fragments (each one about 1.2 m in length) could be assigned to the designated tree.
Each branch was sub-sampled as follows: 40 symptomless needles, 7 buds, 4 fragments of bark and wood (deprived of needles; 5 cm each). The last four annual growth increments of the main axis of the branch were equally sampled (10 needles for each year, and one 5 cm wood/bark fragment) in order to retrieve maximum biodiversity in sampled plant parts (exposed to up to 4 years of colonization). Following surface sterilisation (see Stefani & Bérubé 2006), needles were cut into 1mm sections while buds, bark, and wood were ground into a fine powder in a sterile mortar with a pestle and liquid nitrogen. Wood from tree ring cores was not surface sterilized (as no epiphytes were expected), but bark extremities were removed before grinding. Root fragments were rinsed in two distilled water baths before sub-sampling. Because the distribution of rootlets was too scattered to define distinct sample units, they were pooled per fragment and ground into fine powder (using liquid nitrogen) following superficial sterilization. Wood and bark from the root were collected as five 5cm long pieces of both 1cm and 0.5cm in diameter per fragment. After superficial sterilization, pieces were separated into bark and wood, and then ground. In total 108 sample units from the balsam fir tree were obtained.
1.4.2 DNA extraction and library construction
Assays were carried out to determine the optimal mass for each of the tree tissue types for DNA extraction. It was initially done using 60mg and the quantity of material was adjusted according to results (data not shown). Final samples consisted of 100mg of needles and wood, 30mg for buds and rootlets, and 60mg for bark. DNA was extracted using the DNeasy® Plant kit (Qiagen GmbH, Hildren, Germany). A sterilised 3mm tungsten carbide bead (Qiagen) was added to each sample, which was then subjected to a two step grinding in a Mixer Mill Retsch MM300 (Qiagen) for 2 min at 30 Hz. Then, 400 µL of extraction buffer AP1 (500 µL for the wood samples due to absorbance properties of the tissue), 2 µL of RNase A and a tip of Dx antifoaming reagent (Qiagen) were added. Samples were subjected to a third grinding of 2 min at 15 Hz in the Mixer Mill. DNA was extracted following the manufacturer’s instructions except that extracted DNA was eluted with 75 µL of buffer in two steps (50µL then 25µL).
The ITS region was amplified using the specific fungal primer ITS1F (Gardes & Bruns, 1993) and the universal primer ITS4 (White et al., 1990) adapted for the 454 Roche pyrosequencing Lib-L technology. ITS1F featured the adaptor A and a 10bp Roche MID barcode and ITS4 carried the adaptor B. Each sample was amplified in three independent reactions (using the same MID). The amplification reaction contained 25 µg of Bovine Serum Albumine (BSA, Sigma-Aldrich, St Louis, MO, USA), 1.25 X PCR buffer (Invitrogen, Carlsbad, CA,