O
pen
A
rchive
T
OULOUSE
A
rchive
O
uverte (
OATAO
)
OATAO is an open access repository that collects the work of Toulouse researchers and
makes it freely available over the web where possible.
This is an author-deposited version published in:
http://oatao.univ-toulouse.fr/
Eprints ID : 15899
To link to this article : DOI: 10.1021/acs.energyfuels.5b01325
URL :
http://dx.doi.org/10.1021/acs.energyfuels.5b01325
To cite this version :
Baud, Germain and Salvador, Sylvain and Debenest, Gérald and
Thovert, Jean-François New Granular Model Medium To
Investigate Smoldering Fronts Propagation—Experiments. (2015)
Energy & Fuels, vol. 29 (n° 10). pp. 6780-6792. ISSN 0887-0624
Any correspondence concerning this service should be sent to the repository
administrator:
[email protected]
New Granular Model Medium To Investigate Smoldering Fronts
PropagationExperiments
Germain Baud,
*
,†Sylvain Salvador,
†Gerald Debenest,
‡and Jean-François Thovert
§ †Université de Toulouse, Mines Albi, CNRS UMR 5302, Centre RAPSODEE, Campus Jarlard, F-81013 Albi, Cedex 09, France ‡
Université de Toulouse, CNRS, IMFT, Allée Camille Soula, F-31400 Toulouse, France §
Institut Pprime, CNRS, SP2MI, BP 30179, 86962 Futuroscope Cedex, France
ABSTRACT: Smoldering is involved in a variety of natural situations such as forest fires and also in man-controlled processes such as oil recovery and gas production from oil shale. A general feature of these situations is that a heat wave is propagating through the solid porous medium, powered by the flameless combustion of a solid. In numerous applications, this heat supply results from the partial oxidation of the carbon left after the devolatilization of the medium as the hot wave is approaching. The process of carbon oxidation in the complex geometry of a porous medium with forced air flow is not yet fully understood. In particular, the amounts of CO and CO2produced, that strongly impact the velocity and the temperature of the front, remain unpredictable to date. In this work, a new model porous medium has been produced by adding pyrolytic carbon into inert porous particles, and it has been characterized in detail, aiming at experiments in situations as simple as possible: the oxidation of carbon deposited at the surface of an inert solid matrix. Two of the main parameters that influence the frontthe carbon content and the fed air velocitywere varied over wide ranges. During experiments, carbon was always totally oxidized whereas oxygen was not totally consumed at low carbon content and high air velocities. Depending on the situations, the fraction of carbon oxidized to CO (and not to CO2) varied between 23 and 37%. It was clearly established that the combustion of a particle is limited by internal mass transfer. The thickness of the combustion front is clearly observable, and it is shown to vary drastically depending on the operating parameters. These results are intended to provide a benchmark for the validation of a numerical model in a future work.
1. INTRODUCTION
Smoldering combustion can be encountered in many applications, including fire safety,1 environmental science,2 and energy.3 In most cases, complex phenomena featuring coupled heat transfer, phase shifting, and chemical reactions of hundreds of species are involved at different scales. For these reasons, smoldering in a carbonaceous medium is not well understood and hardly modeled.
1.1. Smoldering in a carbonaceous medium.According to Ohlemiller,4 smoldering can be described as a slow, low-temperature, flameless form of combustion, sustained by the heat released when oxygen directly attacks the surface of a condensed-phase fuel on immobile solid particles. Depending on the directions of reaction front propagation and of oxidizing flow, two main smoldering configurations are described: forward and opposed combustion. Forward combustion where the reaction front propagates in the same direction as the air flowis considered here.
A thermal front and a chemical front both propagate in the medium, in the same direction but at different velocities; they are separated by a so-called plateau, as illustrated in Figure 1. The thermal front is defined as the layer where the temperature of the air flow changes due to intense gas/particle heat transfer. The chemical front is the layer where the carbon within the particles is burnt by the oxygen contained in the air. Both air flow and particles are at high temperature in the plateau zone. Depending on which front is propagating faster, different smoldering modes can be described as inFigure 1. The reaction leading mode refers to the situation where the chemical front is
faster than the thermal front. The reverse situation is called the reaction trailing mode. This work focuses on the reaction leading configuration, occurring with gases such as air with high oxygen content and media with low carbon content. In order to describe the propagation modes, the ratio Δ expresses the ratio
Figure 1.Forward combustion: reaction leading and reaction trailing modes.
between the thermal front velocity and the chemical front velocity; it can be expressed as follows:5
ρ ρ Δ = Cp v Cp v g g d al al frc (1)
All the quantities in eq 1are known operating parameters, except for the front velocity vfrc, which can be experimentally measured or predicted usingeq 5if the overall stoichiometry is known. Reaction leading mode is observed when Δ is smaller than 1, and reaction trailing mode is observed when Δ is larger than 1. The front temperature theoretically tends toward infinity as Δ tends toward unity. It decreases as the value of Δ departs from 1.
1.2. The fraction of carbon oxidized to CO. The smoldering of solid carbon with oxygen is underlain by complex chemical and thermal mechanics featuring both heterogeneous and homogeneous reactions taking place within and outside the particles. After combustion, part of the carbon will end up as CO and part as CO2. A global description of the oxidation can be given as
+ − → + −
C (1 frCO/2)O2 frCOCO (1 frCO CO) 2 (2)
The parameter frCO is affected by various parameters such as air flow rate, temperature, carbon content, and bed geometry that will be studied and discussed in this paper. This parameter strongly affects the smoldering process because (i) it impacts the chemical front velocity: it varies by a ratio of 2 when frCO changes from 0 to 1 and (ii) the released energy by carbon combustion changes from ΔH1= 110.5 kJ mol−1
for frCO = 1 to ΔH2 = 393.5 kJ mol−1
when frCO = 0. These two points result in a drastic change in the front temperature.
The parameter frCO is difficult to assess a priori.
Experimental results obtained with single particles are the most common in the literature. The ratio between the produced CO and CO2 at carbon combustion has been measured in various settings and ranges of temperature and oxygen concentration. In many cases, single isolated particles of various kinds of model carbons were considered. Some way of preventing the oxidation of CO into CO2 was sometimes applied in order to characterize the primary carbon oxidation alone.6,7In other cases, secondary oxidation was not inhibited but the products were sampled very close to the particle, or the global results were analyzed by a numerical model accounting for transport limitations.8 Although the results are very scattered, there is general agreement on the fact that CO production increases with temperature and slightly decreases with oxygen concentrations. These results, obtained under intrinsic conditions, will serve for comparison with the results from the present work even if the actual conditions and transport limitations around a particle are different. During a smoldering process in a packed bed, these conditions depend on geometrical factors such as the particle size and the gas velocity, but also on the oxygen content in the gas and on the local temperature nearby, which are not known beforehand. The rate and stoichiometry of the primary (heterogeneous) oxidation of the carbon on the solid surface, as well as the rate of the possible secondary (homogeneous) oxidation of CO into CO2 in the gas phase, are expected to depend on these conditions. Thus, the amounts of CO and CO2produced both depend on and influence the local parameters. Hence, a description of the smoldering under given operating conditions
such as flow rate, carbon content, and composition of the incoming gases is very difficult.
Explicit simulations on the microscale, based on a more detailed chemical model and accounting for the local coupled reaction and transport mechanisms, are a possible approach to gain this knowledge. Even in an idealized system with a nontrivial but still simple chemical model, calculations exhibit a large variety of regimes in forward smoldering in beds of ground oil shales.5,9−11
The fractions of CO and CO2 in the flue gas and the fraction of escaping O2 can vary greatly. The gasification of C by CO2can be negligible or play a prominent role, and the homogeneous CO combustion, when it occurs, can take place throughout the pore space in the front region or can be localized in a thin, flame-like layer close to the solid surface. Clean-cut (and reversible) transitions between these regimes occur according to the operating parameters. In spite of simplifying approximations which prevent exact quantitative reliability, the various regimes correspond to well identified hierarchies of competing time scales and should at least provide a catalogue of possible qualitative regimes. They also demonstrate the occurrence in some regimes of strong local disequilibrium, which causes difficulties in the formulation of an upscaled description.12 The Porous Conditional Moment Closure (PCMC) method13 is a promising way to account for these effects. Its application indeed predicts a very large decrease of frCO when the ratio of the characteristic times for local diffusion and reaction increases, which is overlooked by the usual homogenized models.
The other avenue to relate the chemical behavior to the local thermochemical conditions is, of course, experimental inves-tigations in real or model settings, with detailed characterization of all the parameters at the front location. The first difficulty of this approach is metrological. Access can be problematic, intrusive probes can disturb the process, and the exact location and integrating domain of the measurements is difficult to evaluate. The second problem is that the conditions at the front cannot be controlled at will, which prevents a systematic investigation.
Carbon oxidation in a combustion cell with forced air flow was studied in the reaction leading mode by Sennoune.14The reactive porous medium was a crushed and pyrolyzed oil shale called semicoke. The ratio frCO ranged between 0.19 and 0.35, with a tendency to increase with the front temperature, induced by an increase of the fixed carbon content. A numerical model for these experiments was proposed by Klimenko.13 In the same kind of medium, feeding with air enriched with CO2also increased frCO in some (but not all) cases.14Experiments were also carried out in the reaction trailing mode. Again, frCO increases from 0.29 to 0.43 with the front temperature, induced here by an increase of oxygen concentration in the inlet air. However, in all of these cases, the energy balance was strongly affected by decarbonation of the solid matrix, and the associated massive emission of CO2 made the determination of frCO more difficult and possibly shifted chemical equilibria.
In this paper, a new model medium was developed in order to investigate smoldering in a porous carbonaceous medium while keeping the problem as simple as possible. Compared to much more complicated media such as oil shale, biomass, or dust, the smoldering in this particular medium involves a limited number of phenomena, including a single chemical reaction: carbon oxidation. The main expected advantages are (i) the direct determination of the fraction of carbon oxidized to CO from flue gas analysis and (ii) the direct post-mortem
observation of the front structure in a variety of smoldering situations with an enhanced precision. The carbon content of the medium and the air flow rate fed to the front were the two investigated control parameters. Information is also gained on the front velocity, its temperature, the fraction of carbon that is actually oxidized, and the fraction of oxygen effectively consumed by the front. The results in the various experimental situations could also provide a reference for the validation of microscale simulations5,9−11
and of a Darcy scale description of smoldering.
2. MATERIALS AND METHODS
2.1. The new carbonaceous model medium. The initial specifications for an ideal medium were the following. The medium should:
• Feature only the reaction of carbon oxidation when under air; • Enable a good control of the initial carbon content;
• Consist of a carbon added in a geometrically stable matrix that does not undergo any shrinkage or any mass loss even at high temperature in order to avoid the creation of air conduits perturbing the flow within the bed;
• Be easily prepared in quantities of several kilograms; • Allow visualization of the front structure through the
post-mortem observation of local carbon content based upon the medium color.
The adopted concept is to add carbon into inert porous particles called the matrix. The only material we found able to tackle with the previous specifications was alumina particles supplied by Axens Company that were obtained by sintering. The black color carbon is fixed in the white color alumina particles through impregnation by a solution of sugar. The particles are then dried and pyrolyzed to produce the final carbonaceous model medium. After using the medium in a combustion experiment, clean alumina particles are recovered by oxidizing the remaining carbon, if any, in the same furnace as the one used for pyrolysis.
2.2. Characteristics of the alumina particles. 2.2.1. Structural properties.The alumina particles diameter ranges from 1.25 to 3.15 mm. The particle diameter distribution is described inTable 1.
The density of the solid within the particles has been measured using a helium pycnometer. It is equal to 3805 kg·m−3, which is
consistent with the density of raw alumina. The density of the particlestaking into account intraparticle porosityhas been calculated by weighing and measuring the diameter of 60 particles drawn at random from the medium. It is equal to 1475 kg·m−3, which
represents a porosity of 61% within the particles. By weighing a metered volume of the particle bed, the density of the packed bed has been found equal to 808 kg·m−3, which represents an extra-particle
porosity of 45%.
From BET analysis, a particle specific surface of 31.5 m2.g−1and an
inner mean pore diameter of 41 nm have been determined. 2.2.2. Thermal properties.The thermal conductivity of a bed of particles has been measured by use of a Hot Disk TPS 2500 analyzer at 20 °C under different pressure constraints. A constant thermal conductivity of 0.20 W·m−1·K−1 has been obtained for a pressure
ranging from 0 to 5000 Pa, corresponding to the static pressure of a 60 cm high packed bed.
In the application of predictions such as ineqs 1 or 6, the heat capacity of the alumina particles should be integrated from room temperature to the actual front temperature for the particular case under consideration. This can be done analytically from the polynomial fits provided in the NIST databases.15 However, since
Tfront is to be determined, this turns the calculation into a tricky
implicit problem, whereas the result is actually weakly sensitive to the exact value of Tfront. In addition, alumina can undergo phase changes
which also affect its heat capacity in some respect. For these reasons, a constant value equal to 1145 J·kg−1
·K−1
was used for convenience. This corresponds to the integral from room temperature up to a typical front temperature ( ≈ 1200 K) of the heat capacity of α-alumina, and represents within less than 5% the exact results for all possible cases, for the α-, γ-, δ-, and κ-phases of alumina and over the practical range 1000−1350 K of actually observed front temperatures. The alumina material has a quite high heat capacity and may also play a role on the combustion process as a catalyst or as a flame retardant. Nevertheless, there is no reference material that could be used for comparison purposes, with similar pore size and porosity. It is therefore difficult to quantify such effects.
It was checked that no significant mass loss occurred at high temperature heating. The mass loss after the first heating of particles at 1000 °C was smaller than 1%.
2.3. Preparation of the model medium.The procedure used in order to fill the alumina particles with carbon is inspired by the works of Joo16 and Luo.17 First, a solution of sucrose is prepared in demineralized water. Then, a batch of 3.3 kg of particles is soaked in 4 l of solution and both are submitted to a partial vacuum over a night. The vacuum level is experimentally defined as the pressure allowing the solution to start boiling (around 50 Pa at 20 °C). In this process, the solution is expected to fill the particles body when the vacuum is broken. Later, the particles are dried overnight at 105 °C. Finally the particles are pyrolyzed in a furnace whose temperature increases at a rate of 10 °C·min−1up to 700 °C and is maintained at this level for 1
h. The particles are pyrolyzed as a packed bed, under a 25 NL·min−1
stream of preheated N2crossing the bed.
2.4. The combustion cell. 2.4.1. Description of the combustion cell.The combustion cell used in this work is an improvement over the cell used in the work of Sennoune.18The main evolution is an increase
of its length, allowing an increase of the propagation length of the front for a better observation of its stability. The combustion cell presented inFigure 2is composed of a vertical stainless steel thermally insulated cylinder containing the bed of carbon loaded particles. Gas inlet is positioned at the top of the column and gas outlet is at the bottom. The cell is 60 cm long for an internal diameter of 9.1 cm. Insulation consists of a 5 cm thick layer of high temperature packed fibers with a thermal conductivity of 0.21 W·m−1·K−1at 1000 °C. At
the top of the column is a quartz window and a 4 point air intake
Table 1. Alumina Particle Diameter Distribution
Particle diameter (mm) 1.25−1.6 1.6−2 2−2.5 2.5−3.15 Distribution (wt %) 7.8 51.5 38.3 2.4
underneath it. At the bottom of the column is a steel grid supporting the bed. A few centimeters above the column is a cone heater used to irradiate uniformly the surface of the carbonaceous medium through the quartz window for ignition.
2.4.2. Instrumentation of the combustion cell.The temperature of the medium is measured at the cell axis by 15 T type thermocouples placed every 4.5 cm. In addition, two horizontal “crowns”, made of 6 thermocouples each, allow measuring the temperature at 1 cm away from the cell wall, 19 and 41.5 cm below the surface of the bed, in order to bring information about the front flatness and horizontality. The bed pressure drop is measured. The bed mass loss is followed by a precision balance featuring 0.1 g sensitivity. Two small diameter gas sampling tubes allow sampling the gases at depths of 19 and 41.5 cm on the axis of the column. The shape and suction strength of the gas sampling devices are designed in order to disturb the combustion hydraulics as less as possible. Gases are sampled during 90 s and stored in special bags, 6 times during each experimental run: 3 times as the front is above the upper sampling and then 3 times as it is above the bottom sampling. The species N2, O2, CO, CO2, H2, and CH4 are
quantified afterward using a gas chromatograph. No difference was observed in gas compositions when sampling as the front is far from the sampling and when the front is close to sampling. We concluded that there is no significant radial diffusion of the gases close to the cell walls - that may have a composition different of that along the axis because of different combustion temperatures−toward the cell axis.
2.4.3. Ignition procedure and front propagation.The first 2 cm of the column are always filled with alumina particles containing a high percentage of carbon: 4.5%. Ignition begins when the heater cone shutter is opened, irradiating the surface of the bed with a flux of 50 kW·m−2under a 12.4 Nl·min−1air flow. These conditions are kept
constant for 300 s before the heater cone is masked and the air flow set to the studied level. This procedure ensures a clean and repeatable ignition.
In the following, we introduce the calculated values used to process the experimental results. As the smoldering front propagates, the recorded mass loss can bring information about the amount of oxidized carbon. Indeed, a mass balance gives
ρ
−dm =
dt Sv x fr
c
frc bed c Coxi (3)
Thus, the fraction of oxidized carbon can be expressed as
ρ = − fr dm dt v X 1 Coxi c frc bed c (4)
frCoxibeing equal to 1 when all the carbon is oxidized at the passage of
the front. Note that this expression assumes that no other process than carbon oxidation takes place. Otherwise, this apparent frCoxican differ
from the actual value, as discussed inSection 3.2.
The experimental velocity of the front is calculated from the time separating the front passage (i.e., maximum temperature) at successive thermocouples along the cell axis. From the stoichiometry of carbon consumption by the fed oxygen,19the front velocity can be expressed as a function of the experimental parameters as
ρ ρ = −
(
)
v v fr fr M y M x 1 Ooxi Coxi frCO frc d g g O C c bed 2 2 (5) This velocity will be called theoretical front velocity in the paper, and will serve for stoichiometry checking purposes.The theoretical front temperature in the absence of radial heat loss can be deduced from a thermal balance. It takes into accounts the fact that not all C may be oxidized and that it can yield mono- and dioxide in variable proportions. = ̇ Δ ̇ − ̇ + T m H m Cp m Cp T front fc al al g g amb c (6) with: ν ρ ̇ = mC frc bed c Coxix fr (7) ρ ̇ = − mg (vd vfrc)g (8) ρ ̇ = mal vfrc al (9) ΔH = Δ + − Δ M fr H fr H 1 [ (1 ) ] fc C CO 1 CO 2 (10) Since in practice vD≫vfrcand ρbed≈ρal,eq 6can be written as
= − Δ + = Δ T T T T x fr Cp 1 , with front Ad amb Ad c Coxi H al fc (11) TAdrepresents the expected temperature rise if the heat released by the
reaction were stored in the burnt solid only. It depends directly on the fraction frCoxiof carbon oxidized, and on frCO through the reaction
heat release ΔHfc. Furthermore, in view of the eq 5 of the front
velocity which results from the stoichiometry, Δ depends on the three parameters frCoxi, frOoxi, and frCO. None of them is known a priori,
although typical values generally prevail, from which preliminary estimates of vfrc, Δ, and Tfrontcan be deduced: in the experiments, the
carbon is always totally oxidized in the smoldering front (frCoxi= 1),
frCO is of the order of 0.3, and most of the oxygen is generally consumed (frOoxi ≈ 1). However, significantly different values are
sometimes observed.
The theoretical predictions mentioned in the following are always based on the measured frCO and frCoxiand on the prediction of the
front velocityeq 5. Therefore, deviations of the observed front velocity and temperature from these predictions can only originate in the hypotheses of one-dimensionality and absence of transverse heat losses which underlie the global balance arguments.
An oxygen balance was established after each experiment to assess the quality of the measurement of gas species in the flux gas:
=
−
O Q Q
Q 100
balance Oin Oout
Oin (12)
with
= ·
QOin Qgin2YO in2 (13)
= + +
QOout Qgout(2YO out2 YCOout 2YCO out2 ) (14)
where Qg outis determined from a N2balance:
= ·
Q Ygin N in2 QgoutYN out2 (15)
and so: = − − − − − − − Q Q Y Y Y Y Y Y Y 1 1 gout gin O in
O out COout CO out H Oout H out CH out 2
2 2 2 2 4
(16) The flue gas is assumed to be saturated in H2O, and thus YH2Ooutis
taken equal to 0.024. YH2outand YCH4outare measured experimentally
and vary around 0.05 and 0.01 respectively.
The fraction of C oxidized to CO can be calculated directly according to = + frCO Y Y Y Y / 1 ( / ) COout CO out COout CO out 2 2 (17)
2.4.4. Direct observation of the front structure.It is possible to obtain cut images of the front. After ignition and propagation of the front to the stable regime, air feeding is turned to nitrogen. The combustion reaction stops within a few seconds. The medium is then cooled for hours under nitrogen. The upper part of the bed is removed by careful suction from the top of the cell, until approaching the combustion zone. Resin is poured on the surface with a guide to try and control the very slow flow. After hardening a block can be
extracted, containing the transition zone from unburnt to burnt particles. This block is then cut vertically several times, enabling the global observation of the front, and even the inside of several cut particles.
3. RESULTS AND DISCUSSION
3.1. Characterization of the model medium.A detailed characterization of the obtained model porous medium is given below to support the parametric studies presented in this paper. These results are also expected to enable accurate numerical modeling of smoldering in further works.
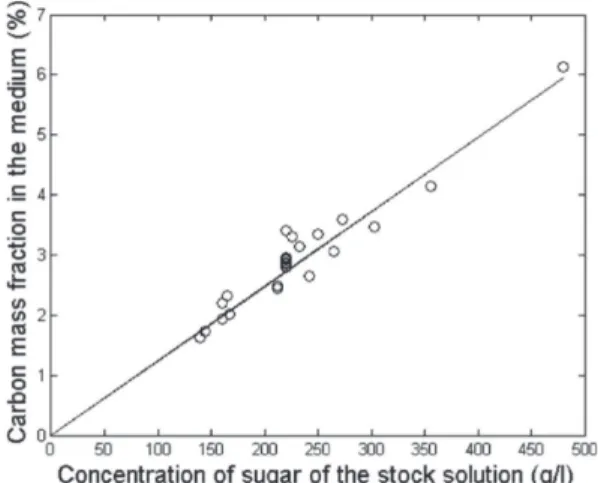
3.1.1. Carbon content and dispersion within the medium. From several experiments, a relationship between the concentration of sugar in the solution and the mass fraction of carbon within the medium was established as reported in Figure 3. It can be used to reach approximately a target carbon
content by setting the solution concentration. However, the carbon contents discussed in this paper are systematically obtained using a proximate analysis.
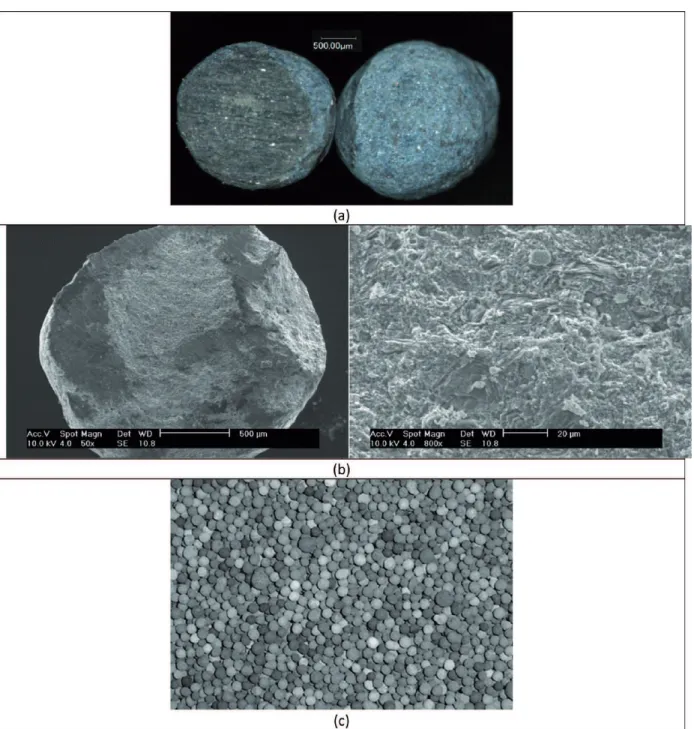
Images of the outer surface and cross section of a carbon loaded alumina particle obtained using an optical microscope are shown inFigure 4a. The observation of these photographs reveals that, at the scale of a particle, the repartition of the carbon is homogeneous. Indeed, the color within the particle is uniform. The scanning electron microscope photographs in Figure 4b confirm very small pore sizes inside the medium. The carbon saturation within the pores of the particle can be evaluated; it is equal to 3.8 vol % for a carbon mass fraction equal to 3.1%. The carbon occupies only a little fraction of the pores.
At the scale of the particle bed, we observe inFigure 4c an inhomogeneity of carbon contents: several particles appear much darker than others. Separating manually particles by color classes and measuring their carbon content revealed that their carbon content could deviate by ±50% from the average content of the bed. This disparity in the global particle carbon content is clearly a weak point of the developed medium. However, these particles have a quite small size compared to the chemical front thickness, as shown later, and the particles are well mixed. This results in a reasonably homogeneous medium on the front thickness scale.
3.1.2. Proximate and ultimate analysis.Table 2reports the composition of carbonaceous particles through proximate and
ultimate analyses, which were performed for medium carbon contents ranging from 2% to 4%. Some water adsorbed in the medium could not be avoided, representing only 0.3% of the medium mass. Also, an amount of 0.24% to 0.48% of remaining volatile matter was found. As compared to the 2% to 4% of carbon in the medium, these amounts are not negligible and will impact the mass balance as shown later.
3.1.3. Simple modeling of apparent particle oxidation reaction kinetics. One of the key parameters in modeling of smoldering fronts is the kinetic parameters for the carbon oxidation reaction. Different approaches can be adopted to describe this reaction. The medium can be considered as a homogeneous continuum or as a pack of particles. Depending on the approach, the reaction will be described at a microscopic scale or at the particle scale. In order to serve as a starting point for future modeling of smoldering, the apparent kinetic parameters for carbon oxidation in a single particle were determined in this work using a macro-thermogravimetry device (M-TG). Experiments were performed using approx-imately 500 particles weighting 2 g under two atmospheres: 21% and 10.5% of O2in N2. Experiments were carried out at 600 and 800 °C.
The M-TG device is described in detail in the work of Guizani.20In general terms, the experimental apparatus consists of a 50 mm diameter stainless steel wire grid basket in which a monolayer of particles is placed. This basket is fixed at the upper end of a long alumina rod supported by a weighting system. At t = 0, the basket is rapidly moved into a 75 mm diameter, 1 m long alumina reactor that is preheated to the desired temperature and swept by the atmosphere gas. The gas flow inside the reactor is laminar and flowing at an average velocity of 0.20 m·s−1
at the working temperature. This device allows fast heating of the particles, as they are introduced in the hot furnace within less than 15 s, and good contact between the gas flow and each particle to avoid external mass transfer limitations.
Figure 5reports the mass evolution of 4% carbon particles. Considering the large particle size and the high temperature used, it is likely that the intraparticle carbon combustion is mass transfer limited and that the derived kinetic parameters are “apparent” ones. Indeed, it takes several minutes to totally oxidize the particles even at 800 °C. This quite long time confirms that the reaction is strongly limited by the species transfer.
A very simple Arrhenius type first order model was used to describe the experiments. A least-squares minimization algorithm was then used to identify the unknown parameters A and Ea. = − dm dt km c c (18) = − m tc( ) e kt (19) with = − k A P e0O2 E RTa/ (20)
The constants are determined at A0= 0.327 s−1 ·atm−1
and Ea = 18 500 J·mol−1
. The low activation energy confirms that a mass transfer limitation occurs. Figure 5 shows the con-frontation of the model predictions with the experimental results. Keeping in mind the extreme complexity of carbon combustion, this set of parameters enables satisfactory
Figure 3. Carbon fraction of model medium as a function of sugar concentration in the stock solution.
description of the experiments carried out under different conditions. Let us recall that these kinetic parameters take into account both reactive and species transfer phenomena within a carbonaceous particle.
3.2. Examination of a smoldering reference case.The experimental conditions for all experiments are summarized in Table 3. A reference case (experiment no. 6 inTable 3) was chosen in order to set a starting point for the two parametric studies that will follow, where the carbon content and then the air flow rate were varied. For all future experiments, the particle Peclet number is calculated at a reference temperature of 1000 °C, according to = Pe v d D inter p (21) Figure 4. (a) Optical microscope view of particles filled with carbon: (left) cut-away and (right) external view. (b) SEM cut-away view of carbonaceous particles filled with carbon at a magnification of 50 and 800. (c) Photograph of a bed of particles (picture actual width: 5 cm).
Table 2. Proximate and Ultimate Analysis of the Carbonaceous Particles
Proximate analysis (wt %) Ultimate analysis (wt %) H2O Volatile matter C C H N S
0.16 0.24 2.0 2.0 0.24 0.0 0.0 0.24 0.36 3.0 3.0 0.23 0.0 0.0 0.32 0.48 4.1 4.1 0.25 0.0 0.0
where vinteris the interstitial velocity of air (calculated from the Darcy velocity and the macroporosity of the bed) and D the diffusion coefficient of O2in N2at 1000 °C.
The Darcy velocity is 92 mm·s−1
at 1000 °C, which roughly corresponds to a particle Péclet number of 1.6. The carbon mass fraction of the medium is 3.1%.
Let us first examine the temperature measurement results. Figure 6 reports the temperature within the particle bed at several locations as a function of time. At a given thermocouple, the temperature first increases and stabilizes at a temperature of 58 °C. This is interpreted as a recondensation front of water released as vapor by drying and possibly by the combustion of the remaining volatile matter. When it condensates, its latent heat causes the solid temperature to increase. The smoldering front then arrives, giving rise to a temperature peak. The temperature then decreases slowly, without formation of a plateau. Radial heat losses are responsible for the flattening of the plateau.
As the combustion front travels through the top part of the column, during the period indicated as 1 inFigure 6, the front temperature increases. This transition period corresponds to the establishment of the combustion regime in the medium after ignition. Indeed, the bed surface is not completely ignited close to the cell wall and a 2 cm width ring of unburnt particles along the walls can be observed after an experiment. This is due to a radiative geometrical effect (shadowing) coupled with
important heat losses through the wall. As the front progresses through the medium, this ring of unburnt particles resorbs and finally disappears.
A second period when the front crosses thermocouples 4 to 6 was identified. From this position on, no carbon is left in the medium after the passage of the smoldering front. The system has reached a steady state where the front temperature remains
Figure 5.Evolution of the experimental (···) and modeled () normalized mass of 4%C particles as a function of time under different oxygen partial pressure: PO2= 0.21 (left) and PO2= 0.105 (right). Thin lines are for T = 800 °C, and thick lines for T = 600 °C.
Table 3. Conditions (left) and Results (right) for All Experimentsa
Experimental conditions Experimental results ref C (wt%) vdat 20 °C (mm·s
−1) 1000 °CPe at Δ(using1) eq T(°C)front v
frc(mm·min
−1) (vol %)O2out (vol %)CO2out (vol %)COout (vol %)frCO
1 2.20 21.0 1.6 0.34 703 5.0 5.9 10.7 5.4 33.7 2 2.32 21.0 1.6 0.27 752 6.3 3.8 11.2 6.3 36.0 3 2.59 21.0 1.6 0.32 775 5.3 3.4 12.1 7.1 37.0 4 2.85 21.0 1.6 0.33 1076 5.2 1.1 15.0 6.0 28.4 5 2.88 21.0 1.6 0.28 1026 6.1 0.5 16.0 5.5 25.8 6 3.10 21.0 1.6 0.30 1066 5.7 0.5 15.7 5.4 25.7 7 3.30 21.0 1.6 0.30 1085 5.7 0.5 15.7 6.0 27.6 8 3.41 21.0 1.6 0.33 1068 5.4 9 3.58 21.0 1.6 0.32 1173 5.3 0.3 16.2 8.0 33.2 10 2.30 21.0 1.6 0.33 709 5.2 5.5 10.7 5.8 35.5 11 2.30 105 8 0.51 1056 17.0 11.4 6.4 3.1 32.1 12 2.30 210 16 0.56 1465 31.3 11.3 7.3 2.0 23.2
aCarbon content variation in cases 1 to 9, and air velocity variation in cases 10 to 12.
Figure 6.Temperature at various positions along and across the cell as a function of time (reference case).
equal to 1066 °C. The observed front temperature is only slightly smaller than the theoretical prediction, 1097 °C, ofeq 6, which is as expected. The radial heat losses prevent the establishment of the plateau temperature, replaced by an exponentially decaying profile, but they do not, to a first approximation, impact the peak temperature, as long as the reaction layer is relatively thin. During this period, the condensation front progresses and ultimately reaches the bottom of the cell.
This initiates a third period, during which the water released at the combustion front leaves the system without recondensat-ing. Accordingly, the slope of the curves of the overall system mass as a function of time changes, since it now incorporates the water mass loss in addition to the mass loss due to carbon oxidation. This impacts the apparent value of frCoxi, as discussed below. In some cases, such as in the example in Figure 6, the peak temperature slightly decreases during period 3 with respect to period 2, but this is not a general rule. The variations are always of small amplitude, and sometimes in the opposite direction.
At the first thermocouple crown, the medium temperature at 1 cm from the walls is equal to 700 °C only. This underlines the importance of the radial heat losses of the system. From the time synchronization of these temperatures, we can derive the position and the shape of the smoldering front. The crown thermocouples are synchronous, indicating a horizontal front. Heating of the axis thermocouple occurs after heating of the crown, indicating a dome shape with curvature toward the top of the cell. The height of the dome can be evaluated as 1 cm at the first thermocouple crown, and it does not evolve much through the combustion cell, as attested by temperature recordings at the second craw, 24 cm further downstream. Several explanations have been proposed by Martins21for the dome shape: (i) the air flow temperature is smaller near the cell wall, conveying more oxygen to the front because of a higher density and of a smaller viscosity, and (ii) the bed porosity is larger at the wall due to a different particle arrangement, leading to higher local air velocity. This front shape was observed in most of the experiments, but it can also switch to a dome with a curvature toward the bottom when the carbon content is below 2.3%.
We now examine the results for other measured values. Figure 7presents the time evolution of the apparent fraction of carbon that is oxidized as derived from the mass balance (cf.eq
4). Period 1 appears again as a transitory period where frCoxiis increasing.
During period 2, frCoxi is close to 1; that is, all the carbon within the particle bed is oxidized at the passage of the smoldering front. It has been checked afterward by medium sampling and analysis that all of the carbon is indeed consumed by the smoldering front. During this period, the release of water vapor does not influence the mass measurements, since it recondensates within the bed at a downstream position.
This is no longer the case during period 3. Consequently, the apparent frCoxiincreases and widely exceeds unity.
Table 4presents the mean gas fractions of O2, CO2, CO, H2, and CH4 at the exhaust. These values are particularly
meaningful, as they remain constant through zones 2 and 3 (±0.1 points for O2, CO2, and CO). A little percentage of O2, 0.5%, is found in the flue gas. The oxygen balance leads to the value of −4%. This value was observed to range from −8.8% to +7.5% for all experimental runs: the oxygen balance is considered satisfactory. Finally,Table 4also gives the fraction of carbon oxidized to CO, which is equal to 25.7%.
The three periods of the process evolution were observed in all the experiments with only slight variations. Period 1 is an initial transient. The process is established during periods 2 and 3, with the only difference that water recondensation occurs within the cell during period 2. It happens sometimes that the front velocity slightly changes at the transition from period 2 to period 3. In the following, the measurements of the front temperatures and velocities are always made over period 3, which lasts for a significantly longer time, by considering the peak temperatures of thermocouples 7 to 12, which span the downstream half of the cell.
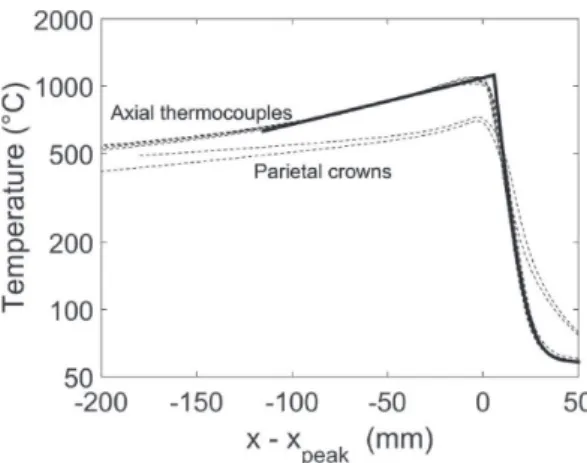
The establishment of a steady regime is well demonstrated by the invariance of the thermocouple responses, which can be superposed when plotted as functions of time relative to the time tpeakof the front passage. Alternatively, the time responses can be converted in spatial temperature profiles, by use of the fitted front velocity.Figure 8results from this procedure for the reference case. The six profiles deduced from thermocouples 7 to 12 along the cell axis are nearly identical. Furthermore, out of a thin region around the peak, they can be represented fairly accurately by decaying exponentials from the peak temperature to the baseline temperature of the recondensation front, according to ° = + < Λ = − Λ T C e x x ( ) 58 1008 ( , 195 mm) x x peak U ( peak)/ U (22a) ° = + > Λ = − Λ T C e x x ( ) 58 1008 ( , 5.4 mm) x x peak D (peak )/ D (22b)
Decay lengths of similar orders of magnitude are observed in all cases with this Péclet number. The profiles deduced from the thermocouples of the crowns closer to the cell wall behave differently, with lower peak temperature and longer decay length, of the order of 500 and 18 m on the upstream and
Figure 7.FrCOxyas a function of time (reference case).
Table 4. Mean Gas Concentrations Exiting the Combustion Cell, frCO, and Oxygen Balance (reference case)
O2(%) CO2(%) CO (%) H2(%) CH4(%) frCO (%)
downstream sides. This is possibly due in part to heat conduction by the steel casing tube. These features are also observed in all experiments with the same Péclet number.
3.3. Influence of the carbon content on the smoldering front. In this section, the carbon content of the medium is varied between 2.2% and 3.58% (experiments 1 to 9 inTable 3). In all cases, steady regimes exist similar to periods 2 and 3 inFigures 6and7. The data discussed here are measured during these time intervals.
Figure 9 plots the experimental front temperature as a function of the medium carbon content. The value of 2.2%
carbon is the lower limit for stable smoldering front propagation through the cell without extinguishing. It leads to a front temperature of 703 °C. Experiments with smaller carbon contents led to progressive front temperature decrease and extinction of the front attested by stable mass of the cell. In previous works using semicoke,14,18extinction of the front was observed near a temperature of 600 °C. The lower limit for a stable front propagation appears to be similar here with the new model porous medium.
The measured front temperatures are in good agreement with the predictions ofeq 11applied on a per case basis with the measured values of Δ and frCO. The deviations are typically of a few tens of degrees and never exceed 70 °C. The front temperature increases over the investigated range and reaches 1173 °C in the medium containing 3.58% carbon. For illustration, the prediction of eq 11for constant Δ and frCO both equal to the typical value 0.31 is also shown inFigure 9. This linear law provides a reasonable first guess and fairly represents the general trend of both the measured and theoretical front temperatures.
However, the data can also be regarded in a different way. A stepwise transition can be tentatively placed between two approximately constant values 740 °C (±40 °C) and 1100 °C (±74 °C) for carbon contents smaller and larger than 2.9%, respectively. This would result primarily from a similar transition of frCO, which is generally smaller or larger than 30%, respectively, in these two regions, with a direct impact on Tadand Tfront, in view ofeqs 10and11. Such sudden transitions have been observed in numerical simulations,10,11related to the onset of CO oxidation in the macropores. In a stratified medium with Pe = 3 to 40, this transition takes place at a carbon content which corresponds to Δ of the order of 0.35, and it is reflected by an important drop of frCO, a marked increment of the front temperature, and the disappearance of oxygen in the flue gas, whereas part of the O2escapes for lower fuel contents. These features are much akin to the present observations.
Figure 10synthesizes the evolution of frCO with the medium carbon content; the plotted error bars of ±2.5% correspond to
what was obtained when repeating an experiment 5 times. The values of frCO do not show very important variations as the front temperature varies in the wide range from 703 to 1173 °C: they range from 25.7% to 37%, without any clear dependency on medium carbon content, except possibly for the aforementioned stepwise drop at 2.9%. A comparison with literature data is proposed inFigure 11. The results from this work fall close to the values obtained in a porous medium by Sennoune.14 As compared with frCO values obtained with single particles combustion,6−8,22
it is clear that the situation of a packed bed of particles with forced airflow leads to much less dispersed values than in the case of a single particle combustion.
Figure 8.Centered temperature profiles deduced from the responses of thermocouples 7 to 12 and from the two parietal crowns (thin broken lines), as functions of position relative to the peak position xpeak (reference case). The heavy solid lines correspond to the exponential fits (eq 22).
Figure 9.Experimental (●) and theoretical (□) front temperatures as
a function of the medium carbon content, as deduced fromeq 11on a per case basis with the measured values of Δ and frCO. The heavy broken line corresponds toeq 11with the typical values Δ = 0.31 and frCO = 0.31.
Figure 10.FrCO (∗) and O2concentration (○) in the exhaust gas as a
Figure 10also reports the oxygen concentration downstream of the smoldering front. At small carbon contents, up to 5% of O2 can be found in the flue gas. The oxygen is only partially consumed, which is probably due to the low temperature of the smoldering front: 703 °C. For all carbon contents, no carbon is left in the medium after the passage of the smoldering front.
Figure 12 reports the effect of carbon content on the experimental chemical front velocity. The theoretical value of
the front velocity,eq 5, is also plotted. Above 2.88% of carbon, the experimental and theoretical velocities calculated usingeq 5 are in good agreement. The chemical front velocity decreases almost linearly to reach 5.3 mm·min−1
at 3.58% of carbon in the medium. This is the expected tendency if all the O2 is consumed by the smoldering front and if frCO is considered stable. For lower carbon contents, the experimental and theoretical velocities share the same trend yet some discrepancies exist. In this range, a large amount of oxygen is not consumed by the smoldering front, thus reducing its velocity proportionally to the amount of unused O2.
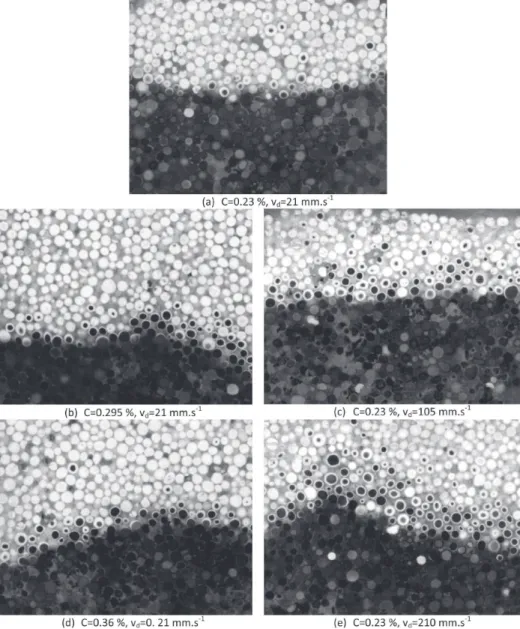
Figure 13reports typical images obtained when cutting the combustion zone post mortem. A spectacular visualization of the carbon rich and carbon poor zones inside the particle is obtained. The chemical front thickness can be defined as the distance between virgin particles and totally oxidized particles. It ranges approximatively from 2 to 4 particles when increasing
the medium carbon content. Observation of a single partially oxidized particle brings clear information. Combustion of carbon occurs from the surface to the center, with a sharp front separating two zones. This indicates that combustion at the particle scale is limited by internal mass transfer. It confirms what was deduced from the long combustion duration and the low apparent activation energy derived during the particle combustion tests.
In a particle, the dark unburnt carbon circle is generally centered. This shows that the combustion is not limited by external mass transfer at the particle surface. Indeed, in the opposite situation, combustion would progress more rapidly at the top, where convective oxygen supply is more efficient, than at the bottom of the particle; the unburnt zone would be located near the bottom of the particle.
3.4. Influence of the gas velocity on the smoldering front.In this section, the Darcy velocity of the air fed to the front was increased by factors of 5 and 10, with respect to the flow rate in the reference case, with a constant carbon content of 2.3% (experiments 10−12 inTable 3). The experimental and theoretical front temperatures are plotted in Figure 14versus the gas Darcy velocity at 20 °C. The experimental front temperature increases from 709 °C to the very high value of 1465 °C when the gas velocity is increased by a factor 10. Recall that the front temperature is theoretically independent of the air flow rate under conditions without heat losses and with constant frCO and Δ. Thus, the temperature increase results from variations of these parameters induced by the change or air flow rate, as explained later on. The agreement of the measurements and predictions is good for Pe = 1.6 and 8, but they deviate by about 200 °C for the larger flow rate. Note that since Δ in the denominator ofeq 11 approaches one in this case, the predictions for Tfrontare very sensitive to its value and to uncertainties in its measurement.
A counterpart ofFigure 8(not shown) for the experiments with larger Pe presents the same qualitative features, but quantitative differences exist. The decay lengths in eq 22 for the axial temperature increase to ΛU ≈300 mm on the upstream side and decrease to ΛD≈4 mm on the downstream side. The most dramatic change is the reduction of the downstream decay length for the thermocouples near the walls, which becomes about 6 mm instead of 18 mm when Pe = 1.6. At small gas velocity, the larger temperature near the wall than on the cell axis downstream of the front is believed to result in some respect from heat conduction in the steel casing tube. As the front progresses faster for large Pe, the extent of the zone preheated by this artifact is reduced.
Figure 15 shows the evolution of oxygen concentration downstream of the smoldering front. As the Darcy gas velocity increases from 21 to 210 mm·s−1
, 5% to 12% of O2 are retrieved while frCO, also plotted in the figure, decreases from 35% to 23%. To our knowledge, such an observation is a new result. The value of 23% is particularly small when compared to data from the literature. Clearly the escape of O2 at large Pe cannot be explained by temperature, which is very high at large Pe. It is likely that the large gas velocity−that results in a short residence time in the reaction zone−is responsible for this. At high Pe, the O2 at the heart of the macropores has no time to diffuse toward the particles before leaving the reaction zone. For all gas velocities, no carbon is left in the medium after the passage of the smoldering front.
Figure 16 presents the evolution of the smoldering front velocity versus the gas velocity. The experimental and
Figure 11.FrCO from this study (∗) as a function of temperature placed in the context of others results from the literature: () Arthur,22(···) Tognotti,6(-·-) Manor,7(---) Zeng,8() Sennoune.14
Figure 12. Experimental (∗) and theoretical (○) chemical front
theoretical velocities calculated using eq 5 are in good agreement. As the gas velocity is multiplied by 10, the front
velocity is multiplied by a smaller factor of about 6; it increases linearly from 5.2 to reach 31.3 mm·min −1
. This results from the incomplete consumption of O2at large Pe. Indeed, from simple
Figure 13.Visualization of the smoldering front for different carbon contents (left) and air velocities (right) (picture actual width: 5 cm).
Figure 14.Experimental (●) and theoretical (□) front temperature as
a function of Darcy gas velocity. Figure 15.FrCO (∗) and concentration of O2(○) in the exhaust gas
stoichiometric considerations, the ratio vfrc/vd decreases if not all oxygen is used (or equivalently, for this matter, if the inlet gas contains a smaller fraction of oxygen). For the same reason, Δ increases significantly (cf. Table 3), since it is inversely proportional to vfrc/vdin view ofeq 1, and as Tadis unmodified, the front temperature given byeq 11also increases.
This is the main mechanism responsible for the increase of the front temperature, and it is directly accounted for in the theoretical model. But other and less easily quantified effects might play a role.
For large Pe, the front travels faster and spends a smaller time at each position along the cell, with a possible effect on the heat losses at the walls. In an ideal system (vanishingly thin front, no heat conduction along the cell casing), the singular losses right at the front position are not supposed to impact its temperature. But since the front is really a few grain diameters thick, these losses are actually not singular and may significantly affect the front energy balance. Larger Pe and larger front velocity tend to decrease this effect, but as discussed below, the front thickness increases with Pe, which acts in the opposite direction. It is difficult to figure out precisely the net outcome. Another effect is related to heat conduction along the cell walls. As already mentioned, heat leakage from the front by longitudinal conduction in the steel wall, which directly taxes the front energy balance, is reduced when the front velocity increases. Thus, the possible limitation of Tfrontcaused by this artifact is less significant at large flow rates.
Figure 13 shows the font structure at the different Peclet numbers using a medium with 2.3% carbon. The observations of internal and not external mass transfer limitations made at small gas velocity and carbon change remain applicable. This was expected, since increasing the air velocity still improves the external mass transfer efficiency: external transfers are still not limiting. At the lowest gas velocity, the front temperature is 718 °C, and the front thickness is approximately 2 particles. As the gas velocity is increased 5 times, the front temperature is 1059 °C and the front thickness has clearly increased to 4 particles. This thickness increase is still more visible with a gas velocity of 10 times the initial one: the front thickness reaches 6 particles. These observations are reminiscent with the one of Debenest9 where the size of the oxidation zone at the pore scale was numerically studied depending on the Péclet values. At low Péclet values, the front thickness remains close to one diameter whereas it is close to 4 diameters at Péclet equal to 16.
4. CONCLUSION AND PERSPECTIVES
The new model porous medium gives full satisfaction of a number of objectives. It was possible to control accurately the amount of carbon deposited in the matrix. Each single particle appeared to be well impregnated in carbon from the surface to the center. The medium appears to have a very good mechanical stability, showing a compression after front passage of less than 2 mm over a 600 mm high bed. Large quantities can be prepared with a good repeatability. Finally, the medium allowed spectacular visualization of the local carbon content within the particles and on the bed scale thanks to post-mortem cuts of the bed.
The model medium also showed limitations. Not only carbon is deposited in the matrix. The medium releases some water and volatile matter during heating and before carbon consumption. Water mass represents 20% of the carbon mass content within the medium, and introduces perturbations when monitoring the mass of the cell. A variability of ±50% in carbon content from one particle to another was also observed.
The new, longer combustion cell and porous medium allowed performing repeatable experiments over a large range of carbon contents and air flow rates. All experiments revealed important heat losses at the cell walls, leading to temperatures near the walls much smaller than along the cell axis. Nevertheless, the front temperatures at the axis are close to theoretical values, which means that at the center of the cell heat losses have minor impacts on the combustion. This leads us to believe that these experiments are representative to a certain extent of what can be found in large scale processes.
The experiments brought new and consolidated results. In all experiments it was observed that all carbon is consumed at the front passage. This is not the case for the fed oxygen. At the smaller temperatures, small quantities of O2 cross the font without being consumed. At large air velocities, more than half of the fed O2crosses the front without being consumed, despite the very high front temperature. This results in very high front temperatures, which can be explained by an increase in the value of Δ.
The fraction of carbon oxidized to CO appears to vary between 25.7 and 37% for an air velocity of 21 mm·s−1
. It is strongly impacted by an increase in the air flow rate, with values decreasing from 35% down to 23% when the air flow rate is multiplied by 10.
The front becomes thicker when increasing the carbon content in the medium. As air flow rate increases, the front thickness also increases from 2 to 6 particle sizes.
Both the apparent kinetic parameters derived for a single particle combustion and the post-mortem direct observation of carbon content inside particles in the smoldering front indicate strong mass transfer limitations within the particles.
These results are intended to serve as a benchmark for the validation of a numerical model in a future work.
■
AUTHOR INFORMATIONCorresponding Author
*E-mail:[email protected].
Notes
The authors declare no competing financial interest.
■
ACKNOWLEDGMENTSThe authors acknowledge the support of the French Agence Nationale de la Recherche (ANR), under grant
ANR-11-BS09-Figure 16. Experimental (●) and theoretical (□) chemical front
0005 (project INSICOMB). This work also pertains to the French Government program “Investissements d’Avenir” (LABEX INTERACTIFS, reference ANR-11-LABX-0017-01).
■
NOMENCLATURE Physical symbols A0 pre-exponential factor (s−1 ·atm−1 ) Cp calorific capacity (J·kg−1 ·K−1 ) dp particle diameter (m) D diffusion coefficient (m2·s−1 ) Ea activation energy (J mol−1)
frCO fraction of carbon oxidized into CO (−)
frCoxi fraction of carbon oxidized by the combustion front (−) frOoxi fraction of oxygen consumed by the combustion front
(−) k constant (−) m mass (kg)
M molar mass (kg mol−1 ) ṁ mass flow rate (kg·s−1
) P partial pressure (atm) Q molar flow rate (mol·s−1
) R ideal gas constant (J·K−1
·mol−1 ) S cell cross-sectional area (m2) t time (s)
tpeak time when temperature peaks at a thermocouple (s) Tamb ambient temperature (K)
Tfront combustion front temperature (K) vd Darcy gas velocity (m.s
−1 ) vfrc chemical front velocity (m·s
−1 ) vinter interstitial gas velocity (m·s−1
) x mass fraction in the solid phase (−) xpeak front position (m)
Y mole fraction in the gas phase (−)
Greek symbols
Δ Ratio between thermal and combustion front velocities (−)
ΛU, ΛD Upstream and downstream decay lengths (m) ρ Volumetric mass (kg·m−3
)
Subscript materials
bed particle bed C carbon g gas
in entering the system O oxygen
out exiting the system al alumina matrix
Others
Pe Peclet number (−)
■
REFERENCES(1) Ohlemiller, T. SFPE Handbook of Fire Protection Engineering, 3rd
ed.; 2002, Ch. Smoldering Combustion, pp 2200−2210.
(2) Pironi, P.; Switzer, C.; Rein, G.; Fuentes, A.; Gerhard, J.; Torero, J. Small-scale forward smouldering experiments for remediation of coal tar in inert media. Proc. Combust. Inst. 2009, 32 (2), 1957−1964.
(3) Akkutlu, I.; Yortos, Y. The dynamics of in-situ combustion fronts in porous media. Combust. Flame 2003, 134 (3), 229−247.
(4) Ohlemiller, T. Modeling of smoldering combustion propagation. Prog. Energy Combust. Sci. 1985, 11, 277−310.
(5) Debenest, G.; Mourzenko, V. V.; Thovert, J. F. Smoldering in fixed beds of oil shale grains. Governing parameters and global regimes. Combust. Theory Modell. 2005, 9, 301−321.
(6) Tognotti, L.; Longwell, J. P.; Sarofim, A. F. The products of the high temperature oxidation of a single char particle in an electro-dynamic balance. Symp. (Int.) Combust., [Proc.] 1991, 23, 1207−1213. (7) Manor, Y.; Suuberg, E. M.; Ho, M.; Toor, H. L. The ignition and combustion behaviour of spent particles. Symp. (Int.) Combust., [Proc.] 1982, 19, 1093−1103.
(8) Zeng, T.; Fu, W. B. The ratio CO/CO2of oxidation on a burning
carbon surface. Combust. Flame 1996, 107 (3), 197−210.
(9) Debenest, G.; Mourzenko, V. V.; Thovert, J.-F. Smoldering in fixed beds of oil shale grains. A three-dimensional microscale numerical model. Combust. Theory Modell. 2005, 9, 113−135.
(10) Elayeb, M. Modélisation à l’échelle microscopique de transports avec réaction en milieu poreux: Combustion en lit fixe. Ph.D. Thesis, Université de Poitiers, Septembre 2008.
(11) Elayeb, M. E., Debenest, G.; Mourzenko, V. V.; Thovert, J.-F. 3d microscale simulations of smoldering; MCS 6: Ajaccio, June 7−11, 2009. (12) Oliveira, A. A. M.; Kaviani, M. Nonequilibrium in the transport of heat and reactants in combustion in porous media. Prog. Energy Combust. Sci. 2001, 27, 523−545.
(13) Klimenko, A. Y.; Abdel-Jawad, M. M. Conditional Methods for Continuum Reacting Flows in Porous Media. Proc. Combust. Inst. 2007, 31, 2107−2115.
(14) Sennoune, M. Reducing CO2emissions from oil shale semicoke
smoldering combustion by varying the carbonate and fixed carbon contents. Combust. Flame 2011, 158 (Issue 11), 2272−2282.
(15) Chase, M. W. NIST-JANAF Themochemical Tables, 4th ed.; J. Phys. Chem. Ref. Data, Monograph 9, 1998, 1−1951.
(16) Joo, S. H.; Jun, S.; Ryoo, R. Synthesis of ordered mesoporous carbon molecular sieves CMK-1. Microporous Mesoporous Mater. 2001, 44−45, 153−158.
(17) Luo, S.; He, S.; Li, X.; Sun, C.; Seshan, K. Carbon covered alumina prepared by the pyrolysis of sucrose: A promising support material for the supported Pt−Sn bimetallic dehydrogenation catalysts. Catal. Today 2014, 234, 295−300.
(18) Sennoune, M.; Salvador, S.; Debenest, G. Impact of a CO2
enriched gas on the decarbonation of CaCO3 and on the oxidation of carbon in the smoldering process of oil shale semicoke. Energy Fuels 2012, 26, 391−399.
(19) Ohlemiller, T. J. Prog. Energy Combust. Sci. 1985, 11, 277−319. (20) Guizani, C.; Escudero Sanz, F. J.; Salvador, S. The gasification reactivity of high-heating-rate chars in single and mixed atmospheres of H2O and CO2. Fuel 2013, 108, 812−823.
(21) Martins, M. F.; Salvador, S.; Thovert, J.-F.; Debenest, G. Co-current combustion of oil shale − Part 2: Structure of the combustion front. Fuel 2010, 89 (Issue1), 133−143.
(22) Arthur, J. R. Reaction between carbon and oxygen. Trans. Faraday Soc. 1951, 47, 164−178.