OATAO is an open access repository that collects the work of Toulouse
researchers and makes it freely available over the web where possible
Any correspondence concerning this service should be sent
to the repository administrator:
[email protected]
This is an author’s version published in:
https://oatao.univ-toulouse.fr/22303
To cite this version:
Panzoli, David and Cussat-Blanc, Sylvain and Pascalie, Jonathan
and Disset, Jean and O'Rourke, Marvyn and Brichese, Laetitia and
Lobjois, Valérie and Bonnafe, Elsa and Geret, Florence and Pons
Lelardeux, Catherine and Ducommun, Bernard and Duthen, Yves
Learning the cell cycle with a game: Virtual experiments in cell
biology. (2017) In: 9th International Conference on Games and
Virtual Worlds for Serious Applications (VS-Games 2017), 6
September 2017 - 8 September 2017 (Athens, Greece).
Learning the Cell Cycle with a game: virtual
experiments in cell biology
David Panzoli
∗§, Sylvain Cussat-Blanc
†§¶, Jonathan Pascalie
∗§, Jean Disset
§, Marvyn O’Rourke
∗, Laetitia Brichese
‡,
Val´erie Lobjois
¶, Elsa Bonnaf´e
∗, Florence G´eret
∗, Catherine Pons Lelardeux
∗§, Bernard Ducommun
¶kand Yves Duthen
†§∗INU Jean-Franc¸ois Champollion, Place de Verdun, Albi, France
Email: [email protected]
†Universit´e de Toulouse ; UT1 Capitole ; 2 Rue du Doyen-Gabriel-Marty, F-31042 Toulouse, France. ‡Universit´e de Toulouse ; UT3 Paul Sabatier ; 118 route de Narbonne, F-31062 Toulouse, France.
¶Universit´e de Toulouse, ITAV USR3505, CNRS, UPS, F-31106 Toulouse, France. §IRIT UMR 5505, F-31400 Toulouse, France
kCHU de Toulouse, Toulouse, France.
(all authors) Serious Game Research Network
Abstract—Cell Cycle Learn (CCL) is a learning game de-signed for undergraduate students in Biology to learn common knowledge about the cell-division cycle along with practical skills related with setting up an experiment and the scientific method in general. In CCL, learners are guided through the process of formulating hypotheses, conducting virtual experiments and analysing the results in order to validate or invalidate the hypotheses. The game has been designed in the University of Toulouse and introduced last year as part of the curriculum of a cellular biology class. This paper presents early results of an evaluation of the game enabled by questionnaires filled by the participants and game data collected during the training sessions. The results demonstrate with examples that both types of data can be used to assess the game’s utility.
Keywords—Cellular biology, learning game, game data.
I. CONTEXT AND RELATED WORK
Cell Cycle Learn (CCL) is a learning game designed by a multidisciplinary group of researchers and teachers for undergraduate students to learn about the cell cycle and its regulation. Learning about the cell-division cycle is a cru-cial prerequisite to study proliferation for any curriculum in Biology and therefore the matter is taught early to students. The objective is to understand elementary concepts of the cell life, among which lie the different phases of the cell cycle, their duration and the checkpoints enabling the cell to progress through the cycle up to mitosis.
The cell cycle is often drawn as a circular timeline con-sisting of four phases named G1, S, G2 and M. By the end of G1 phase, at checkpoint named “commitment”, the cell integrates environmental signals before proceeding towards G1/S transition. A lack of these signals will lead the cell to enter a quiescent state (G0), a subsidiary phase of the cell cycle which consists for the cell to wait for better environmental conditions. In addition to proceeding in its cycle or wait in G0, the cell can also decide to die (apoptosis) or to differentiate. When a cell progresses in the cell cycle, it must accurately duplicate all its internal material (DNA, centrosome, etc.) and double its mass before preparing for division. Before entering into S phase where DNA synthesis occurs, the cell must check
for the integrity of its genetic material, which is called the G1/S DNA integrity checkpoint. Then, after replication, the cell switches to G2 phase in order to complete doubling its mass and organelles. During these last two phases (S and G2), duplicating centrosomes will allow the assembly of the mitotic spindle required for M phase (mitosis) to occur. However, before proceeding to this last stage, the cell checks once again the integrity of its genetic material. This is usually named G2/M checkpoint. When mitosis occurs, the cell (meaning all its internal material as well as its membrane) divides and produces two new cells that will restart their cycle in G1 phase. The cell cycle is dependant on internal or external conditions, the checking of which is the very purpose of the checkpoint mechanism. Therefore, in a cell culture, the cycle can be controlled [1] by endogenous or exogenous factors.
Most of these concepts were discovered during the second half of the nineteenth century and are considered general knowledge. For this reason, they are now delivered to students via lectures and tutorial and expected to be learnt by heart and retained permanently. Yet, experimentally controlling the cycle is the way scientists have first highlighted and then un-derstood its mechanisms and properties. Experiential learning, as theorised by Kolb [2] is empirically supported by expert teachers as the most effective way to teach the cell cycle to students. For this reason, the teaching should ideally be supplemented by practical works in the lab with actual cell cultures. Unfortunately, this is seldomly the case for several reasons.
Firstly, growing cells in in-vitro culture is a costly activity. Cell lines are expensive, and so is the sterile equipment and its maintenance. In addition to this, the cell cycle is a fundamental matter which must be taught early in the student’s graduate program and therefore a large number of students is concerned, which multiplies the costs. Secondly, for meaningful observations to be made, the duration of the experiment must be over 48 hours, during which measures must be performed manually at an interval of 6 to 12 hours. Of course, this is hardly compatible with the time table. Thirdly, experiments studying the cell cycle demand precision. Many parameters must be controlled and many manipulations are
necessary before obtaining any result: Make one mistake and the result is flawed or spoiled, and the experiment must be started from scratch. As a consequence of these constraints, practical experiments studying the cell cycle have been removed from the program and this matter is only learnt in the classroom. From an educational point of view, this causes two problems. Practical works represent a form of active learning, which has been evidenced as an improvement over more classic forms of knowledge delivery by Richard Hake in physics education [3]. Learning by practising is therefore likely to help understanding the underlying processes and grounding them in concrete experience, so as to facilitate their later recollection. Without practice, knowledge related to the cell cycle is repeatedly reported by teachers to be a tough obstacle for undergraduate students. Moreover, carrying out experiments allows students to get familiar with the scientific method. Designing, planning and setting an experimental protocol is an important part of the required skills in biology. To deal with the difficulty for students to understand the cell cycle and its mechanisms, a lot of material has been designed and can be found on the Internet. Explanatory animated clips illustrating the processes underlying the cell cycle are plentiful on video-sharing online platforms, and such content seems to be of interest, according to the high number of views. Serious games are another form of content freely and easily available. Most of them are quiz games helping students rehearse newly acquired knowledge, like “The Cell Cycle” [4]. “Cell Craft” [5] offers a more compelling gameplay. Through the incremental exploration of several levels, the player is led to build a properly functioning cell, and doing so, understand cellular metabolism and the role of DNA, mitochondria, ribo-somes, etc. “Inky the squid and the scientific method” [6] is not a game dealing with cell biology per se, but it promotes the sci-entific method. It is a metaphorical game where facts about the scientific method must be collected by a squid in an underwater world. Virtual labs represent a form of training closer to the experience of practical works. They aim to recreate virtually the process of conducting an experiment through an interactive yet guided path of activities, engaging “the students [to] mimic the work methodology of a scientist and [to] rediscover laws of nature” [7]. The Howard Hughes Medical Institute has designed a series of virtual labs consisting of a graphical reconstruction of a lab including several pieces of equipment (Petri dish, microscope, etc.) covering various topics (bacterial identification, stickleback fish evolution, etc.) with interactive observation or manipulation activities. More labs in biology are available online (see [8] for a list). Maciuszek et al. make the case for designing digital experiments in virtual labs in Second Life in [7], taking advantage of the features offered out-of-the-box by the online virtual environment and the provided scripting language for immersing the learner into a relatively realistic experience (depending on the complexity of the script). This is the approach of medical education where scientific simulators are resorted to in order to produce accurate outputs with respect to the parameters set by the learner and the actions carried out during the experiment (see [9] for examples of medical simulators).
In CCL, we have opted for a mixed design compromising between scripted scenarios offering user guidance and the use of a dedicated cell cycle simulator allowing for free exploration
and trial and error learning. CCL follows two objectives: Firstly, overcoming the constraints of real-life experiments by means of a virtual lab offering to every learner as many trials and errors as it takes for the knowledge (concept, calculation, protocol, manipulation, technique, etc.) to be understood once and for all, without any regard for time, cost or risk. Secondly, training them to the scientific method which is: formulating one or several hypotheses about a property to study, design an experiment scheme, conduct the experiment, obtain the results and analyse them in order to confirm or invalidate the initial hypotheses.
II. SIMULATION BACKGROUND
Simulating the cell behaviour for the biologists to help them understand the underlying mechanisms of cell cultures has been a prolific research domain [10], [11], [12], [13] in which various cell types have been modelled and sim-ulated in very different contexts, specifically designed for very precise research questions. In a previous work, some members of the CCL project have proposed an individual-based model in which the cell behaviour is modelled using a check-point oriented paradigm [14], [15]. Such models have been demonstrated to represent accurately complex biological system dynamics [16]. The aim of this model is to easily take into account various cell lineages and environmental conditions naturally, only by modifying transition probabilities between the different stages. Pascalie et. al [14], [15] showed that the simulator is able to reproduce in-vitro data generated from cell cultures with various cell lineages and in environmental conditions.
III. GAME DESIGN
CCL has been engineered on top of this simulator to take advantage of its capabilities to simulate the actual evolution of a population of virtual cells, thus allowing the students to experiment freely in a safe environment. The remaining chal-lenges have consisted to i) provide a friendly user-interface to facilitate the control of the game by the learners in comparison to the simulator, and ii) to add a narrative for them to be guided through the process of conducting virtual experiments and analysing the results in order to acquire the targeted knowledge and skills.
A. Presentation
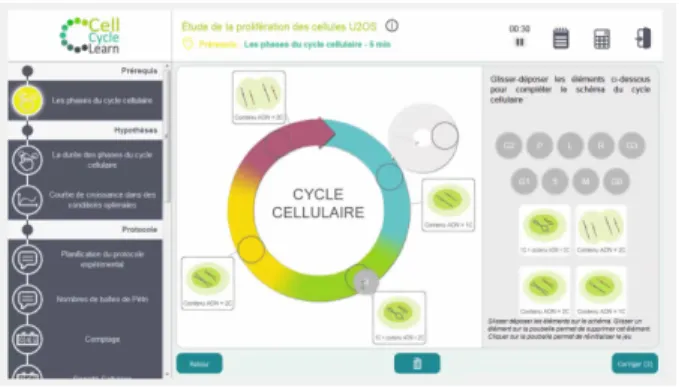
The learning game is presented as a web application available via a Web browser. The game currently runs on its own page but it has been designed to be integrated within a Learning Content Management System (LCMS) with minor adaptations. Figure 1 presents a view of the main panel. The top bar displays the title of the sequence and the current activity. It also regroups icons for side-tools of the game: a timer (that can be paused) to help learners keep track of time, a notepad for recording important things like calculation results, and a calculator. The left-side panel lists the activities of the sequences being played along with icons depending on their type (cf. next section). It has been designed mainly for the learner to control their progress through the scenario but can also be used to jump back to the memo sheet (cf. next section) of any previous activity if required. Finally, the central panel hosts the current activity. Buttons at the bottom are used by
Fig. 1. The game is presented as a slideshow of interactive activities and transitions which must be unlocked one after the other. The progress within the scenario is outlined by a bullet-point-like progress list on the left.
the learner to clear or submit their answer, or to advance to the next activity once unlocked.
B. Content
A sequence is the virtual re-enactment of an experiment. It consists of 6 sub-sequences, each being composed of one or several activities:
Requirements Activities to assess the knowledge required for the sequence. Whether the learner suc-ceeds or not, such an activity is corrected and the results are afterwards available throughout the entire sequence and can therefore be assumed to be known in any further activity.
Hypothesis Activities where the learner is required to formulate hypotheses concerning the one or several properties which are targeted by the sequence. Hypotheses are not corrected since the objective of the scenario is for the learner to experiment and find by themselves the correct answer (step 5: Results). Protocol A sub-sequence of activities whose objective
is to set up the experiment. The protocol mostly addresses mathematical competen-cies like counting cells, measuring or calcu-lating dilutions. Hands-on skills to manipu-late the equipment is out of the scope of the game and must be practised during actual practical works.
Experiment Once the protocol is established, the exper-iment is launched. It does not correspond to any interactive activity. Setup data are uploaded to the cell simulator and results collected within seconds.
Results The collected results are presented to the learner for analysis. The analysis is usually guided through a step-by-step progression of activities where the learner is pointed to the relevant data and asked to correct their own hypotheses.
Synthesis In this final activity, the learner summarises the knowledge covered by the scenario by means of filling the blanks of a cloze test.
A sequence is therefore composed of several interactive activities distributed among the 6 stages. Each stage is announced by a transition slide. The activities are of several types:
activity type instructions
Drag & drop Place tags on a drawing or a chart at their correct locations.
Curve Draw a curve with the mouse to sketch a pattern.
Planning Sketch a plan of the experiment using a form and a timeline-like graphical representation. Pipette Prepare a mix of cell/medium/serum using
graduated pipettes.
Count Estimate a cell count on a hæmocytometer. Calculation Perform a calculation.
Cloze text Fill in the blanks in a text.
Unless designed otherwise (e.g. hypothesis activity, read paragraph below), each activity is corrected as soon as the learner submits their answer. Good answers are classically accentuated in green colour, bad answers in red. The learner is always granted 3 attempts, after which a memo sheet is displayed. The memo sheet of an activity is critical for the pedagogy. It displays the complete correction of the activity along with additional explanations. Each of them has been designed by hand so that the most adequate illustrations and layout were used regardless of the type of the activity. The memo sheet of every completed activity remains conveniently available until the end of the sequence. That way, learners can refer back to any of them at any time of the game.
Some activities are endowed with special attributes. For in-stance, “hypothesis” activities are not corrected automatically by the game but the answer is recorded and retrieved at the end of the sequence for the learner to correct by themselves on the basis of the experiment results. This self-correction is achieved in a “time limited” activity where the players are timed and score accordingly.
IV. EXPERIMENTS
The experiments studied in this paper have taken place between September and November 2016 in two locations of Toulouse University: Paul Sabatier in Toulouse and Jean-Franc¸ois Champollion in Albi. The results (questionnaires and game-data presented in section V) were similar for both groups and were therefore grouped for the study.
The game was introduced in the classroom as part of a course of cellular biology. Each session is composed of two sequences, each featuring a different educational scenario and thus exploring a different set of knowledge and skills. Se-quences are independent from one another but both are scripted following the same framework, as described in section III-B. Sequence 1 deals with the duration of the cell-cycle phases. It is composed of 9 playable activities, detailed in table I. The learner is led to understand that the duration of each phase is proportional to the number of cells currently in the phase (assuming the population is desynchronised) which can be observed on a macroscopic scale by the FACS (Fluorescence-activated cell sorting) method. Secondarily, the scenario also allows to observe, by counting the cells at a regular time
interval, that a cell population grows following a non-linear (exponential) pattern.
TABLE I. ACTIVITIES COMPOSING THE FIRST SEQUENCE
# activity type special
1 Requirements Transition 2 The stages of the cell cycle Drag & drop 3 Hypothesis Transition
4 The duration of the cell cycle phases Drag and Drop hypothesis 5 Growth pattern under optimal conditions Curve hypothesis 6 Protocol Transition
7 Experimental planning Memo sheet 8 Petri dish count Memo sheet
9 Cell count Count
10 Evaluating the cell density Calculation 11 Number of cell per dish and dish size Memo sheet 12 Cell seeding Pipette 13 Experimentation Transition 14 Results Transition 15 Cell counts along the experiment Drag and Drop 16 Concluding on growth pattern under optimal
conditions
Curve time-ltd 17 Proportion of each phase of the cycle Drag and Drop
18 Proportionate duration of each phase of the cycle
Drag and Drop time-ltd 19 Synthesis Transition
20 Summarising on the cell cycle under optimal conditions
Cloze text
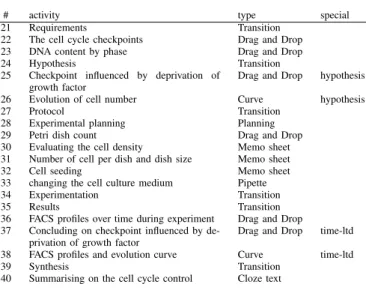
Sequence 2 comprises 11 playable activities, detailed in table II below. This sequence deals with how the cell cycle can be controlled by exogenous factors. By an action on the culture medium, namely a starvation of growth factor, the learner witnesses the population of cells synchronising on a specific phase (G1). By assuming that the cells are unable to progress to the next phase (S), the learner is expected to identify the specific role of the checkpoint of G1 phase (restriction point), which is to ensure the cell will have at disposal in its immediate environment enough material before engaging into cell cycle propagation.
TABLE II. ACTIVITIES COMPOSING THE SECOND SEQUENCE
# activity type special
21 Requirements Transition 22 The cell cycle checkpoints Drag and Drop 23 DNA content by phase Drag and Drop 24 Hypothesis Transition 25 Checkpoint influenced by deprivation of
growth factor
Drag and Drop hypothesis 26 Evolution of cell number Curve hypothesis 27 Protocol Transition
28 Experimental planning Planning 29 Petri dish count Drag and Drop 30 Evaluating the cell density Memo sheet 31 Number of cell per dish and dish size Memo sheet 32 Cell seeding Memo sheet 33 changing the cell culture medium Pipette 34 Experimentation Transition 35 Results Transition 36 FACS profiles over time during experiment Drag and Drop 37 Concluding on checkpoint influenced by
de-privation of growth factor
Drag and Drop time-ltd 38 FACS profiles and evolution curve Curve time-ltd 39 Synthesis Transition
40 Summarising on the cell cycle control Cloze text
Note that in the two scenarios above, the cell simulator is not involved: since every activity in the protocol is corrected before proceeding to the experiment, the results are logically known in advance without any computation required. However, the simulator is used to generate most of the data presented to the learners, which allows both a realistic data presentation and data quality control for a cost close to zero. Besides, a third scenario has been developed where the simulator
Fig. 2. Cell Cycle Learn being used in the classroom with undergraduate students in a Cell Biology class.
is fully utilised. In this scenario, learners are required to confirm/invalidate a list of hypotheses by planning and launch-ing experiments with the greatest freedom and autonomy. However, the lack of guidance was deemed problematical by biology teachers during the first testing of the game and therefore the third scenario was excluded from later use in class.
V. EDUCATIONAL SETTING AND DATA COLLECTION
Although the game was introduced in two institutions, the set-up was identical for both. The experiment was conducted as part of an actual class of cellular biology followed by 2nd and 3rd year undergraduate students in Biology (n = 337, 286 in Toulouse + 51 in Albi). One 2-hours game session was added to the course program which is usually only composed of lectures and tutorials since practical works cannot be organised for that part of the program due to technical and cost reasons (cf. section I).
Groups of approximately 20 students, supervised by one teacher, attended the virtual technical work in computer rooms, each student in front of a computer as illustrated in Figure 2. Each student was expected to play and progress through the 2 sequences at their own pace, and ask for help whenever they were confused by the instructions or puzzled by a result or an explanation.
The scientific methodology applied to the evaluation of this game aimed to assess three criteria, as per the framework described by Andr´e Tricot in [17].
• Utility describes how well the game has reached its objectives, namely how effective was the training achieved by/using the game.
• Usability measures how easily and fast the students got familiar with the game and its mechanics. It is also related to satisfaction and pleasure of use. • Acceptability measures to what extent the game is
endorsed by the audience. Although many factors play on acceptability, depending on the context, it is generally related to how compatible or aligned the objectives of the game are with those of the learner.
Data were collected in two ways: A survey was conducted at the end of the session; it contained questions related to both usability and acceptability, looking to evaluate how readily and efficiently the students could use the game but also the extent to which they would play the game on their own will or recommend it to a self. Computer logs were also silently collected during each session; they record every interaction of the player (visual element clicked, answer submitted, etc.) along with their time-stamp. Analysing those traces is likely to help shedding some light upon the utility of the game but it is also useful for cross-checking the answers of the questionnaires.
VI. RESULTS
A. Questionnaire
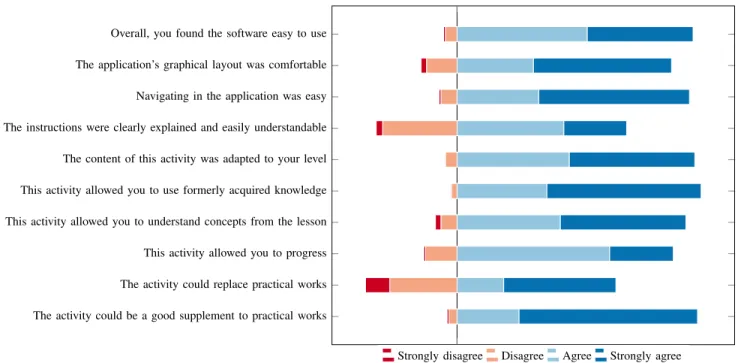
The survey was taken by 279 students out of 337 who used CCL in the classroom in 2016 (response rate : 83%). The answer distribution is presented in figure 5. The chart shows an overall positive welcome of the game by the student audience. The software ease-of-use (comfort, navigation) is recognised by a large majority of users (96%). The content is well adapted to the level of the students, which was an expected result considering it was designed by biology teachers from previously existing teaching material to blend naturally into the educational scenario. A large majority of students agree to say that the game allowed them to make progress. Two results stand out: Firstly, a significant number of students complain about the instructions not being always clear and precise. Secondly, the statement that the game could replace practical works is disputed by nearly half the population, although the majority agrees on the game to be a good supplement to practical works.
Figure 6 presents word clouds generated from the answers given to the last two questions of the survey, which are open-ended questions. The more a word is used within the answers, the bigger it appears on the cloud, so that meaningful observations can be made at a glance (although a complete semantic analysis should be envisaged if those results were to be used for drawing scientific conclusions). In the first question, the participants were asked to report only the positive points of the game and/or the teaching type. What we first learn from the answers is that they found the experience playful. Words like knowledge, acquired and reviews indicate the students have acknowledged the scientific reach of the game. Among other positive assets, the students identified that the game promotes autonomy and allows practice without con-sequences. Regarding areas where improvements are needed, the questions and the instructions were the most challenged aspects, particularly a lack of clarity in the wording of some explanations and corrections. Two specific problems were also pointed out: the learners found some calculations very complex and they wished they were provided with more help; the pipette activity (activity #12) was criticised for its difficulty as any dosage error required the activity to be restarted from scratch since no undo action was provided.
B. Computer log analysis
The second part of the evaluation is the analysis of in-game user-traces reported by the in-game during the sessions.
This process known as learning analytics or educational data mining, applied to learning games, is a promising path of research whose purpose is as much to study and evaluate learners as to improve the learning process itself. Indeed, collected data can be used at two levels, as described in [18]: in-game logging analysis is performed at learner’s scale and used online (e.g. in real time) for the learner’s benefit (per-sonalisation, profiling, etc.) whereas posterior logging analysis aims to use population-scale data for evaluating or improving the game offline. Game-data processing can therefore be used to discriminate between different learner profiles, to build a learner model, to measure how similarly to an expert a learner behaves [19] or to evaluate how much of the “lesson” or skills are being acquired by the learner [20], [21]. Game-data processing can also entail changes in the learning environment: for example by pointing bottlenecks in the gameplay and suggesting improvements accordingly or, in a more adaptive fashion, adapt the narrative to the learner in response of their interactions [22], [23] in real time, which is referred to as adaptive storytelling.
The early analysis of this paper focuses on the usability of the game, which is a primary concern for the project since it is now scheduled to be used regularly by two institutions. Although utility and acceptability are also important eval-uation criteria, we consider them secondary in this project since i) the game is included in the program as part of a compulsory course and therefore students’ acceptance would be biased if not irrelevant and, ii) this part of the program was overlooked before the game was introduced and therefore its benefits are undeniable although its utility could not be readily demonstrated. In the following paragraphs, we report the most interesting results we have obtained from investigating potential ways for game-data to be interpreted as usability metrics. User-traces are very low-level, as they record every action from the players; they were therefore aggregated into meaningful data in order to reveal relationships or patterns.
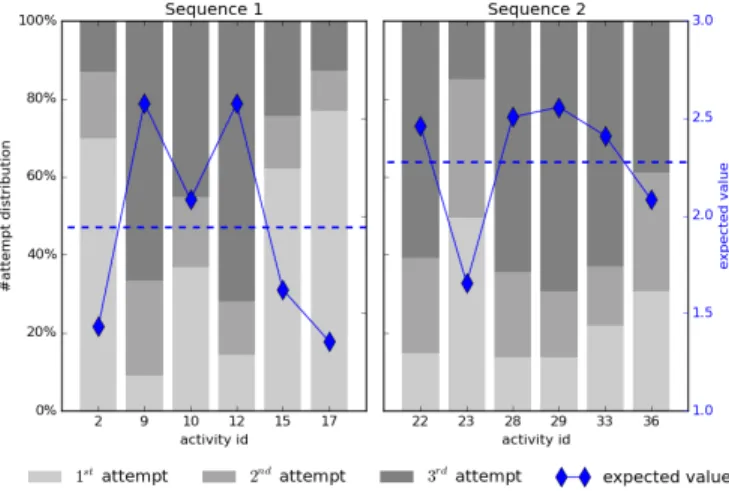
Figure 3 illustrates the distribution of attempts in playable activities of sequences 1 (leftmost sub-figure) and 2 (right-most). Each stacked bar reflects the distribution for each activity of the 1st, 2nd and 3rdattempts.
Fig. 3. The distribution of attempts on each playable activities indicates that sequence 2 is more difficult than sequence 1.
standard formula of a binomial distribution (1) with xi being the number of attempts and pi the probability of completing the activity in xi attempts.
µ = n X
i=1
xi.pi (1)
This expected value reflects the average number of attempts necessary for completing the activity. Thus, it stands as a good indicator of an activity’s difficulty. For each sequence, a mean expected value is computed by averaging the expected values of each activity in the sequence. Similarly to the activities, this measure represents a good indicator of a sequence difficulty. Applying this method, sequence 1 is showing a difficulty rate of 1.9 and sequence 2 of 2.3. In consequence, we can infer that sequence 2 is harder than sequence 1, which is consistent with our expectations since the scenarios were designed with increasing complexity and length.
The same estimators can serve another purpose. Individually, the level of difficulty of each activity can be compared to the average level in the sequence in order to identify activities whose complexity may be discrepant with the others within the same sequence. For instance, the chart on the left in Figure 3 makes clear that activities #9 and #12 from sequence 1 stand out from the others, whose average level of difficulty is otherwise rather consistent. This is an indication that these activities should be reworked to match the average level of difficulty in this sequence. In the case of activity #12, this observation is corroborated by the survey (cf. section VI-A) where bad game design was pointed out by the learners. The difficulty of activity #9 however is unexpected and the instructions should be rethought by the experts. In contrast, the same method allows to detect that activity #23 is overly simple with respect to the other activities within sequence 2. Although overly simple activities are less detrimental than overly difficult ones since they do not hamper the progression of the learner, they could reveal that the educational challenge was not carefully adjusted. Moreover, too many trivial activities could yield boredom and negate the positive impact of the game on the learner’s engagement.
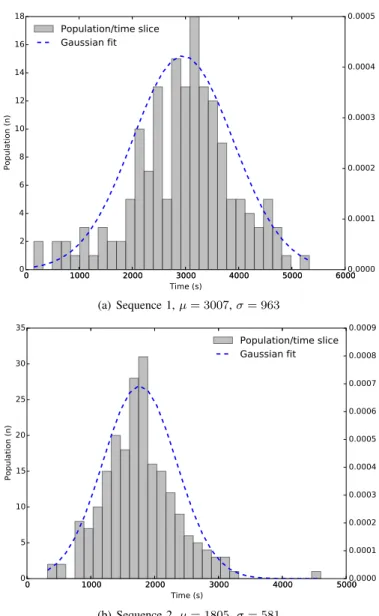
Figure 4 displays the time spent playing sequence 1 (a) and sequence 2 (b). In both charts, the average time was estimated assuming a normal distribution, logically suggested by the shape of the probability density. The mean value for sequence 1 is 50 minutes (3007 seconds) whereas sequence 2 is expected to be completed in 30 minutes (1805 seconds). Both standard deviations represent 32% of their respective mean values, which indicates that the disparity is steady from sequence 1 to sequence 2.
Considering that sequence 2 is more difficult (cf. Figure 3) and contains more playable activities (11 > 9) than sequence 1, this result indicates that the learning curve was overcome quickly. This is a good objective indicator that the game usability is satisfactory. Observations conducted in the classroom support this result as students showed increasing skilfulness and con-fidence during the session.
VII. CONCLUSION
In this article, we have presented the design principles of a learning game for teaching students with the concepts of
0 1000 2000 3000 4000 5000 6000 Time (s) 0 2 4 6 8 10 12 14 16 18 Population (n) 0 1000 2000 3000 4000 5000 60000.0000 0.0001 0.0002 0.0003 0.0004 0.0005 Population/time slice Gaussian fit (a) Sequence 1, µ = 3007, σ = 963 0 1000 2000 3000 4000 5000 Time (s) 0 5 10 15 20 25 30 35 Population (n) 0 1000 2000 3000 4000 50000.0000 0.0001 0.0002 0.0003 0.0004 0.0005 0.0006 0.0007 0.0008 0.0009 Population/time slice Gaussian fit (b) Sequence 2, µ = 1805, σ = 581
Fig. 4. Durations of sequences 1 and 2. Sequence 2 lasted less although the complexity of the scenario was higher.
the cell cycle and the experimental method. We have shown how both survey data and user-traces collected within the game could be used to evaluate the game’s usability, that is to estimate how well the audience familiarises itself with the game. Measuring the game’s utility and acceptability proved more complex than anticipated and will necessitate further investigation and possibly additional data. The game’s utility could be assessed using a standard pre- and post-evaluation. Since the game is integrated into a course, another way could consider gaining access to each student’s final grades and comparing them to their respective data collected within the game. With regard to the game’s acceptability, we think the teacher’s opinions and willingness to integrate the game within their course should be considered first. We trust their opinion towards using learning games to be positive on the grounds of more interactive and personalised teaching (differentiated instruction is a recognised good practice but actually hard to organise) and the capacity to alleviate their work. Regarding students, experience reveals that in the context of the
class-room, their criteria for acceptability is far from what is gen-erally envisioned by game designers. Games’ inherent criteria such as fun and entertainment are less valued by students than its efficacy to facilitate their learning and ultimately help them passing the exam.
This first round of analysis has shown promising results as per the soundness of the project and our future ability to improve the game using data collected from the users. A lot of work remains to be done with the data, as suggests the rich literature on the topics of game analytics and educational data mining. For instance, the time spent per activity show large standard deviations, suggesting that either their duration is totally unpredictable due to a great variability in the profiles or that several subgroups with specific profiles and behaviours could be clustered. Insights could also be gained by comparing the answers provided by the students to the questionnaire to their respective game user-data. so far, confidentiality reasons have prevented us to do so but we expect to solve this legal matter shortly.
Collaboration is another aspect of learning that we could observe in the classroom but failed so far to evidence or measure objectively. The experiment described in this article was organised during regular teaching classes. On the one hand, it allowed us to reach a large population of participants and therefore consolidate the data. On the other hand, we could not prevent the emergence of collaborative behaviours between students. Indeed, although each student was supposed to play on their own computer, we observed peer-to-peer behaviours such as students waiting for a neighbour classmate to catch up or students working with a classmate on the same computer and reporting their result once the activity collaboratively com-pleted, etc. This collaboration, whose immediate and adverse consequence on this study is to distort the data, is nevertheless a positive strategy for progressing and learning and therefore it should not be fought but encouraged and captured as a measurable component of the game’s evaluation.
Finally, on a more technical note, we found that low-level user-traces are cumbersome and that collecting and logging them on the server in real time is a network-intensive process likely to threaten the game’s playability or the collection process itself on low-spec computers. As an immediate future work, we intend to integrate the data required for evaluating the game and the learners as high-level metrics aggregated locally in real time and uploaded into a database.
ACKNOWLEDGEMENTS
Cell Cycle Learn was funded between 2015 and 2016 by the Federal University of Toulouse and the Toulouse IDEX project. It has benefited the pedagogical expertise of the “Service d’Appui `a la P´edagogie” of Toulouse Paul Sabatier University. The authors are grateful to the teachers and educators who took part in the experiments conducted in Paul Sabatier University in Toulouse and Jean-Franc¸ois Champollion University in Albi. The authors also wish to thank the game designers and developers of the game : C.Guimbal, J.Pascalie, N.Henriet, F.Beluguou, R.Merlet and R.Roch. A last special word of thanks to anonymous reviewer #1 for his/her thorough and valuable proofreading.
REFERENCES
[1] D. O. Morgan, The cell cycle: principles of control. Sinauer Associates, Inc., 2007.
[2] D. A. Kolb, Experiential learning: Experience as the source of learning and development. FT press, 2014.
[3] R. R. Hake, “Interactive-engagement versus traditional methods: A six-thousand-student survey of mechanics test data for introductory physics courses,” American journal of Physics, vol. 66, no. 1, pp. 64–74, 1998. [4] “The cell cycle,”
http://www.rigb.org/education/games/human-body/the-cell-cycle, accessed: 2017-04-27.
[5] “Cell craft,” https://biomanbio.com/GamesandLabs/Cellgames/cellcraft.html, accessed: 2017-04-27.
[6] “Inky the squid and the scientific method,” http://playsciencegames.com/inkysm/ , accessed: 2017-04-27. [7] D. Maciuszek, A. Martens, U. Lucke, R. Zender, and T. Keil, “Second
life as a virtual lab environment,” in Synthetic Worlds. Springer, 2014, pp. 165–202.
[8] “Freely available online biology lab resources at onlinelabs.in,” http://onlinelabs.in/biology, accessed: 2017-04-28.
[9] P. Bradley, “The history of simulation in medical education and possible future directions,” Medical education, vol. 40, no. 3, pp. 254–262, 2006. [10] D. Drasdo and M. Loeffler, “Individual-based models to growth and folding in one-layered tissues: intestinal crypts and early development,” Nonlinear Analysis: Theory, Methods & Applications, vol. 47, no. 1, pp. 245–256, 2001.
[11] M. Loeffler and I. Roeder, “Conceptual models to understand tissue stem cell organization,” Current opinion in hematology, vol. 11, no. 2, pp. 81–87, 2004.
[12] J. Galle, M. Loeffler, and D. Drasdo, “Modeling the effect of deregu-lated proliferation and apoptosis on the growth dynamics of epithelial cell populations in vitro,” Biophysical journal, vol. 88, no. 1, pp. 62–75, 2005.
[13] P. Gerlee and A. R. Anderson, “An evolutionary hybrid cellular automa-ton model of solid tumour growth,” Journal of theoretical biology, vol. 246, no. 4, pp. 583–603, 2007.
[14] J. Pascalie, V. Lobjois, H. Luga, B. Ducommun, and Y. Duthen, “Checkpoint orientated cell cycle modeling issues in simulation of synchronized situation,” Artificial Life, vol. 13, pp. 465–472, 2012. [15] J. Pascalie, “Mod´elisation et simulation du cycle cellulaire - application
`a l’oncologie,” Ph.D. dissertation, 2013.
[16] A. Spicher, O. Michel, and J.-L. Giavitto, “Interaction-based simulations for integrative spatial systems biology,” in Understanding the Dynamics of Biological Systems. Springer, 2011, pp. 195–231.
[17] A. Tricot, “Utility, usability and acceptability: an ergonomic approach to the evaluation of external representations for learning,” in 12th Biennial Conference for Research on Learning and Instruction, 2007. [18] W. Westera, R. Nadolski, and H. Hummel, “Serious gaming analytics:
What students´ log files tell us about gaming and learning,” Interna-tional Journal of Serious Games, vol. 1, no. 2, 2014.
[19] C. S. Loh and Y. Sheng, “Measuring the (dis-) similarity between expert and novice behaviors as serious games analytics,” Education and Information Technologies, vol. 20, no. 1, pp. 5–19, 2015.
[20] A. Serrano-Laguna, J. Torrente, P. Moreno-Ger, and B. Fern´andez-´ Manj´on, “Tracing a little for big improvements: Application of learning analytics and videogames for student assessment,” Procedia Computer Science, vol. 15, pp. 203–209, 2012.
[21] J. D. Gobert, M. Sao Pedro, J. Raziuddin, and R. S. Baker, “From log files to assessment metrics: Measuring students’ science inquiry skills using educational data mining,” Journal of the Learning Sciences, vol. 22, no. 4, pp. 521–563, 2013.
[22] M. D. Kickmeier-Rust, C. M. Steiner, and D. Albert, “Apt to adapt: Micro-and macro-level adaptation in educational games,” in Technology-enhanced systems and tools for collaborative learning scaffolding. Springer, 2011, pp. 221–238.
[23] S. G¨obel, F. Mehm, S. Radke, and R. Steinmetz, “80days: Adaptive digital storytelling for digital educational games,” in Proceedings of the 2nd International Workshop on Story-Telling and Educational Games (STEG09), vol. 498, no. 498, 2009.
Overall, you found the software easy to use The application’s graphical layout was comfortable Navigating in the application was easy The instructions were clearly explained and easily understandable The content of this activity was adapted to your level This activity allowed you to use formerly acquired knowledge This activity allowed you to understand concepts from the lesson This activity allowed you to progress The activity could replace practical works The activity could be a good supplement to practical works
Strongly disagree Disagree Agree Strongly agree
Fig. 5. A questionnaire was presented to the student after the training session for them to evaluate the usability and the acceptability of Cell Cycle Learn. The answers (n=279) reveal a warm welcome towards the game. A few negative observations point out some flaws in the content and the limit of the approach which cannot replace an actual experiment.
(a) “Which are the main assets of this game/teaching type” (Pros) (b) “which points of the game should be improved” (Cons)