En vue de l'obtention du
DOCTORAT DE L'UNIVERSITÉ DE TOULOUSE
Délivré par :
Institut National Polytechnique de Toulouse (INP Toulouse)
Discipline ou spécialité :
Génie des Procédés et de l'Environnement
Présentée et soutenue par :
Mme ELVIRA RODRIGUEZ ALONSOle jeudi 3 décembre 2015
Titre :
Unité de recherche : Ecole doctorale :
CONTRIBUTION TO THE STUDY OF FORMATION MECHANISMS OF
CONDENSABLE BY-PRODUCTS FROM TORREFACTION OF VARIOUS
BIOMASSES
Mécanique, Energétique, Génie civil, Procédés (MEGeP) Laboratoire de Génie Chimique (L.G.C.)
Directeur(s) de Thèse : M. CHRISTOPHE GOURDON
Rapporteurs :
M. FREDERIC MARIAS, UNIVERSITE DE PAU ET DES PAYS DE L ADOUR M. YANN ROGAUME, UNIVERSITE DE LORRAINE
Membre(s) du jury :
1 M. FREDERIC MARIAS, UNIVERSITE DE PAU ET DES PAYS DE L ADOUR, Président
2 M. CHRISTOPHE GOURDON, INP TOULOUSE, Membre
2 M. JEAN-MICHEL COMMANDRE, CIRAD MONTPELLIER, Membre
Contribution to the study of formation
mechanisms of condensable by-products
from torrefaction of various biomasses
Contribution à l’étude de mécanismes de
formation des espèces condensables lors
“Those who are courageous, go headlong. They search all opportunities of danger. Their life philosophy is not that of insurance companies. Their life philosophy is that of a mountain climber, a glider, a surfer.
Not only in the outside seas they surf; they surf in their innermost seas. And not only on the outside they climb Alps and Himalayas; they seek inner peaks. Remember one thing: never forget the art of risking – never, never. Always remain capable of risking; wherever you can find an opportunity to risk, never miss it, and you will never be a loser. Risk is the only guarantee for being truly alive.
You need courage to risk; do not forget that courage is not the absence of fear, but rather the total presence of fear, with the courage to face it.”
REMERCIEMENTS
Je tiens à remercier beaucoup de monde pour ces trois années de thèse… :
D’abord, à Capucine Dupont, pour son encadrement, les soirées sushi, les restos, les longues discussions sur les méthodes de travail ;) J’ai découvert une femme très engagée avec son travail, mais aussi très humaine. Merci Capucine ! ¡¡Arriba el PSG!!
A Christophe Gourdon, mon directeur de thèse, pour sa sympathie, son professionnalisme et sa bonne humeur !
A Laurent Heux, pour sa disponibilité, pour les longues discussions et la passion contagieuse pour ce qu’il fait.
Aux collègues du projet INVERTO, du LGC-ENSIACET Toulouse et du CIRAD Montpellier, pour ces bons moments passés ensemble au cours des réunions, avec une ambiance que je voudrais re-retrouver dans mon futur professionnel !
A Denilson Da Silva Perez, pour sa sympathie et son sourire permanent ! Um beijinho !
A ma famille, ma mère, mon père, ma sœur, pour m’avoir donné la vie, le contexte et le soutien qui m’ont amenée à finaliser cette thèse et à être la personne que je suis aujourd’hui.
A mes collègues du Labo Biomasse… : à Seb, pour sa bonne humeur et sa comunicación; à Marc, pour ces discussions dans nos bureaux en face; à Thierry C, pour les discussions spirituelles; à Guillaume B, pour son merveilleux bouquin; à Maguelone et Muriel, pour sa bonne humeur; à Lucia, pour les discussions n’importe où n’importe quand ; à Marion, pour les discussions autour du thé sur les chats et le chocolat; à Joseph, pour les discussions philosophiques qui ont réglé le monde ; à Céline, la pitufina, pour rendre le bureau plus vivant; à Maïté, Maxime et Clément pour ces discussions et conseils sur le théâtre; à Guillaume G, Emanuela, Chams… et beaucoup d’autres que j’ai rencontrés pendant ces trois années et demie au labo, merci pour cette expérience partagée avec vous !
A mes amis, ceux de ma ville d’origine Madrid : Teresa, Lara, Cristina, Lamis, Laura, Silvia, Iñi, Adri, Maria, Cris, Christian… Et à mes amis, ceux qui sont dispersés un peu partout : Raquel, Oscar, Marion, Martino… Merci pour ces bons, mais aussi mauvais moments passés ensemble, et pour que la distance ne soit jamais un obstacle à l’amitié J
-Au groupe d’italiens-espagnols : Xenia, Serena, Angel, Jaione, Leonardo, Raquel… Merci pour les bons moments passés ensemble et que cela continue !! En el mercado o donde haga falta…!!
-A Juan (el traidor), pour son sens de l’humour et sa passion pour la musique, tous les deux très vrais.
-A Véro(nika), pour sa sympathie, sa créativité et son goût pour l’art qui m’ont marquée.
-A Pamela, parce que sa vision du monde et son courage m’ont toujours inspirée. A Nina aussi.
-A Vero(nica), pour son amitié inconditionnelle, son optimisme vital et sa force intérieure. Bon courage pour ta fin de thèse ñaña !
-A Jose, pour son naturel, sa force, sa transparence, son humanité … Mais aussi pour sa patience au téléphone ;)
A mon petit chat Abricot, parce que dans notre histoire je ne sais plus qui a aidé qui… Tu as été mon fidèle compagnon pendant les (longues) heures de rédaction du manuscrit !
A.M.A.G.
“There are essentially two things that will make you wise -- the books you read and the people you meet.” (Jack Canfield)
1
T
ABLE OF CONTENTSTable des matières
TABLE OF CONTENTS ... 1 LIST OF TABLES ... 5 LIST OF FIGURES ... 7 NOMENCLATURE ... 13 INTRODUCTION ... 15 CHAPTER I: CONTEXT ... 21
1. THE FEEDSTOCK: LIGNOCELLULOSIC BIOMASS ... 23
1.1.. DEFINITION ... 23
1.2.. CONSTITUENTS AND STRUCTURE ... 23
1.3.. ELEMENTAL ANALYSIS ... 24 1.4.. CHEMICAL COMPOSITION ... 25 1.4.1. Cellulose ... 25 1.4.2. Hemicellulose ... 28 1.4.3. Lignin ... 30 1.4.4. Extractives ... 33 1.4.5. Ashes ... 34
2. THE PROCESS: TORREFACTION ... 35
2.1.. DEFINITION ... 35
2.2.. PRODUCTS ... 36
2.3.. MASS AND ENERGY BALANCES ... 37
2.1.. REACTIVITY OF BIOMASS ... 38
2.2.. PROPERTIES OF BIOMASS... 39
2.3.. TECHNOLOGIES ... 39
3. THE FRAMEWORK: INVERTO PROJECT... 41
4. OBJECTIVES ... 42
CHAPTER II: STATE-OF-THE-ART ... 43
1. INTRODUCTION ... 45
2. CHEMICAL EVOLUTION OF THE SOLID ... 45
2.1.. WHAT DOES CHEMICAL EVOLUTION OF THE SOLID STAND FOR? ... 45
2.2.. CHARACTERIZATION TECHNIQUES ... 45
2
2.2.1. Comparison of characterization techniques ... 46
2.2.1. Conclusion ... 51
2.3.. 13C SOLID-STATE NMR RESULTS DURING TORREFACTION ... 51
3. PRODUCTION OF GASEOUS SPECIES ... 55
3.1.. ANALYSIS TECHNIQUES ... 55
3.1.1. Challenges in analysis of the gaseous phase obtained during biomass torrefaction at lab-scale ... 55
3.1.2. Comparison of analysis techniques ... 55
3.1.3. Conclusion ... 59
3.2.. GC-MS RESULTS DURING TORREFACTION ... 59
4. MODELLING OF TORREFACTION KINETICS ... 65
4.1.. TYPES OF MODELS ... 65
4.2.. MODELS OF SOLID DECOMPOSITION AND GASEOUS SPECIES FORMATION ... 66
4.2.1. Chemical species predicted ... 66
4.2.2. Approach ... 68
4.2.3. Experimental validation... 71
4.3.. CONCLUSION ... 72
CHAPTER III: MATERIALS AND METHODS ... 75
1. BIOMASSES ... 77
2. COUPLING OF TGA-GC-MS ... 82
2.1.. THERMO-GRAVIMETRIC ANALYSIS (TGA) ... 83
2.1.1. Device description ... 83 2.1.2. Experimental procedure... 83 2.1.3. Repeatability experiments ... 85 2.2.. LOOPS STORAGE ... 86 2.2.1. Device description ... 86 2.2.2. Experimental procedure... 87 2.3.. GAS CHROMATOGRAPH (GC)... 89 2.3.1. Device description ... 89 2.3.2. Experimental procedure... 89 2.4.. MASS SPECTROMETER (MS) ... 90 2.4.1. Device description ... 90 2.4.2. Experimental procedure... 90
2.4.3. TGA-GC-MS data treatment ... 91
3. 13C CP/MAS SOLID-STATE NMR ... 95
3.1.. DEVICE DESCRIPTION ... 95
3
3.3.. SOLID-STATE NMR DATA TREATMENT ... 97
CHAPTER IV: EXPERIMENTAL RESULTS ... 99
1. INTRODUCTION ... 101
2. MASS LOSS OF SOLID ... 101
3. FORMATION OF CONDENSABLE SPECIES ... 108
3.1.. QUALITATIVE RESULTS ... 108 3.2.. QUANTITATIVE RESULTS ... 116 3.2.1. Hydroxyacetone ... 116 3.2.2. Acetic acid ... 119 3.2.3. 2-Furanmethanol ... 122 3.2.4. Eugenol ... 124 3.2.5. Isoeugenol ... 126
3.3.. SEMI-QUANTITATIVE RESULTS ... 130
3.3.1. Glycolaldehyde ... 130
3.3.2. Formic acid ... 131
3.3.3. Furfural... 133
3.3.4. 2-Methoxy-4-vinylphenol... 135
3.3.5. Vanillin ... 137
4. CHEMICAL EVOLUTION OF SOLID ... 141
4.1.. QUALITATIVE RESULTS ... 141
4.2.. QUANTITATIVE RESULTS ... 145
4.2.1. Aromatics in lignin ... 145
4.2.2. C1 of cellulose ... 147
4.2.3. C4 and C6 of crystalline cellulose ... 148
4.2.4. C4 and C6 of amorphous cellulose ... 150
4.2.5. Methoxyl groups in lignin ... 152
4.2.6. Acetyl groups in hemicellulose ... 154
5. SYNERGY OF RESULTS ... 157
5.1.. MASS LOSS AND CHEMICAL EVOLUTION OF THE SOLID ... 157
5.2.. PRODUCTION OF GASEOUS SPECIES AND CHEMICAL EVOLUTION OF THE SOLID ... 158
6. CONCLUSION ... 160 CHAPTER V: MODELLING ... 163 1. INTRODUCTION ... 165 2. APPROACH ... 165 3. PRODUCTS CONSIDERED ... 167 4. REACTION MECHANISMS ... 170 4.1.. CELLULOSE REACTIVITY ... 171
4
4.1.1. Decrystallization ... 173
4.1.2. Dehydration ... 173
4.1.3. Transglycosylation ... 175
4.1.4. Depolymerization ... 176
4.1.5. Fragmentation to form glycolaldehyde ... 177
4.1.6. Fragmentation to form hydroxyacetone ... 177
4.2.. HEMICELLULOSE REACTIVITY... 178
4.2.1. Dehydration of C6 and C5 sugars ... 180
4.2.2. Depolymerization of C6 and C5 sugars ... 180
4.2.3. Fragmentation of acetyl groups ... 181
4.2.4. Fragmentation of methoxyl groups ... 181
4.2.5. Fragmentation of side chains to form formic acid ... 182
4.2.6. Fragmentation of C6 and C5 sugars to form glycolaldehyde ... 183
4.2.7. Fragmentation of carboxyl groups in C5 sugars ... 183
4.2.8. Fragmentation of carbonyl groups in C6 sugars ... 183
4.3.. LIGNIN REACTIVITY ... 184
4.3.1. Dehydration of alkyl chains ... 186
4.3.2. Fragmentation of Cβ-Cγ bonds ... 186
4.3.3. Formation of eugenol ... 186
4.3.4. Formation of 2-methoxy-4-vinylphenol ... 187
4.3.5. Formation of vanillin ... 188
5. CONCLUSION ... 189
CHAPTER VI: CONCLUSIONS AND PERSPECTIVES ... 191
5
L
IST OF TABLESTable 1. Proximate analysis of different biomasses (Castellano et al., 2015). ... 25
Table 2. Comparison of properties between raw and torrefied wood (Kiel, 2012). ... 39
Table 3. Main technologies of torrefaction (Casajus et al., 2012; Nocquet, 2012). ... 40
Table 4. Characterization techniques of biomass solid phase during torrefaction. ... 47
Table 5. Quantitative characterization through 13C DP/MAS solid-state NMR of the raw and torrefied biomass (Park et al., 2013b). ... 54
Table 6. Analytical techniques used to detect condensable species during biomass torrefaction. . 56
Table 7. Identification of condensable species produced during biomass torrefaction by GC-MS. . 61
Table 8. Mean yields (mg/g biomass) of the main condensable species produced in ash-wood torrefaction at different temperatures (Lê Thành et al., 2015). ... 62
Table 9. Comparison of chemical species predicted by models. ... 67
Table 10. Comparison of models which predict solid decomposition and formation of gaseous species during biomass torrefaction. ... 74
Table 11. Biomasses chemical properties and elemental analysis. ... 79
Table 12. Sugars composition in hemicellulose analysis. ... 80
Table 13. Helium properties in Chromatostock loops. ... 91
Table 14. Signal assignments for solid-state NMR spectra of biomasses. ... 96
Table 15. Condensable species produced during torrefaction of pine. ... 112
Table 16. Condensable species produced during torrefaction of ash-wood. ... 113
Table 17. Condensable species produced during torrefaction of miscanthus. ... 114
Table 18. Condensable species produced during torrefaction of wheat straw. ... 115
Table 19. Proportion of hydroxyacetone in the overall formation at each temperature. ... 118
Table 20. Comparative formation of hydroxyacetone (mg/g initial biomass). ... 119
Table 21. Proportion of acetic acid in the overall formation at each temperature. ... 121
Table 22. Comparative formation of acetic acid (mg/g initial biomass). ... 121
Table 23. Proportion of 2-furanmethanol in the overall formation at each temperature. ... 123
Table 24. Comparative formation of 2-furanmethanol (mg/g initial biomass). ... 123
Table 25. Proportion of eugenol in the overall formation at each temperature. ... 126
Table 26. Proportion of isoeugenol in the overall formation at each temperature. ... 128
Table 27. Comparative formation of isoeugenol (mg/g initial biomass). ... 128
Table 28. Synthesis of the quantitative analysis of condensable species formation. ... 129
Table 29. Proportion of glycolaldehyde in the overall formation at each temperature. ... 131
Table 30. Proportion of formic acid in the overall formation at each temperature. ... 133
Table 31. Proportion of furfural in the overall formation at each temperature. ... 135
Table 32. Proportion of 2-methoxy-4-vinylphenol in the overall formation at each temperature. .. 137
Table 33. Proportion of vanillin in the overall formation at each temperature. ... 139
6
Table 35. Crystallinity index of the four biomasses. ... 147
Table 36. Synthesis of quantitative characterization of the solid phase. ... 156
Table 37. Synthesis of original experimental results from TGA-GC-MS and solid-state NMR. ... 162
Table 38. Reactants in torrefaction mechanisms. ... 166
Table 39. Gaseous species considered as products in reaction mechanisms. ... 168
Table 40. Gaseous species considered as products in reaction mechanisms (continued). ... 169
Table 41. Reaction mechanisms of cellulose degradation. ... 172
Table 42. Reaction mechanisms of hemicellulose degradation. ... 179
7
L
IST OF FIGURESFig. 1. Global energy demand in 2011 (left) (IEA, 2013) and detail of biomass feedstock potentially
available (right) (IEA, 2012). ... 17
Fig. 2. Principal processes, intermediate energy carriers and final products in thermochemical conversion of biomass (McKendry, 2002). ... 18
Fig. 3. Lignin-polysaccharide network in lignocellulosic biomass (Tsubaki and Azuma, 2011). ... 24
Fig. 4. Representation of the linear chain of cellulose (Vermerris and Abril, 2015). ... 26
Fig. 5. Cellulose content for several woody and non-woody biomasses (Da Silva Perez et al., 2015). ... 26
Fig. 6. Cellulose structure at different levels of aggregation (website of JRS, J. RETTENMAIER & SÖHNE group). ... 27
Fig. 7. Cellulose allomorphs (Kaplan, 1998). ... 28
Fig. 8. Structure of hemicellulose (Ochoa-Villarreal et al., 2012). ... 28
Fig. 9. Main sugar monomers in hemicellulose (Hansen and Plackett, 2008). ... 29
Fig. 10. Hemicellulose content for several woody and non-woody biomasses (Da Silva Perez et al., 2015). ... 29
Fig. 11. Model of lignin structure: in blue, syringyl (S unit); in green, guaiacyl (G unit); in red, p-hydroxyphenol (H unit) (Lupoi et al., 2015). ... 31
Fig. 12. Lignin monomers: in blue, sinapyl alcohol; in green, coniferyl alcohol; in red, p-coumaryl alcohol (Lupoi et al., 2015). ... 32
Fig. 13. Lignin content for several woody and non-woody biomasses (Da Silva Perez et al., 2015). ... 32
Fig. 14. Common monoterpenoids in biomass: (1) β-myrcene, (2) limonene, (3) β-phellandrene, (4) α-pinene, (5) β-pinene, (6) 3-carene, (7) borneol, (8) bornyl acetate, and (9) β-thujaplicin (Sjostrom, 1993). ... 33
Fig. 15. Extractives content for several woody and non-woody biomasses (Da Silva Perez et al., 2015). ... 34
Fig. 16. Ashes content for several woody and non-woody biomasses (Da Silva Perez et al., 2015). ... 35
Fig. 17. Evolution of an ash-wood sample during torrefaction. From left to right: raw biomass, and biomass torrefied at 250, 280 and 300°C under the same conditions (Lê Thành et al., 2015). 36 Fig. 18. Mass balance of products during torrefaction of several biomasses (Commandré and Leboeuf, 2015). ... 37
Fig. 19. Typical mass and energy balances of biomass torrefaction (Bergman et al., 2005). ... 38
Fig. 20. NIRS spectra of raw and torrefied beech at 220, 250 and 280°C for 1h (Rousset et al., 2011). ... 49
8
Fig. 22. 13C CP/MAS solid-state NMR spectra of raw and torrefied samples of beech wood (Melkior
et al., 2012). ... 50
Fig. 23. Mass loss, gaseous species produced and reaction mechanisms of beech torrefaction versus temperature (Melkior et al., 2012). ... 54
Fig. 24. GC-MS chromatogram of the gaseous phase produced during torrefaction of poplar sawdust at 230°C for 15 min (Candelier et al., 2011). ... 58
Fig. 25. Relative intensity obtained by GC-MS analysis of the major molecules produced during torrefaction of aspen for 90 min (Klinger et al., 2013). ... 58
Fig. 26. Mass balance of the main condensable species obtained after torrefaction of four biomasses at 250°C for 45 min (Commandré and Leboeuf, 2015). ... 64
Fig. 27. Torrefaction scheme adapted from Ranzi et al. (2008) (Anca-Couce et al., 2014). ... 69
Fig. 28. Kinetic scheme of biomass torrefaction proposed by Di Blasi and Lanzetta (1997). ... 70
Fig. 29. Principle of the kinetic model developed for biomass torrefaction by Nocquet et al. (2014b). ... 71
Fig. 30. The four biomasses: pine chips on the top left; ash-wood chips on the top right; miscanthus pellets on the bottom left; and wheat straw pellets on the bottom right. ... 78
Fig. 31. TGA-GC-MS device. ... 82
Fig. 32. TGA-GC-MS scheme. ... 82
Fig. 33. TGA scheme. ... 83
Fig. 34. Three-staged crucible for TGA torrefaction. ... 84
Fig. 35. Compared evolution of mass loss for ash-wood samples in a three-staged and a simple crucible. ... 86
Fig. 36. Chromatostock loops storage scheme. ... 87
Fig. 37. Sampling temperatures in TGA-GC-MS experiments. ... 88
Fig. 38. Temperature profile in the GC column. ... 90
Fig. 39. Production of isoeugenol during torrefaction of ash-wood. ... 93
Fig. 40. Production of 2-methoxy-4-vinylphenol during torrefaction of pine. ... 94
Fig. 41. Solid-state NMR device. ... 95
Fig. 42. Mass loss evolution of the four biomasses during dynamic torrefaction. ... 102
Fig. 43. Reaction rate evolution of the four biomasses during dynamic torrefaction. ... 103
Fig. 44 Mass loss evolution of the four biomasses during isothermal torrefaction. ... 105
Fig. 45. Reaction rate evolution of the four biomasses during isothermal torrefaction. ... 106
Fig. 46. Mass loss of several biomasses during torrefaction under isothermal conditions (T = 280°C, t = 2h, heating rate = 30°C/min) (Dupont et al., 2011). ... 108
Fig. 47. Production of hydroxyacetone during torrefaction. ... 117
Fig. 48. Production of acetic acid during torrefaction. ... 120
Fig. 49. Production of 2-furanmethanol during torrefaction. ... 122
Fig. 50. Production of eugenol during torrefaction. ... 125
Fig. 51. Production of isoeugenol during torrefaction. ... 127
9
Fig. 53. Production of formic acid during torrefaction. ... 132
Fig. 54. Production of furfural during torrefaction. ... 134
Fig. 55. Production of 2-methoxy-4-vinylphenol during torrefaction. ... 136
Fig. 56. Production of vanillin during torrefaction. ... 138
Fig. 57. Solid-state NMR spectra of pine samples: raw and torrefied at 200, 220, 240, 260, 280 and-300°C. ... 142
Fig. 58. Solid-state NMR spectra of ash-wood samples: raw and torrefied at 200, 220, 240, 260, 280 and-300°C. ... 143
Fig. 59. Solid-state NMR spectra of miscanthus samples: raw and torrefied at 200, 220, 240, 260, 280 and-300°C. ... 144
Fig. 60. Solid-state NMR spectra of wheat straw samples: raw and torrefied at 200, 220, 240, 260, 280 and-300°C. ... 145
Fig. 61. Evolution of the proportion of aromatics in lignin during torrefaction. ... 146
Fig. 62. Evolution of the proportion of C1 of cellulose during torrefaction. ... 148
Fig. 63. Evolution of the proportion of C4 of crystalline cellulose during torrefaction. ... 149
Fig. 64. Evolution of the proportion of C6 of crystalline cellulose during torrefaction. ... 149
Fig. 65. Evolution of the proportion of C4 of amorphous cellulose during torrefaction. ... 151
Fig. 66. Evolution of the proportion of C6 of amorphous cellulose during torrefaction. ... 152
Fig. 67. Evolution of the proportion of methoxyl groups in lignin during torrefaction. ... 153
Fig. 68. Evolution of the proportion of acetyl groups in hemicellulose during torrefaction. ... 155
Fig. 69. TGA-GC-MS and solid-state NMR synergy for pine. ... 159
Fig. 70. TGA-GC-MS and solid-state NMR synergy for ash-wood. ... 159
Fig. 71. TGA-GC-MS and solid-state NMR synergy for wheat straw. ... 160
Fig. 72. Van Krevelen diagram of chars. ... 171
Fig. 73. Intra-ring dehydration of cellulose: (a) enol form of anhydrocellulose, (b) keto form of anhydrocellulose, (c) transglycosylation to form a levoglucosan chain-end, (d) hydroxyl glucosidic chain-end, (e) unsaturation on the glucosidic chain-end, (f) elimination of water on C6, (g) formation of a vinylene group (Scheirs et al., 2001). ... 175
11 Abstract: The objective of the present work is to better understand chemical evolution of both solid and gaseous phases during torrefaction of various biomasses. Torrefaction experiments were carried out with a dynamic profile of temperatures between 200 and 300°C, under inert atmosphere, for pine, ash-wood, miscanthus and wheat straw. Mass loss and formation of condensable species were analyzed by TGA-GC-MS, and chemical evolution of solid phase was characterized by 13C CP/MAS solid-state NMR. Thirty
condensable species could be detected; a half of these species were formed during the whole temperature range, and a third were formed by all biomass types. The main phenomena that occurred in solid phase were found to be decrystallization of cellulose, severe degradation of hemicellulose, devolatilization of acetyl groups, conservation of methoxyl groups and charring. It was also found that mass loss and chemical evolution of solid were not directly correlated for different biomasses. Based on the experimental results, a conceptual model was developed to describe biomass degradation during torrefaction. Thirty reactions were determined for the three major macromolecular constituents, namely cellulose, hemicellulose – represented by C5 and C6 sugars – and lignin – represented by H, G and S units. The main innovations of this model are in the detailed approach of hemicellulose and lignin compositions, as well as in the prediction of sixteen condensable and five permanent species, and six forms of solid char, through chemically meaningful and stoichiometrically valid reactions.
Keywords: biomass, torrefaction, reaction mechanisms, Thermogravimetric Analysis–Gas Chromatography–Mass Spectrometry, solid-state Nuclear Magnetic Resonance
Résumé : L’objectif des travaux est de mieux comprendre durant la torréfaction de différentes biomasses l’évolution chimique à la fois des phases solide et gaz. Des expériences de torréfaction ont été menées selon un profil de température dynamique entre 200 et 300°C, sous atmosphère inerte, sur du pin, du frêne, du miscanthus et de la paille de blé. La perte de masse et la formation des espèces condensables ont été analysées par ATG-GCMS, et l’évolution chimique de la phase solide par RMN du solide
13C CP/MAS. Trente espèces condensables ont été détectées ; la moitié a été formée dans
l’ensemble de la gamme de température explorée et un tiers l’a été par toutes les biomasses. Les principaux phénomènes qui semblent associés à la dégradation du solide sont la décristallisation de la cellulose, une sévère dégradation de l’hémicellulose, la dévolatilisation des groupes acétyles, la conservation des groupes méthoxys et la formation d’un résidu solide. Il a été par ailleurs montré que perte de masse et évolution chimique du solide n’étaient pas directement corrélées pour différentes biomasses. A partir de ces résultats expérimentaux, un modèle conceptuel a été développé pour décrire la dégradation de la biomasse. Trente réactions ont été associées aux trois constituants macromoléculaires principaux que sont la cellulose, l’hémicellulose et la lignine, respectivement représentées par deux sucres en C5 et C6 et par trois unités de type H, G et S. Ce modèle présente l’originalité de s’appuyer sur une description détaillée de ces deux derniers constituants et de prévoir la formation de seize espèces condensables, cinq gaz permanents et six formes de char solide, grâce à des réactions ayant un sens chimique et équilibrées d’un point de vue stœchiométrique.
Mots-clés : biomasse, torréfaction, mécanismes réactionnels, Analyse
Thermogravimétrique-Chromatographie Phase Gaz–Spectrométrie de Masse, Résonance Magnétique Nucléaire solide
13
N
OMENCLATUREASE Accelerated Solvent Extractor
Bi Biot number no unit
CP/MAS Cross-Polarization/Magic Angle Spinning
DGP 1,4:3,6-dianhydro-α-D-glucopyranose EI Electron Ionization G gram GC Gas Chromatograph GJ gigajoule H hour
HHV High Heating Value MJ/kg
INVERTO INnovation in VEgetal chemistRy by TOrrefaction
Kg kilogram L liter LAC 3,6-dioxabicyclo[3.2.1]octan-2-one,1-hydroxy-,(1R) m3 cubic meter mg milligram min minute mL milliliter MJ megajoule MS Mass Spectrometer
NMR Nuclear Magnetic Resonance
ppm part per million
Py’ extern Pyrolysis number no unit
Re Reynolds number no unit
S second
T tone
T temperature °C
TGA Thermo-Gravimetric Analysis
W weight of biomass % (mass)
wmf weight moisture-free of biomass % (mass)
wmfh weight moisture-free of hemicellulose % (mass)
°C degree Celsius
µg microgram
15
17 The global energy demand and the related greenhouse gas emissions due to the use of fossil energy sources, keep on increasing worldwide. This context encourages the development of renewable sources of energy, such as solar, wind, biomass, tidal and geothermal. These renewable sources constitute an alternative to the fossil sources, such as crude oil, natural gas and coal. Among the renewable options, biomass is the only source which is able to produce both energy and chemicals (van der Stelt et al., 2011). Today, renewable energy represents 13% of the global energy consumption, in which energy biomass sources – also called bioenergy – represent 10% (see Fig. 1) (Ho et al., 2014). In the future, various biomass feedstock are expected to contribute to this bioenergy (see Fig.1), with an increasing part constituted of residues from forestry and agriculture as well as of lignocellulosic crops.
Fig. 1. Global energy demand in 2011 (left) (IEA, 2013) and detail of biomass feedstock potentially available (right) (IEA, 2012).
Bioenergy can be mainly obtained through two routes: thermochemical and biochemical conversion. Generally speaking, thermochemical route relies on the heating of biomass, while biochemical route involves the use of bacteria, microorganisms and enzymes. Thermochemical conversion seems to be a promising route complementary to biochemical route, as it can convert all biomass constituents, whereas biochemical route focuses on carbohydrates.
18 Thermochemical conversion of dry biomass mainly includes combustion, gasification and pyrolysis processes. They basically differentiate in the atmosphere applied, as combustion is carried out under excess of air, gasification under steam, CO2 or
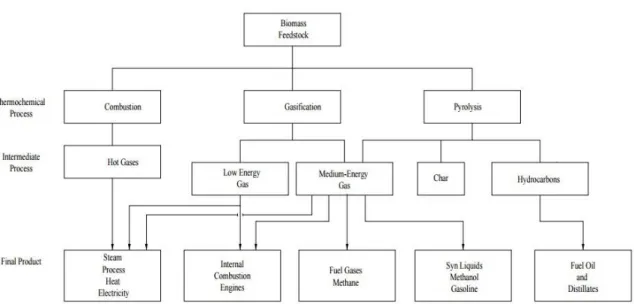
default of air and pyrolysis in the absence of air. Furthermore, the three processes are associated to different final “products”: combustion only leads to heat and power, while gasification and pyrolysis also offer routes to obtain chemicals and fuels. Fig. 2 shows a scheme of the three thermochemical conversion processes, as well as the intermediate and final products.
Fig. 2. Principal processes, intermediate energy carriers and final products in thermochemical conversion of biomass (McKendry, 2002).
In view of biomass thermochemical conversion industrial implementation, some of the physical and chemical properties of biomass can turn out to be problematic, in particular its high oxygen content, its high moisture content, its low density, its fibrous structure and its heterogeneous composition among tissues. Indeed, these properties decrease process efficiency and raise both technical and economic difficulties at the stages of collection, storage and transportation. Several pretreatment methods have been developed to counterbalance these disadvantages, and can be classified as thermal (e.g. torrefaction, drying) or mechanical (e.g. grinding, pelletizing). Under the
19 pretreatment operating conditions (temperature, pressure…), significant structural and chemical changes occur in biomass (Chen et al., 2015; Sierra et al., 2008; van der Stelt et al., 2011).
The present work focuses on the understanding of the pretreatment by torrefaction. Torrefaction is a mild thermal treatment whose severity is intermediate between drying and pyrolysis. It is carried out at temperatures within the interval of 200-300°C, under atmospheric pressure and in absence of oxygen. Torrefaction gives rise to a solid product, which is the torrefied biomass, and gaseous by-products, which are condensable species, such as water and acetic acid, and non-condensable species, mainly carbon dioxide and carbon monoxide. During torrefaction, the torrefied solid acquires mechanical and energy properties between coal and raw biomass, e.g. brown color, lower H/C and O/C ratios, hydrophobicity, increased energy density as well as improved grindability and flowability. These properties enhance biomass suitability for further combustion or gasification processes (Fisher et al., 2012). The torrefaction condensable by-products have been traditionally either burnt to obtain energy or removed as waste but may also be in a more innovative way chemically recovered as high added value green molecules, as tested in the frame of the collaborative French National Research Agency project associated to this PhD thesis, namely the INVERTO project.
Thereby, the objective of the present work is to contribute to better understand the chemical evolution of the solid product and the gaseous by-products formed during biomass torrefaction.
The manuscript is divided into six chapters, which are presented hereafter:
Chapter I exposes the context of this work and describes the feedstock, the process, the framework and the objectives of the present work;
Chapter II discusses the state-of-the-art on chemical evolution of the solid phase, production of gaseous species and modelling of biomass torrefaction;
Chapter III refers to materials and methods employed in the present work, and describes biomasses investigated, as well as TGA-GC-MS and 13C CP/MAS
20
Chapter IV presents the experimental results from the present work, including mass loss of the solid, formation of condensable species, characterization of the solid, and the synergy potential between these results;
Chapter V describes a conceptual model of biomass torrefaction founded on the experimental results obtained in the present work and on literature;
Chapter VI draws out general conclusions from the study in relation with the objectives defined in Chapter I. To end, perspectives for future work both in short and long-terms are proposed.
21
23 1. THE FEEDSTOCK: LIGNOCELLULOSIC BIOMASS
1.1. DEFINITION
The term “lignocellulosic biomass” refers to all vegetal matter existing on Earth. This includes wood, plants, agricultural products and vegetal wastes.
1.2. CONSTITUENTS AND STRUCTURE
Lignocellulosic biomass is mainly constituted by cellulose, hemicellulose and lignin. Crystalline cellulose fibers constitute the core of the complex lignocellulosic structure. Amorphous cellulose and hemicellulose are positioned among the fibrils of crystalline cellulose, and oriented in the same direction. Lignin plays a structural role by forming a matrix in which cellulose and hemicellulose are inserted (see Fig. 3) (Faulon et al., 1994; Sjostrom, 1993).
Lignocellulosic biomass also contains a minor proportion of water, extractives and ashes, which do not exercise a significant structural role (Raven et al., 1992).
24 Fig. 3. Lignin-polysaccharide network in lignocellulosic biomass (Tsubaki and Azuma,
2011).
1.3. ELEMENTAL ANALYSIS
Elemental composition of biomass includes carbon, hydrogen and oxygen, which are major elements in biomass, as well as nitrogen, chlorine and sulfur, which are minor elements in biomass.
The work of Da Silva Perez et al. (2015) has investigated the elemental composition of several woody biomasses – beech, spruce, poplar and eucalyptus – and non-woody biomasses – wheat straw, triticale, fescue, miscanthus and switchgrass. Results have shown that the contents in carbon and hydrogen are very similar for all the biomasses. Regarding oxygen content, non-woody biomasses contain slightly less oxygen than woody biomasses. This is mainly due to differences in ash content. However, oxygen is calculated by difference, therefore this conclusion has to be taken with caution. The contents in nitrogen and chlorine are higher for non-woody biomasses than for woody biomasses. Chlorine content is higher for agricultural co-products (0.32%w), and wheat
25 straw, which is also an agricultural co-product, presents the highest sulfur content (0.16%w).
1.4. CHEMICAL COMPOSITION
The chemical composition of lignocellulosic biomass strongly depends on its source. Cellulose presents the same elemental composition in every biomass, whereas the compositions of hemicellulose and lignin vary among biomasses (Sjostrom, 1993). The proportions of the main biomass constituents vary significantly as a function of biomass species. These variations are significant for all constituents, except cellulose (see Table 1).
Table 1. Proximate analysis of different biomasses (Castellano et al., 2015). Biomass Unit Cellulose Hemicellulose Lignin Extractives Ashes
Pine % 23.56 44.16 28.46 6.00 0.96 Eucalyptus 19.15 34.33 30.31 6.85 2.83 Oak 21.94 36.44 24.44 5.32 3.10 Vine shoots 19.66 32.38 24.87 9.24 4.11 Poplar 1 20.33 42.65 25.19 4.62 2.79 Poplar 2 20.81 37.62 27.48 5.17 1.73 Oats 24.53 26.86 10.59 30.87 6.12 Triticale 20.86 34.75 11.07 29.39 6.88 Rice 24.08 37.09 13.82 13.98 12.35 1.4.1. Cellulose
Cellulose is a homopolysaccharide composed of D-glucopyranose monomers linked by β(1→4)-glycosidic bonds, with cellobiose as the repeating unit (see Fig. 4). The chemical formula of cellulose can be represented by (C6H10O5)n. The nature of the
glycosidic bonds between glucose monomers leads to an arrangement in linear chains (Harmsen et al., 2010). In addition, since hydroxyl groups are distributed on both sides of the glucose chains, cellulose has a strong tendency to form intramolecular and intermolecular hydrogen bonds (Sjostrom, 1993).
26 Fig. 4. Representation of the linear chain of cellulose (Vermerris and Abril, 2015).
Cellulose proportion in woody biomass is, in average, higher than in non-woody biomass. In the work of Da Silva Perez et al. (2015), cellulose content in woody biomasses tested ranges between 39 and 50%w, whereas for non-woody biomasses cellulose content is lower, between 27 and 30%w (see Fig. 5).
Fig. 5. Cellulose content for several woody and non-woody biomasses (Da Silva Perez et al., 2015).
Regarding cellulose structure, bundles of cellulose molecules aggregate to form micro-fibrils. Then, micro-fibrils build up macro-fibrils and, finally, they constitute fibers (see Fig. 6). As a consequence of this fibrous structure, cellulose has a high tensile strength and is insoluble in most solvents (Sjostrom, 1993). Besides, many properties of cellulose depend on its degree of polymerization, that is to say, the number of glucose
27 monomers which composes one cellulose polymer. The cellulose degree of polymerization depends on biomass species. It can extend to 17000, although it commonly ranges from 3000 to 10000 monomers (Kirk-Otmer, 2001).
Fig. 6. Cellulose structure at different levels of aggregation (website of JRS, J. RETTENMAIER & SÖHNE group).
Inside the various fibrils of the cellulose macro-polymer, highly ordered regions – crystalline regions – alternate with less ordered ones – amorphous regions. Within crystalline regions, four different crystalline arrangements, the so-called allomorphs, have been identified (see Fig. 7):
Cellulose I is the most abundant form found in nature, although its structure is not completely known due to its high complexity. The structure of cellulose I is a mixture of two crystalline forms: celluloses Iα and Iβ. The proportions of
these celluloses vary as a function of biomass species;
Cellulose II can be obtained either by mercerization, which is an alkali treatment, or by regeneration, consisting of solubilization followed by recrystallization;
Celluloses IIII and IIIII can be formed from celluloses I and II, respectively, by
treatment with liquid ammonia, and the reaction is reversible;
Celluloses IVI and IVII can be obtained by heating celluloses IIII and IIIII,
28 Fig. 7. Cellulose allomorphs (Kaplan, 1998).
1.4.2. Hemicellulose
Hemicellulose is a polymeric heteropolysaccharide composed of different sugar monomers, in contrast to cellulose (see Fig. 8). The average chemical formula of hemicellulose could be represented by (C5H8O4)n (Chen and Kuo, 2011).
Fig. 8. Structure of hemicellulose (Ochoa-Villarreal et al., 2012).
Hemicellulose mainly contain the monomers D-glucose, D-mannose, D-galactose, D-xylose, L-arabinose, as well as small proportions of L-rhamnose, D-glucuronic acid, 4-O-methyl-D-glucuronic acid and D-galacturonic acid (see Fig. 9 for some examples). The presence of these monomers and their proportions in hemicellulose strongly depend on
29 biomass species (Sjostrom, 1993). In softwood hemicellulose, the main sugar structures are galactoglucomannan, arabinoglucuronoxylan and arabinogalactan. In hardwood hemicellulose, the main sugar structures are glucuronoxylan and glucomannan.
Fig. 9. Main sugar monomers in hemicellulose (Hansen and Plackett, 2008).
Hemicellulose proportion in non-woody biomasses is higher than in woody biomasses. In the work of Da Silva Perez et al. (2015), hemicellulose content in woody biomasses tested is of 22-33%w, whereas for non-woody biomasses hemicellulose content is of 31-38%w (see Fig. 10).
Fig. 10. Hemicellulose content for several woody and non-woody biomasses (Da Silva Perez et al., 2015).
30 The structure of hemicellulose is amorphous, mainly due to the highly branched structure and the presence of acetyl groups linked to the polymer. In contrast to cellulose, which is a long polymer, the degree of polymerization in hemicellulose reaches a maximum of 200 monomers. Hence hemicellulose is a relatively short polymer (Harmsen et al., 2010).
1.4.3. Lignin
Lignin is a heteropolymer with a very complex structure. Today, this structure is still not fully understood, yet some models have been proposed (see Fig. 11 for an example). The average chemical formula of lignin could be represented by [C9H10O3∙(OCH3)0.9-1.7]n (Chen and Kuo, 2011).
31 Fig. 11. Model of lignin structure: in blue, syringyl (S unit); in green, guaiacyl (G unit); in
red, p-hydroxyphenol (H unit) (Lupoi et al., 2015).
Lignin is mainly composed of three phenylpropane monomers: sinapyl alcohol, coniferyl alcohol and p-coumaryl alcohol. Their respective phenylpropanoid units are: syringyl – usually represented as S unit –, guaiacyl – represented as G unit – and p-hydroxyphenol – represented as H unit. These three structures are constituted by the same phenylpropanoid skeleton, but they possess different degrees of oxygen-substitution on the phenyl ring. The H-unit consists of a 4-hydroxyphenyl ring, the G-unit has one hydroxyl group and one methoxyl group, and the S-unit has two methoxyl groups and one hydroxyl group (Banoub et al., 2015) (see Fig. 12). Three types of ether bonds link lignin units: β-aryl, diaryl and glyceraldehyde aryl (Tsubaki and Azuma, 2011).
32 Fig. 12. Lignin monomers: in blue, sinapyl alcohol; in green, coniferyl alcohol; in red,
p-coumaryl alcohol (Lupoi et al., 2015).
Lignin composition changes depending on biomass species, like hemicellulose. Softwood lignin mainly contains G units and to a less extent H units, while hardwood lignin is mainly composed of S units, and to a less extent of G units. In cereal crops, lignin is constituted by equivalent amounts of G and S units, whereas perennial crops are mostly constituted of H units (Banoub et al., 2015; Ragauskas, A.J., 2008).
Lignin proportion in woody biomass is, in average, higher than in non-woody biomass. In the work of Da Silva Perez et al. (2015), lignin content in woody biomasses tested is of 20-29%w, whereas for non-woody biomasses lignin content is of 17-23%w (see Fig. 13).
Fig. 13. Lignin content for several woody and non-woody biomasses (Da Silva Perez et al., 2015).
33 The measurement of lignin polymerization degree presents a high complexity, since lignin tends to fragment during its extraction from biomass structure. Bibliographic works have reported values of polymerization degree for lignin between 1000 and 20000 monomers (Banoub et al., 2015).
1.4.4. Extractives
Lignocellulosic biomass contains a small and variable amount of non-structural constituents which can be extracted by solvents, the so-called extractives (see Fig. 14 for some examples). The extractives fraction includes small molecules, like lipids, phenolic compounds, terpenoids, fatty acids, resin acids, steryl esters, sterol and waxes, but also heavier molecules, like soluble sugars and starch.
Fig. 14. Common monoterpenoids in biomass: (1) myrcene, (2) limonene, (3) β-phellandrene, (4) α-pinene, (5) β-pinene, (6) 3-carene, (7) borneol, (8) bornyl acetate,
and (9) β-thujaplicin (Sjostrom, 1993).
In the work of Da Silva Perez et al. (2015), the extractives content in woody biomasses tested vary between 1 and 8%w, whereas values extend to 25%w for
non-34 woody biomasses (see Fig. 15). The reason for the high extractives content in non-woody biomasses may be due to the presence of soluble sugars and starch, whereas extractives content in woody biomasses is linked to “classic” extractives with low molecular mass (Da Silva Perez et al., 2015; Dorado et al., 2000).
Although extractives are in minor proportion in biomass, they can have an influence on biomass characteristics, such as wood strength or color. In some cases, extractives may even be toxic (Shebani et al., 2008).
Fig. 15. Extractives content for several woody and non-woody biomasses (Da Silva Perez et al., 2015).
1.4.5. Ashes
Lignocellulosic biomass contains a low amount of inorganic matter, mostly found in ashes. They originate from salts deposited in cell walls, mainly under the form of metal salts. These salts can be carbonates, silicates, oxalates or phosphates. Different metal ions are contained in metal salts, and their presence and proportion depend on biomass type. In woody biomasses, the most abundant metal ions are calcium, potassium and magnesium. In non-woody biomasses, the most abundant metal ions are silicon, potassium and calcium. These metals can be either partially bound to the acetyl groups in xylan or held by biomass constituents through complexing forces (Sjostrom, 1993).
35 Ash content in woody biomasses is usually lower than in non-woody biomasses. In the work of Da Silva Perez et al. (2015), ashes content in woody biomasses tested represent between 1 and 4%w, while in non-woody biomasses ashes content represent between 3 and 9%w (see Fig. 16) (Da Silva Perez et al., 2015).
Fig. 16. Ashes content for several woody and non-woody biomasses (Da Silva Perez et al., 2015).
2. THE PROCESS: TORREFACTION
2.1. DEFINITION
Torrefaction is a thermal pretreatment of biomass carried out between 200 and 300°C, under atmospheric pressure and in absence of oxygen.
Biomass loses relatively more oxygen and hydrogen than carbon during torrefaction, which makes biomass acquire lower H/C and O/C ratios. This leads to densification of energy, as well as higher hydrophobicity, friability, grindability and flowability within torrefied biomass compared to raw biomass. It also simplifies the storage of biomass, since biomass becomes more resistant to fungi and bacteria (Hakkou
36 et al., 2006; van der Stelt et al., 2011). Macroscopically, it can be observed that biomass acquires brown or black color during torrefaction (see Fig. 17).
Fig. 17. Evolution of an ash-wood sample during torrefaction. From left to right: raw biomass, and biomass torrefied at 250, 280 and 300°C under the same conditions (Lê
Thành et al., 2015).
2.2. PRODUCTS
The products of torrefaction are distributed into two phases:
In the solid phase, torrefied biomass is formed;
In the gaseous phase, condensable and non-condensable species are formed. Condensable species liquefy at room temperature, like water, acetic acid, furfural, methanol and phenol. Non-condensable or permanent species remain gaseous at room temperature, like carbon dioxide and carbon monoxide.
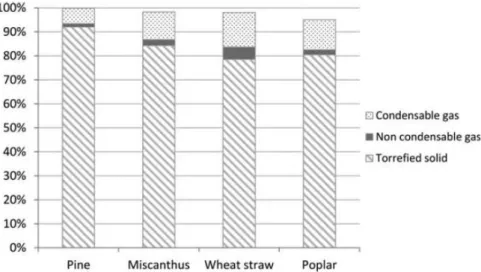
Fig. 18 shows the distribution of these three types of products in the overall mass balance obtained after torrefaction of several biomasses.
Permanent species typically represent one third of the overall torrefaction gas, whereas condensable species represent the other two thirds. Within condensable species, approximately one half is constituted by water, while the other half is constituted
37 by many different organic species, such as carboxylic acids, aldehydes and ketones (Nocquet et al., 2014a).
Fig. 18. Mass balance of products during torrefaction of several biomasses (Commandré and Leboeuf, 2015).
2.3. MASS AND ENERGY BALANCES
Fig. 19 shows typical overall mass and energy balances of torrefaction carried out within the temperature interval of 200-300°C. According to mass balance, 70% of the initial mass is retained in the torrefied solid, whereas 30% of the initial mass is contained in the gaseous phase, approximately. In contrast, energy balance indicates that the torrefied solid retains 90% of the initial energy, whereas the gaseous phase contains only 10% of the initial energy, approximately. Hence a gain of a 1.3 factor in the energy of the solid could be achieved thanks to torrefaction process (Bergman et al., 2005).
38 Fig. 19. Typical mass and energy balances of biomass torrefaction (Bergman et al.,
2005).
2.1. REACTIVITY OF BIOMASS
Among the three macro-polymeric constituents of biomass, hemicellulose seems to be the most reactive constituent during torrefaction, followed by lignin and cellulose (Bergman et al., 2005).
Before 250°C, mass loss is mainly originated by the limited devolatilization and carbonization of hemicellulose. Lignin and cellulose are also degraded but in a minor extent, indeed they suffer significant chemical changes but low mass loss. After 250°C, the effects of torrefaction are more visible. Hemicellulose suffers extensive devolatilization and charring – which is a severe carbonization –, while lignin and cellulose already show limited devolatilization and carbonization (Bergman et al., 2005). This explains the fact that, in literature, torrefaction carried out at temperatures lower than 250°C has been called mild torrefaction, whereas torrefaction carried out at temperatures higher than 250°C has been called severe torrefaction (Chew and Doshi, 2011; Tumuluru et al., 2011; van der Stelt et al., 2011).
39
2.2. PROPERTIES OF BIOMASS
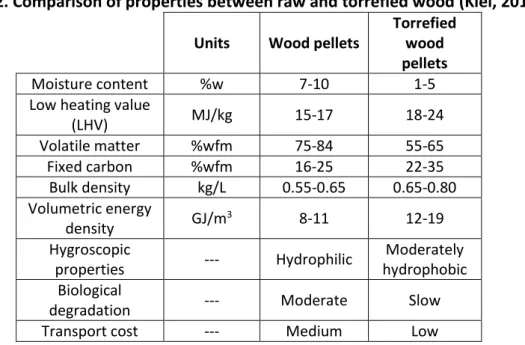
Torrefaction allows improving biomass properties from a logistic and end-use point of view (see Table 2). Torrefied biomass, in comparison with raw biomass, acquires (Kiel, 2012):
Higher bulk density, volumetric energy density, low heating value (LHV) and fixed carbon;
Lower moisture content, proportion of volatile matter, hygroscopicity and transport cost;
Slower biodegradability.
Table 2. Comparison of properties between raw and torrefied wood (Kiel, 2012). Units Wood pellets
Torrefied wood pellets
Moisture content %w 7-10 1-5
Low heating value
(LHV) MJ/kg 15-17 18-24 Volatile matter %wfm 75-84 55-65 Fixed carbon %wfm 16-25 22-35 Bulk density kg/L 0.55-0.65 0.65-0.80 Volumetric energy density GJ/m 3 8-11 12-19 Hygroscopic properties --- Hydrophilic Moderately hydrophobic Biological
degradation --- Moderate Slow
Transport cost --- Medium Low
2.3. TECHNOLOGIES
Nowadays, the development of the torrefaction technologies is at a demonstration stage. However, in the short term, it should reach the industrialization stage.
40 Several competing technologies of torrefaction coexist. Some of these technologies have been specifically developed for torrefaction process, whereas others have been adapted from other thermal industrial uses. Table 3 presents the main reactors employed for torrefaction, their constructors and experimental conditions employed, as well as advantages/limitations of each technology.
Table 3. Main technologies of torrefaction (Casajus et al., 2012; Nocquet, 2012).
Reactor Constructor Experimental
conditions Advantages Limitations
Multiple hearth furnace Wyssmont TURBO-(DRYER®), USA 200-300°C 30-90 min -Homogeneous torrefaction -Easy scale-up -Suitable for all types of
biomass
-Expensive -Developed for low
flowrates CMI, BE 200-300°C Moving bed ECN (BO2 pelletsTM), NL 200-300°C -Robust technology -Suitable for woody
biomasses
-Carrier gas may present preferential
pathways -Difficult scale-up -Not suitable for
non-woody biomasses Thermya
(TorspydTM), FR 240°C
Cyclonic bed Topell Energy (Torbed®), NL
280-320°C? Several min?
-Suitable for all types of biomass -Short residence times
-Easy scale-up -Suitable for high
flowrates -Complex design -Difficult control of process Torbed reactor Torr-coal, NL 280-300°C?
<100 min -Robust technology -Well-known technology for drying
-Suitable for the majority of biomasses
-Low efficiency on heat transfer -Heterogeneous
torrefaction -High gas flow needed EBES AG, AUT 250-300°C
BioEnergy Development, SWE ? 4 Energy Invest, BE ? Vibrating belt Atmosclear (Airless drying), CH 240-270°C -Easy control of residence time and
temperature -Easy scale-up -Suitable for the majority of biomasses -Expensive maintenance Stramproy, NL 250-300°C Screw reactor
FoxCoal, NL 250-300°C -Robust technology -Suitable for all types of
biomass
-Difficult scale-up Biolake BV, NL 260-350°C
In all these torrefaction technologies, condensable by-products are normally either removed as waste or burnt to obtain energy (Tumuluru et al., 2011). An innovative option would be to consider these species as high added-value chemicals. This is the central point of INVERTO project, discussed thereafter.
41 3. THE FRAMEWORK: INVERTO PROJECT
The INVERTO project stands for INnovation in VEgetal chemistRy by TOrrefaction, and focuses on by-products of biomass torrefaction. The general objective of this project is to study the feasibility and interest of the chemical recovery of condensable species formed during torrefaction of lignocellulosic biomass. The approach must respond to a double question. Firstly, how to optimize the production of high added-value molecules from condensable species produced during biomass torrefaction. Secondly, whether this integrated energy/mass recovery allows improving the techno-economic and environmental performance of the process.
The specific objectives of the INVERTO project are related to:
Mass balance of condensable species formed during torrefaction: an improvement on mass balances closure is aimed to more precisely know which condensable species could be potentially recovered;
Prediction of yields on condensable species versus torrefaction parameters: the influence of experimental conditions and biomass species on the presence and quantity of condensable species formed during torrefaction is poorly known. A better knowledge about reaction mechanisms of torrefaction is necessary to understand and then optimize this transformation;
Treatment of condensable species obtained during torrefaction: a critical point of the process is the treatment of condensable species in view of further extraction of the molecules of interest. The design and implementation of an adapted extraction/separation chain, as a function of downstream requirements, is essential and must be the focus of the development work;
Viability of the process pathway: proving the feasibility of the process is necessary, but not sufficient. The viability of the process pathway must be proved from both economic and environmental points of view, by integrating the concepts of product price, toxicity and ecotoxicity, related to REACH regulation and durability within a framework of sustainability.
42 The objectives of the present work refer to the point of prediction of yields on condensable species versus torrefaction parameters, as explained thereafter.
4. OBJECTIVES
The general objective of this work is to contribute to better understand the chemical evolution of the solid and gaseous phases produced during biomass torrefaction. The first step is to study the different variables which could potentially have an influence on the evolution – experimental conditions and biomass type. The second step is to elucidate the reaction mechanisms which link degradation of the solid and formation of the gas during biomass torrefaction.
In order to attain this general objective, three specific objectives are considered:
Identify and quantify chemical evolution of functional groups in the solid phase during biomass torrefaction, versus temperature and versus biomass species;
Identify and quantify production of condensable species formed in the gaseous phase during biomass torrefaction, versus temperature and versus biomass species;
Elucidate the reaction pathway which leads from reactants to products during biomass torrefaction.
These specific objectives are expected to be reached by the means of two devices. The 13C CP/MAS solid-state NMR technique is employed to characterize the chemical
evolution of the solid phase, while the TGA-GC-MS technique is employed to analyze the production of condensable species in the gaseous phase during biomass torrefaction. Then, the elucidation of torrefaction reaction mechanisms is based on the original 13C
CP/MAS solid-state NMR and TGA-GC-MS data obtained in the present work, as well as on the existing literature.
43
45 1. INTRODUCTION
Three specific aspects are investigated in literature carried out on biomass torrefaction, in relation to the objectives presented in section 4 of chapter I:
The chemical evolution of the solid phase during biomass torrefaction, versus temperature, residence time and biomass species;
The production of condensable species in the gaseous phase during biomass torrefaction, versus temperature, residence time and biomass species;
The modelling of solid degradation, gas formation and the associated reaction mechanisms during biomass torrefaction.
2. CHEMICAL EVOLUTION OF THE SOLID
2.1. WHAT DOES CHEMICAL EVOLUTION OF THE SOLID STAND FOR?
Biomass suffers a chemical evolution in composition and structure during torrefaction. More precisely, this evolution consists of changes in atoms layout within functional groups and changes in chemical bonds between atoms.
Methyl groups (-CH3) and carbonyl groups (-CO-) are examples of functional groups, while simple bonds between carbons (C-C) and double bonds (C=C) are examples of chemical bonds.
2.2. CHARACTERIZATION TECHNIQUES
2.2.1. Challenges of solid characterization during torrefaction
The characterization of the solid phase during biomass torrefaction at lab-scale presents several challenges, related to the fact that:
46
Biomass is a complex mixture of macro-polymers which contain many different functional groups and chemical bonds;
Sample masses available are relatively small, typically from 10 mg up to 1g;
Transformation occurs at high temperatures, up to 300°C.
2.2.1. Comparison of characterization techniques
Chemical evolution of the solid can be followed by the means of different characterization techniques. The principle of these techniques lies in the fact that, when biomass suffers chemical evolution, the signals emitted by the characterization device change. Then this change is detected and captured on a spectrum. Therefore, one crucial issue is to know which functional group or chemical bond corresponds to which signal.
The main techniques employed to characterize chemical evolution of biomass during torrefaction are NIRS (Near InfraRed Spectroscopy), FTIR (Fourier Transform Infrared Spectroscopy), XRD (X-Ray Diffraction) and 13C solid-state NMR (Nuclear
Magnetic Resonance). Table 4 lists these techniques, works which have employed the techniques, the objectives of works and the properties measured, as well as the advantages and limitations of each technique.
47 Table 4. Characterization techniques of biomass solid phase during torrefaction.
Technique Work Their objective Measured
properties Advantages Limitations
NIRS Windeisen et al. (2009a) Investigate the mechanical properties and chemical evolution in beech and ash-wood during torrefaction Chemical evolution of main biomass constituents within biomass samples -Fast -Non-destructive -Little or no sample preparation required -Possibility to measure energy and
chemical properties (calorific value, ultimate and proximate analysis) -Quantitative -Low sensitivity -Calibration needed on a large range of biomass samples Rousset et al. (2011) Develop a numeric model to predict the
combined effects of temperature and duration of beech
torrefaction
FTIR Park et al. (2011)
Study the chemical changes of softwood during torrefaction in a pilot-scale reactor -Fast -Quantitative -Only relative values -Preparation of samples required XRD Wen et al. (2014)
Investigate the chemical evolution versus temperature during bamboo torrefaction, with a focus on lignin
Crystallinity of cellulose within biomass samples -Non-destructive -Quantitative -Specific (mostly used to measure crystallinity index) -Crystallinity index values only
relative (higher values than in other methods) 13C solid-state NMR Ben and Ragauskas (2012)
Determine the effects of torrefaction temperature on the chemical structure of Loblolly pine Chemical evolution of main biomass constituents within biomass samples -Non-destructive -High selectivity -High resolution -Quantitative -Time-consuming for satisfactory signal-to-noise ratios -Signals of one functional group can be overlapped by signals from other groups Melkior et al. (2012)
Investigate the chemical transformation of the
main constituents in beech and elucidate the
main reaction mechanisms
Park et al. (2013b)
Study the chemical and structural transformation of Loblolly pine during
torrefaction and elucidate the main reaction mechanisms Khazraie
Shoulaifar et al. (2014)
Determine the chemical changes in the solid
phase during torrefaction of birch
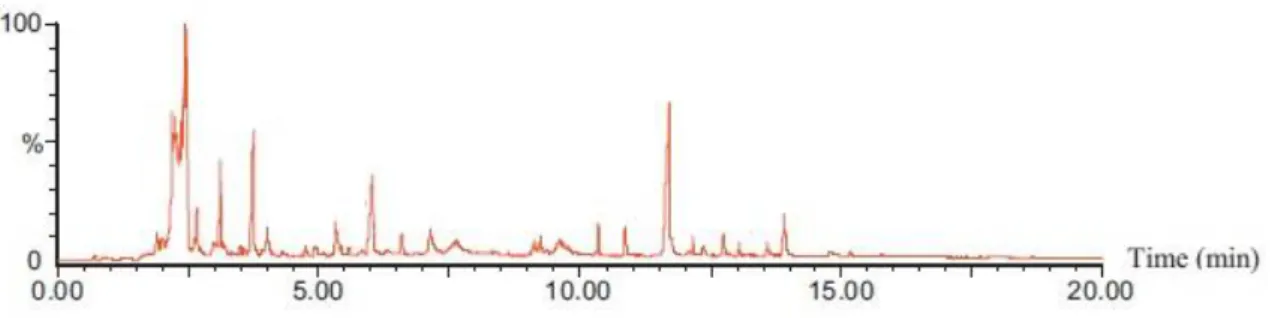
48 NIRS and FTIR techniques are both based on infrared spectroscopy, which consists of the analysis of infrared light interacting with molecules. Infrared spectroscopy measures the vibrations of atoms; as a consequence, it is possible to determine functional groups contained in the solid, each of which corresponds to a defined stretching frequency or wavenumber. As an illustration, Fig. 20 shows an example of NIRS spectra and Fig. 21 of FTIR spectra. XRD technique is based on the measurement of the interference suffered by X-rays within the sample. When the sample is irradiated with a beam of monochromatic X-rays, the interaction with atoms in the sample results in diffracted X-rays. These rays generate spectra characteristic of chemical composition of the sample. Solid-state NMR is a nuclear magnetic resonance spectroscopy in which the sample is placed in a magnetic field. Certain nuclei of the solid sample, such as 1H or 13C,
absorb the electromagnetic radiation and give in response a resonant frequency value. As an illustration, Fig. 22 shows an example of 13C solid-state NMR spectra.
49 Fig. 20. NIRS spectra of raw and torrefied beech at 220, 250 and 280°C for 1h (Rousset et
al., 2011).
50
Fig. 22. 13C CP/MAS solid-state NMR spectra of raw and torrefied samples of beech
wood (Melkior et al., 2012).
As shown in Table 4, NIRS and FTIR present an important advantage, which involves the short duration of experiments. However, they also present major limitations when the objectives of the present work are considered. NIRS has a low sensitivity, which could hinder the detection of the least abundant functional groups within the solid. FTIR requires the preparation of a concentrated dilution of the sample in a suitable solvent and then transfer on a plate, which increases the analysis time. XRD is a technique employed for specific purposes, such as measure of crystallinity index or crystallite size. Although these measurements can be useful, they are not sufficient to describe the evolution of the three main biomass constituents. The last technique, 13C solid-state
NMR, presents the advantages of high selectivity and resolution, which could deal with the complexity of the torrefied solid phase. The only limitation of this technique lies in the
51 duration of experiments, which could extend to twelve of hours if the biomass sample is very condensed after torrefaction.
2.2.1. Conclusion
When putting together the different techniques available for characterization of the chemical evolution in the solid phase and the constraints associated to this characterization, 13C solid-state NMR appears as a very good compromise. Thus the
choice was made to employ it NMR in the present work, and to detail below the results obtained through this technique in literature.
2.3. 13C SOLID-STATE NMR RESULTS DURING TORREFACTION
Qualitative chemical evolution of the solid during biomass torrefaction has been characterized with 13C solid-state NMR by several authors, as shown in Table 4 of section
2.2. As explained above, with this technique, each peak on the spectrum corresponds to a signal value or interval of values, called chemical shift. Then each chemical shift is associated to an assignment, which represents a carbon located in a determined environment within the molecule. Carbon signals can be classified as carbonyls, aromatics and alkyls, which means that the carbon atom is located in a carbonyl group, an aromatic ring or an alkyl chain, respectively (Park et al., 2013b). Acetyl groups in hemicellulose are an example of assignment type carbonyl, carbon-carbon bonds in lignin are an example of assignment type aromatic, and carbons 4 of crystalline or amorphous cellulose are examples of assignment type alkyl (Ben and Ragauskas, 2012; David et al., 2009).
One of the reference works in characterization of torrefied biomass with solid-state NMR is the work of Ben and Ragauskas (2012). First of all, they studied torrefaction of pine wood at 250°C for 30 min, as reference. They found that the intensity of the signals corresponding to carbonyl and carboxyl groups slightly rose in comparison with raw biomass, which could indicate the formation of carbonyl and carboxyl groups during torrefaction. The intensity of the signal for aromatic C-O bonds increased, which would indicate the presence of more free hydroxyl groups on aromatic rings, due to the cleavage